. 2013:4:2789.
doi: 10.1038/ncomms3789.

Involvement of mitochondrial dynamics in the segregation of mitochondrial matrix proteins during stationary phase mitophagy

Affiliations

Involvement of mitochondrial dynamics in the segregation of mitochondrial matrix proteins during stationary phase mitophagy

Hagai Abeliovich et al. Nat Commun. 2013.

Abstract

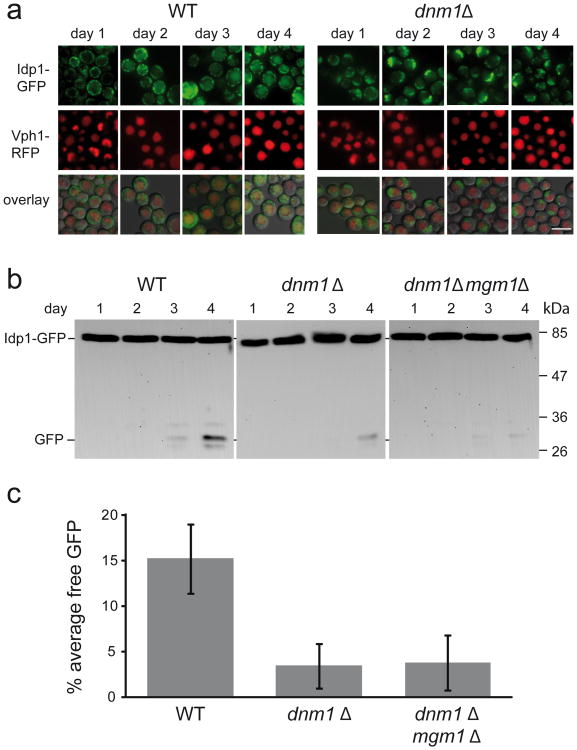
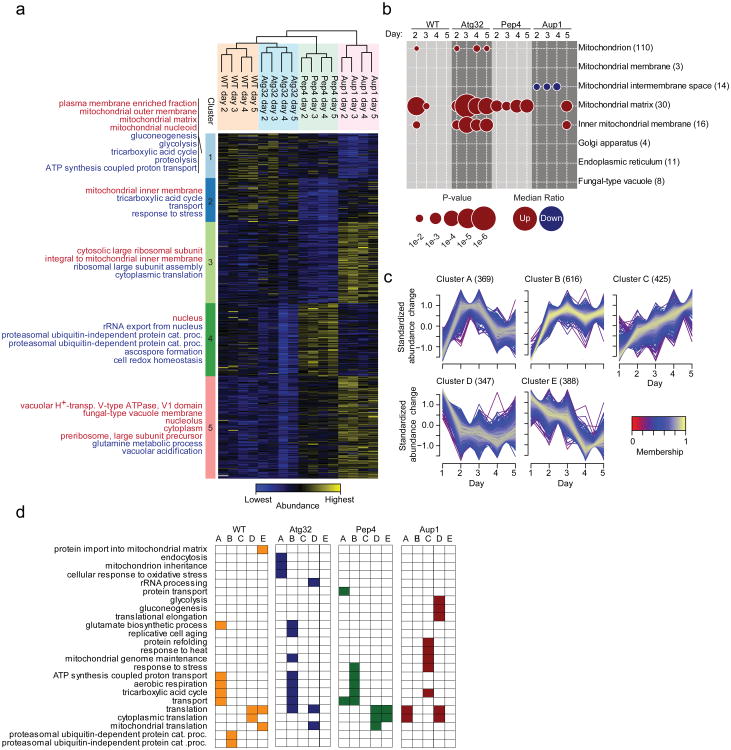
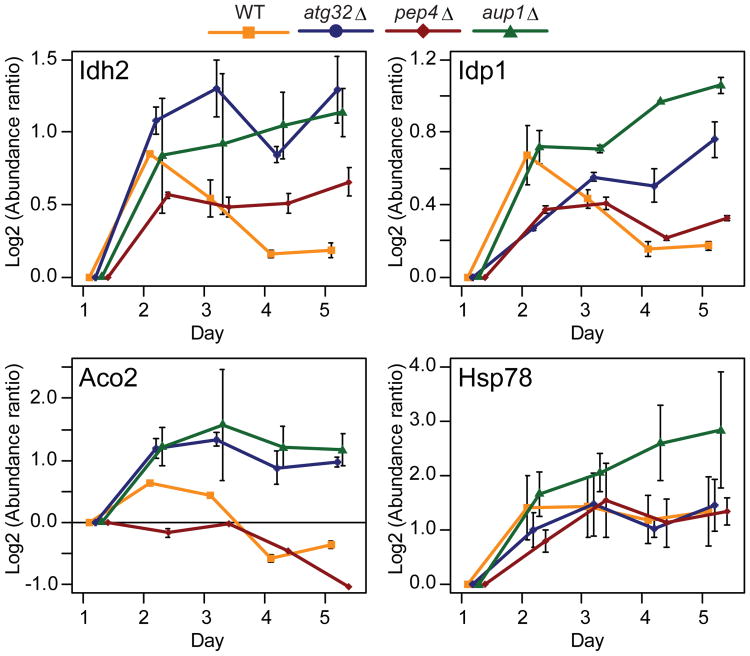
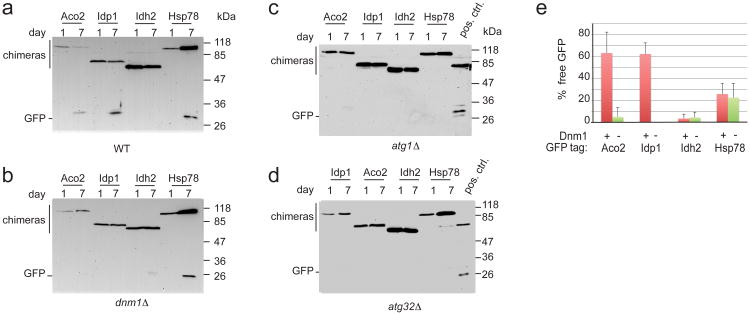
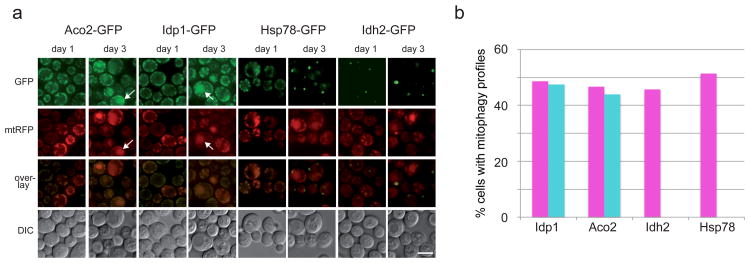
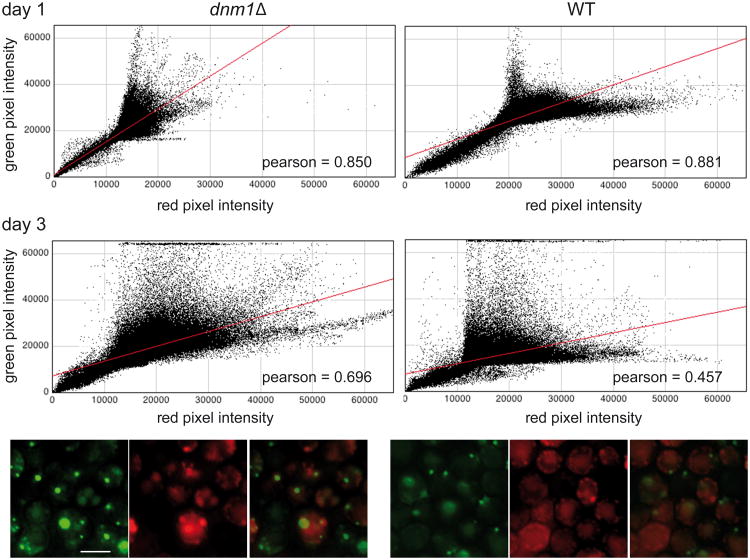
Mitophagy, the autophagic degradation of mitochondria, is an important housekeeping function in eukaryotic cells, and defects in mitophagy correlate with ageing phenomena and with several neurodegenerative disorders. A central mechanistic question regarding mitophagy is whether mitochondria are consumed en masse, or whether an active process segregates defective molecules from functional ones within the mitochondrial network, thus allowing a more efficient culling mechanism. Here we combine a proteomic study with a molecular genetics and cell biology approach to determine whether such a segregation process occurs in yeast mitochondria. We find that different mitochondrial matrix proteins undergo mitophagic degradation at distinctly different rates, supporting the active segregation hypothesis. These differential degradation rates depend on mitochondrial dynamics, suggesting a mechanism coupling weak physical segregation with mitochondrial dynamics to achieve a distillation-like effect. In agreement, the rates of mitophagic degradation strongly correlate with the degree of physical segregation of specific matrix proteins.


Figures

Figure 1
Figure 1. The kinetics of stationary phase mitophagy are determined by mitochondrial dynamics, not size
a. Wild-type and dnm1Δ cells expressing Vph1-RFP and Idp1-GFP were grown in minimal SD medium and transferred to lactate medium at an initial density of OD600 0.08. The cells were then sampled daily and analyzed by fluorescence microscopy (100x objective) during stationary phase mitophagy in lactate medium. Scale bar= 5μm. b. Wild-type, dnm1Δ and dnm1Δ mgm1Δ mutants were grown in SL medium as described in Materials and Methods, and samples (10 OD600 units) were taken at each time point. Protein extracts were prepared and equal protein amounts (20 μg) were subjected to SDS-PAGE and immunoblotting with anti-GFP antibody. c. Quantification of the percent free GFP at the day 4 time point in each of the three strains analyzed in b, using 4 independent experiments for each strain. Error bars indicate standard deviation. ANOVA, p<0.001; N=4.
Figure 2
Figure 2. Characterization of stationary phase mitophagy in wild-type and knock-out strains by quantitative proteomics
a. Global protein abundance dynamics was analyzed in four different of S. cerevisiae strains (WT, pep4Δ, atg32Δ, and aup1Δ) using SILAC. Global protein levels were analyzed over five day incubations in lactate-based minimal medium. b. To quantify changes in protein dynamics, each of the strains was labeled in lactate-based minimal media containing either normal lysine (Lys0), lysine-D4 (Lys4) or lysine-13C6-15N2 (Lys8). Samples (10 OD600 units) were taken at day 1 (Lys0), day 2 (Lys4), day 3 (Lys8), day 4 (Lys4) and day 5 (Lys8; see Methods). The mixed lysates were then separated by 1D-SDS-PAGE and the proteins were digested with LysC. The resulting peptides were analyzed by LC-MS/MS and the raw data was processed by MaxQuant. We performed two biological replicates of the complete time-course experiments for each mutant, and three replicates for the wild-type, and observed good reproducibility for all the individual experiments (Supplementary Figure S2). c. Density plot of the reproducibility of biological replicates. d. Venn diagram of the number of proteins identified from the different yeast strains. e. Principal component analysis of the Log2 transformed abundance changes of proteins identified in all strains and all time points.
Figure 3
Figure 3. Temporal dynamics of the yeast proteome during stationary phase mitophagy
a. Ratios from proteins with quantifications from all samples were log2 transformed and z-score normalized. Columns containing data from the different samples were clustered hierarchically and rows that contained protein entries were clustered by k-means. The proteins in each k-means cluster were tested for enrichment of GO CC (indicated in red) and GO BP (indicated in blue) terms. b. Proteins associated with different cellular compartments were sequentially extracted and the average of their ratios were compared with averages of remaining proteins. c. The temporal dynamics of the protein ratios in each mutant was clustered by Fuzzy c-means. d. GO BP enrichment analysis of proteins in the different clusters compared to the remaining proteins.
Figure 4
Figure 4. Temporal dynamics of selected proteins
A comparison of the SILAC-derived abundance as a function of time, for several proteins which either show differential behavior between WT and the mutants (Idh2, Idp1, Aco2) and proteins which behave similarly between all the genetic backgrounds tested (Hsp78). Shown are mean protein ratios (two replicates for mutants, three replicates for WT), error bars indicating peptide-based relative standard deviations.
Figure 5
Figure 5. Selective mitophagy of matrix proteins depends on mitochondrial dynamics
Wild type (a), dnm1Δ (b) and atg1Δ cells (c) and atg32Δ cells (d) expressing chromosomally-tagged GFP chimeras of Aco2, Idh2, Idp1 and Hsp78 were incubated in SL medium for 7 days and 10 OD600 units were sampled at day 1 and day 7, and processed for immunoblotting with anti-GFP antibodies as described in the Methods section. Positive control used in panels c and d was from dnm1Δ cells expressing Idp1-GFP from a plasmid at 4 days incubatin (Figure 1b, lane 4). Release of free GFP in wild-type cells is reproducibly variable between these reporters, and varies between 0 (Idh2) and 60% (Aco2). e. Densitometric quantification of the release of free GFP (as % of total signal) in 4 independent experiments, comparing the results between wild-type and dnm1Δ cells. Bars denote standard deviation (n=4).
Figure 6
Figure 6. Intra-mitochondrial segregation and differential mitophagic targeting
a. Cells expressing chromosomally-tagged GFP chimeras of Aco2, Idh2, Idp1 and Hsp78 as wells as a plasmid-borne (pDJB12), mitochondrially targeted RFP (mtRFP) were incubated in SL-leucine medium for 3 days and imaged daily. Aco2 and Idp1 show clear mitophagic targeting (white arrows point at specific examples) by day 3, while Idh2 and Hsp78 show weak or no mitophagy. In addition, Idh2 and Hsp78 show different degrees of segregation relative to the mtRFP marker, while Idp1-GFP and Aco2-GFP show a near-complete co-localization with mtRFP. Scale bar, 5μm. b. Quantification of the frequency of mitophagy from (a); the percentage of cells showing mitophagic profiles in the red (magenta bars; plasmid-borne mtRFP) or green (turquoise bars; integrated C-terminal GFP chimerae) was calculated for each GFP chimera. Idp-GFP, red N=76, green N=82; Aco2-GFP, red N=79, green N=82; Idh2-GFP, red N=72, green N=72; Hsp78-GFP, red N=70, green N=70.
Figure 7
Figure 7. Decreased segregation of Hsp78-GFP in dnm1Δ cells
Wild-type and dnm1Δ cells expressing integrated Hsp78-GFP and plasmid-borne mtRFP were grown on lactate medium for 3 d. Cells were imaged daily and the images were analyzed using ImageJ as described in “Methods”. Graphs illustrate the distribution of pixels associated with specific values of RFP and GFP channel intensities, respectively. Diagonal concentrations of dots indicate spatial correlation between the signals. The colored photographic panels at the bottom illustrate the increased intensity correlation of the two channels at the 3 day time point in the dnm1Δ mutant, relative to the wild-type cells. Scale bar, 5μm.

References

    1. Lemasters JJ. Selective mitochondrial autophagy, or mitophagy, as a targeted defense against oxidative stress, mitochondrial dysfunction, and aging. Rejuvenation Res. 2005;8:3–5. - PubMed
    1. Kissova I, Deffieu M, Manon S, Camougrand N. Uth1p is involved in the autophagic degradation of mitochondria. J Biol Chem. 2004;279:39068–39074. - PubMed
    1. Mendl N, et al. Mitophagy in yeast is independent of mitochondrial fission and requires the stress response gene WHI2. J Cell Sci. 2011;124:1339–1350. - PubMed
    1. Priault M, et al. Impairing the bioenergetic status and the biogenesis of mitochondria triggers mitophagy in yeast. Cell Death Differ. 2005;12:1613–1621. - PubMed
    1. Nowikovsky K, Reipert S, Devenish RJ, Schweyen RJ. Mdm38 protein depletion causes loss of mitochondrial K+/H+ exchange activity, osmotic swelling and mitophagy. Cell Death Differ. 2007;14:1647–1656. - PubMed

Publication types

Substances