. 2014 May;127(5):731-45.
doi: 10.1007/s00401-013-1212-8. Epub 2013 Nov 17.

Molecular sub-group-specific immunophenotypic changes are associated with outcome in recurrent posterior fossa ependymoma

Affiliations

Molecular sub-group-specific immunophenotypic changes are associated with outcome in recurrent posterior fossa ependymoma

Lindsey M Hoffman et al. Acta Neuropathol. 2014 May.

Abstract

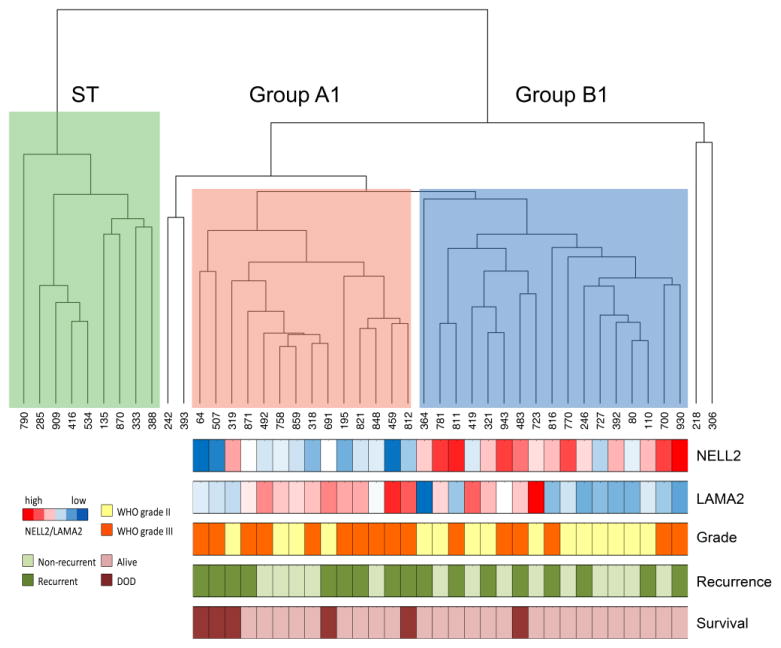
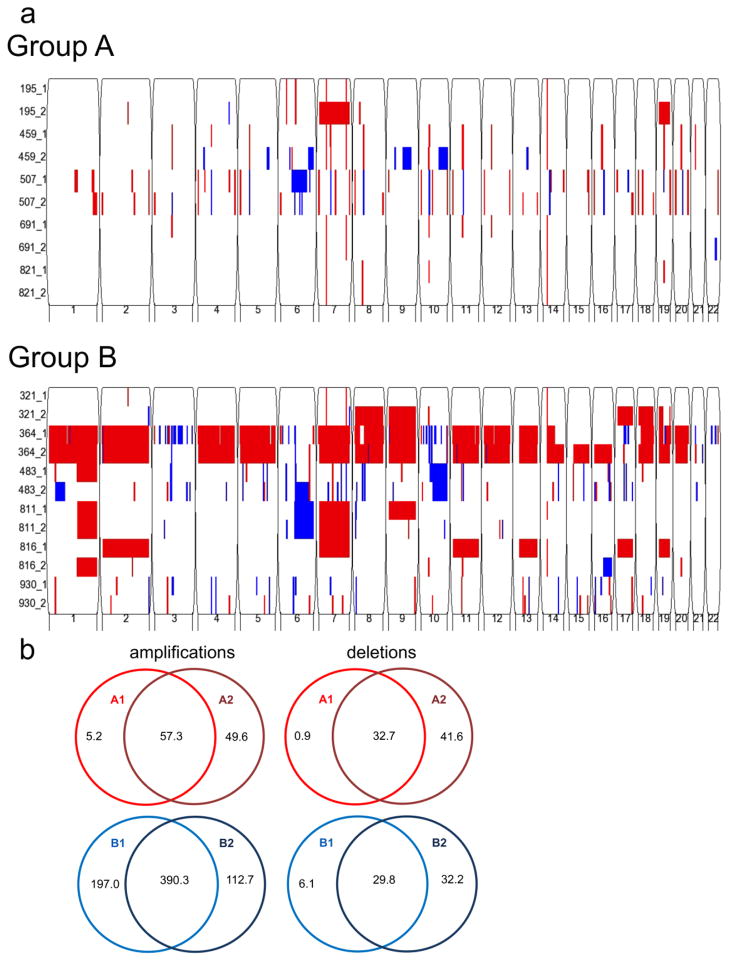
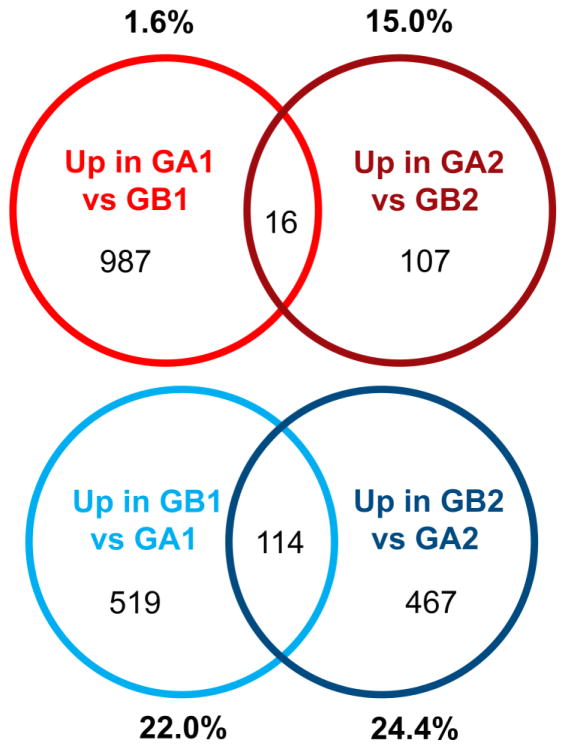
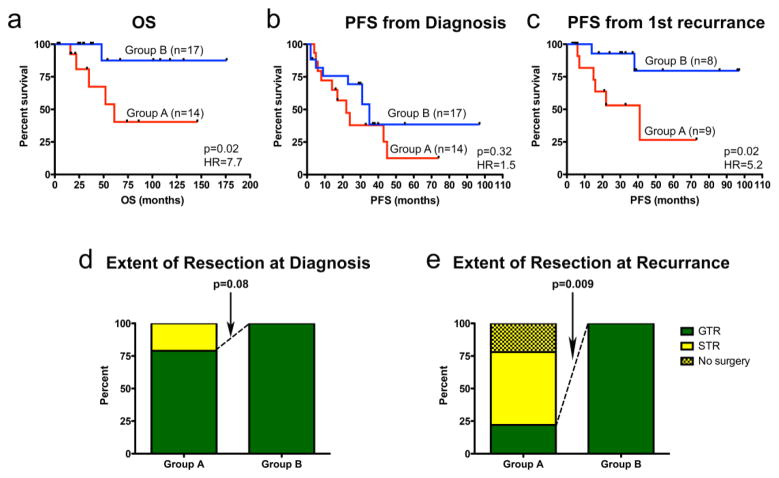
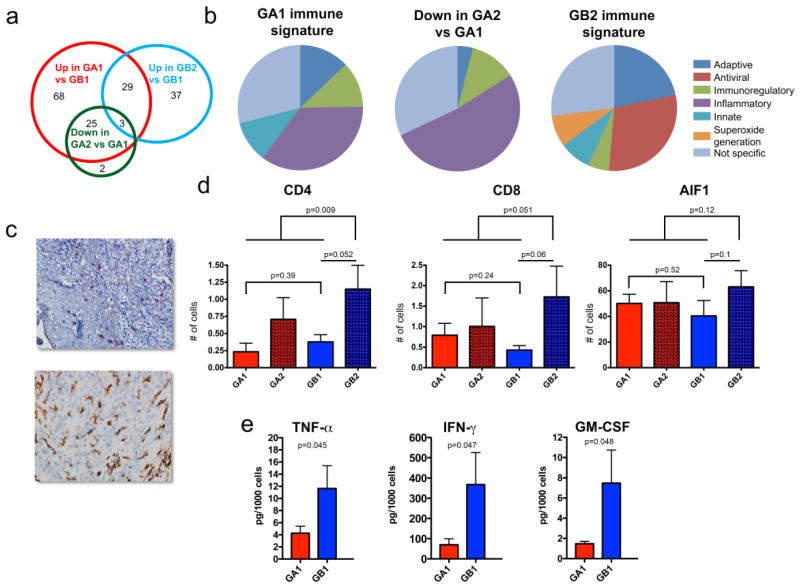
Better understanding of ependymoma (EPN) biology at relapse is needed to improve therapy at this critical event. Convincing data exist defining transcriptionally distinct posterior fossa (PF) sub-groups A and B at diagnosis. The clinical and biological consequence of these sub-groups at recurrence has not yet been defined. Genome and transcriptome microarray profiles and clinical variables of matched primary and first recurrent PF EPN pairs were used to identify biologically distinct patterns of progression between EPN sub-groups at recurrence. Key findings were validated by histology and immune function assays. Transcriptomic profiles were partially conserved at recurrence. However, 4 of 14 paired samples changed sub-groups at recurrence, and significant sub-group-specific transcriptomic changes between primary and recurrent tumors were identified, which were predominantly immune-related. Further examination revealed that Group A primary tumors harbor an immune gene signature and cellular functionality consistent with an immunosuppressive phenotype associated with tissue remodeling and wound healing. Conversely, Group B tumors develop an adaptive, antigen-specific immune response signature and increased T-cell infiltration at recurrence. Clinical distinctions between sub-groups become more apparent after first recurrence. Group A tumors were more often sub-totally resected and had a significantly shorter time to subsequent progression and worse overall survival. Minimal tumor-specific genomic changes were observed for either PF Groups A or B at recurrence. Molecular sub-groups of PF EPN convey distinct immunobiologic signatures at diagnosis and recurrence, providing potential biologic rationale to their disparate clinical outcomes. Immunotherapeutic approaches may be warranted, particularly in Group A PF EPN.


Conflict of interest statement

Conflict of Interest: The authors declare that they have no conflict of interest.

Figures

Fig. 1
Fig. 1. Transcriptome profiling reveals two posterior fossa EPN sub-groups
Unbiased hierarchical clustering of 44 primary EPN samples based on the top 5% of variant genes (n=883) reveals a distinct supratentorial (ST) located tumor sub-group (green) and 2 posterior fossa (PF) subgroups designated Group A1 (red) and B1 (blue). Four samples fell outside of the 3 main clusters and were excluded from further analyses. Below Groups A1 and B1 are a heatmap of NELL2 and LAMA2 expression and color-coded bars to indicate histologic grade (WHO grade II = yellow; WHO grade III = orange), recurrence (recurrent = dark green, non-recurrent = light green), and survival (died of disease = maroon, alive = pink).
Fig. 2
Fig. 2. Identification of sub-group-specific copy number alterations (CNA) in primary and recurrent posterior fossa EPN genomes
(a) Genomic analysis using Illumina HumanOmni 2.5-Quad BeadChip SNP microarray reveals fewer CNAs in Group A (top panel) than Group B (bottom panel). Both groups generally conserve their CNAs at recurrence. Sample number is listed on the y-axis (primary = _1, recurrence = _2), and chromosome number is listed on the x-axis. Amplification = red, deletion = blue. (b) Venn diagrams depict average copy number amplifications and deletions in kilobases. Recurrent Group A (GA2) (n=5) and Group B (GB2) (n=6) convey a similar number of CNAs to their primary counterparts, GA1 and GB1 respectively.
Fig. 3
Fig. 3. Genes distinguishing PF EPN sub-groups at recurrence are dissimilar from distinguishing genes at presentation
Venn diagrams depict minimal overlap of genes that define Group A at presentation (up in A1 vs B1) with genes that define Group A at recurrence (up in A2 vs B2). Percentages represent proportion of genes in geneset that are overlapped. Group B-defining genes showed stronger overlap by this measure, approximately a quarter of genes being conserved. immune genes overlapping between Groups A1 and A2 and Groups B1 and B2
Fig. 4
Fig. 4. Divergence of clinical outcome after first recurrence is associated with PF EPN sub-group designation at diagnosis
Kaplan-Meier plots demonstrate (a) a significantly shorter overall survival (OS) in Group A than Group B PF EPN, (b) no sub-group difference in time to first recurrence after diagnosis, and (c) a significant worse progression-free survival in Group A following first recurrence. Statistical significance was determined by log-rank test. (d) Resectability of tumors shows no significant sub-group association at diagnosis. (e) At recurrence, Group A tumors are significantly less resectable.
Fig. 5
Fig. 5. Posterior fossa EPN reveal distinct sub-group-specific immunophenotypes at diagnosis and recurrence
(a) Venn diagram of overlapping “immune response” genes that are (i) overexpressed in Group A1 versus B1 (up in A1 vs B1), (ii) overexpressed in Group B2 versus B1 (up in B2 vs B1), and (iii) decreased in Group A2 versus A1 (down in A2 vs A1). (b) Pie charts representing specific immune-functional categories for genes comprising (i) Group A1 immune signature (n=93), (ii) Group B2 immune signature (n=37), and (iii) decreased in Group A2 versus A1 immune genes that overlapped with the Group A1 immune signature (n=25). (c) Representative histology of (upper panel) tumor-infiltrating cytotoxic T-cells (CD8; red) and helper T-cells (CD4; brown), and (lower panel) tumor-infiltrating microglia/macrophages (AIF1; brown) in PF EPN (original magnification 400×). (d) Average tumor-infiltrating CD4 and CD8 positive cells per 20 high power fields (HPFs) and average tumor infiltrating AIF-1 positive cells per 10 HPFs in 6 Group A and 7 Group B matching primary and recurrent pairs. (e) Significantly higher levels of TNFα, IFNγ and GM-CSF are secreted from Group B1 than Group A1 tumor-infiltrating CD4 helper T-cells.

References

    1. Alexopoulou L, Holt AC, Medzhitov R, Flavell RA. Recognition of double-stranded RNA and activation of NF-kappaB by Toll-like receptor 3. Nature. 2001;413(6857):732–738. - PubMed
    1. Arimappamagan A, Somasundaram K, Thennarasu K, et al. A fourteen gene GBM prognostic signature identifies association of immune response pathway and mesenchymal subtype with high risk group. PLoS ONE. 2013;8(4):e62042. - PMC - PubMed
    1. Ashburner M, Ball CA, Blake JA, et al. Gene ontology: tool for the unification of biology. The Gene Ontology Consortium. Nat Genet. 2000;25(1):25–29. - PMC - PubMed
    1. Bouffet E, Perilongo G, Canete A, Massimino M. Intracranial ependymomas in children: a critical review of prognostic factors and a plea for cooperation. Med Pediatr Oncol. 1998;30(6):319–29. discussion 329–31. - PubMed
    1. Choi C, Xu X, Oh JW, Lee SJ, Gillespie GY, Park H, Jo H, Benveniste EN. Fas-induced expression of chemokines in human glioma cells: involvement of extracellular signal-regulated kinase 1/2 and p38 mitogen-activated protein kinase. Cancer Res. 2001;61(7):3084–3091. - PubMed

Publication types

MeSH terms