

Comparison of a novel method vs the Friedewald equation for estimating low-density lipoprotein cholesterol levels from the standard lipid profile
- PMID: 24240933
- PMCID: PMC4226221
- DOI: 10.1001/jama.2013.280532
Comparison of a novel method vs the Friedewald equation for estimating low-density lipoprotein cholesterol levels from the standard lipid profile
Abstract
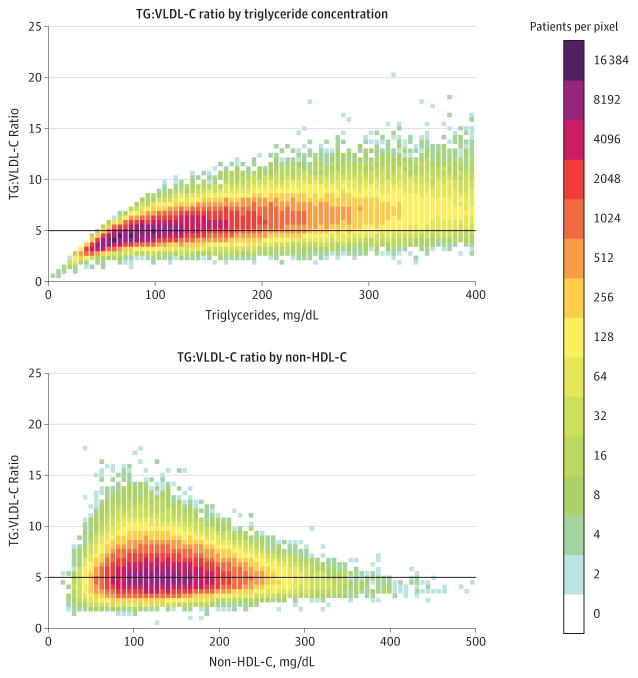
Importance: In clinical and research settings worldwide, low-density lipoprotein cholesterol (LDL-C) is typically estimated using the Friedewald equation. This equation assumes a fixed factor of 5 for the ratio of triglycerides to very low-density lipoprotein cholesterol (TG:VLDL-C); however, the actual TG:VLDL-C ratio varies significantly across the range of triglyceride and cholesterol levels.
Objective: To derive and validate a more accurate method for LDL-C estimation from the standard lipid profile using an adjustable factor for the TG:VLDL-C ratio.
Design, setting, and participants: We used a convenience sample of consecutive clinical lipid profiles obtained from 2009 through 2011 from 1,350,908 children, adolescents, and adults in the United States. Cholesterol concentrations were directly measured after vertical spin density-gradient ultracentrifugation, and triglycerides were directly measured. Lipid distributions closely matched the population-based National Health and Nutrition Examination Survey (NHANES). Samples were randomly assigned to derivation (n = 900,605) and validation (n = 450,303) data sets.
Main outcomes and measures: Individual patient-level concordance in clinical practice guideline LDL-C risk classification using estimated vs directly measured LDL-C (LDL-CD).
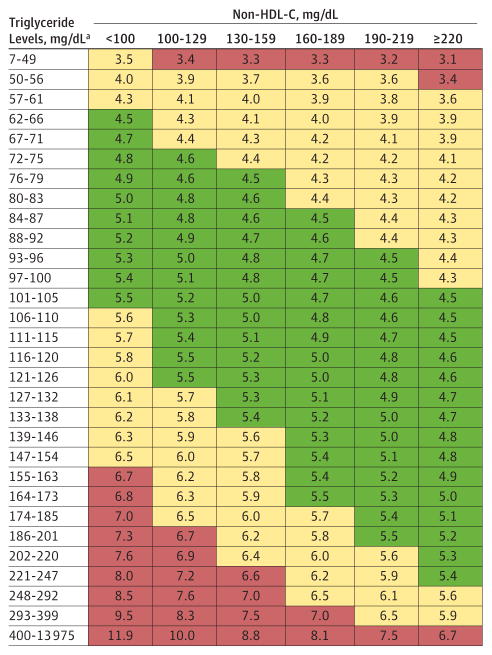
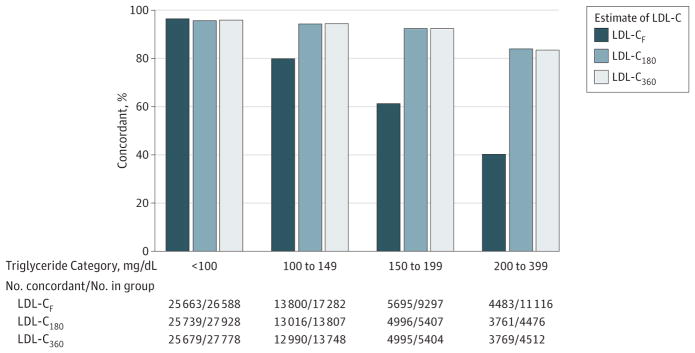
Results: In the derivation data set, the median TG:VLDL-C was 5.2 (IQR, 4.5-6.0). The triglyceride and non-high-density lipoprotein cholesterol (HDL-C) levels explained 65% of the variance in the TG:VLDL-C ratio. Based on strata of triglyceride and non-HDL-C values, a 180-cell table of median TG:VLDL-C values was derived and applied in the validation data set to estimate the novel LDL-C (LDL-CN). For patients with triglycerides lower than 400 mg/dL, overall concordance in guideline risk classification with LDL-CD was 91.7% (95% CI, 91.6%-91.8%) for LDL-CN vs 85.4% (95% CI, 85.3%-85.5%) for Friedewald LDL-C (LDL-CF) (P < .001). The greatest improvement in concordance occurred in classifying LDL-C lower than 70 mg/dL, especially in patients with high triglyceride levels. In patients with an estimated LDL-C lower than 70 mg/dL, LDL-CD was also lower than 70 mg/dL in 94.3% (95% CI, 93.9%-94.7%) for LDL-CN vs 79.9% (95% CI, 79.3%-80.4%) for LDL-CF in samples with triglyceride levels of 100 to 149 mg/dL; 92.4% (95% CI, 91.7%-93.1%) for LDL-CN vs 61.3% (95% CI, 60.3%-62.3%) for LDL-CF in samples with triglyceride levels of 150 to 199 mg/dL; and 84.0% (95% CI, 82.9%-85.1%) for LDL-CN vs 40.3% (95% CI, 39.4%-41.3%) for LDL-CF in samples with triglyceride levels of 200 to 399 mg/dL (P < .001 for each comparison).
Conclusions and relevance: A novel method to estimate LDL-C using an adjustable factor for the TG:VLDL-C ratio provided more accurate guideline risk classification than the Friedewald equation. These findings require external validation, as well as assessment of their clinical importance. The implementation of these findings into clinical practice would be straightforward and at virtually no cost.
Trial registration: clinicaltrials.gov Identifier: NCT01698489.
Conflict of interest statement
Figures
Comment in
-
What's new with measuring cholesterol?JAMA. 2013 Nov 20;310(19):2043-4. doi: 10.1001/jama.2013.282775. JAMA. 2013. PMID: 24240929 No abstract available.
-
[What are the advantages of the modified Friedewald equation?--Modified Friedwald equation measures LDL-cholesterol more exactly].Dtsch Med Wochenschr. 2014 Jan;139(5):180. doi: 10.1055/s-0033-1353887. Epub 2014 Jan 21. Dtsch Med Wochenschr. 2014. PMID: 24449350 German. No abstract available.
References
-
- Friedewald WT, Levy RI, Fredrickson DS. Estimation of the concentration of low-density lipoprotein cholesterol in plasma, without use of the preparative ultracentrifuge. Clin Chem. 1972;18(6):499–502. - PubMed
-
- DeLong DM, DeLong ER, Wood PD, Lippel K, Rifkind BM. A comparison of methods for the estimation of plasma low- and very low-density lipoprotein cholesterol: the Lipid Research Clinics Prevalence Study. JAMA. 1986;256(17):2372–2377. - PubMed
-
- Expert Panel on Detection, Evaluation, and Treatment of High Blood Cholesterol in Adults. Executive summary of the third report of the National Cholesterol Education Program (NCEP) expert panel on detection, evaluation, and treatment of high blood cholesterol in adults (Adult Treatment Panel III) JAMA. 2001;285(19):2486–2497. - PubMed
-
- National Cholesterol Education Program (NCEP) Expert Panel on Detection, Evaluation, and Treatment of High Blood Cholesterol in Adults (Adult Treatment Panel III). . Third Report of the National Cholesterol Education Program (NCEP) Expert Panel on Detection, Evaluation, and Treatment of High Blood Cholesterol in Adults (Adult Treatment Panel III) final report. Circulation. 2002;106(25):3143–3421. - PubMed
-
- Grundy SM, Cleeman JI, Merz CN, et al. National Heart, Lung, and Blood Institute; American College of Cardiology Foundation; American Heart Association. Implications of recent clinical trials for the National Cholesterol Education Program Adult Treatment Panel III guidelines. Circulation. 2004;110(2):227–239. - PubMed
Publication types
MeSH terms
Substances
Associated data
Grants and funding
LinkOut - more resources
Full Text Sources
Other Literature Sources
Medical
Miscellaneous
