. 2013:4:2799.
doi: 10.1038/ncomms3799.

Autophagy proteins regulate ERK phosphorylation

Affiliations
Free PMC article

Autophagy proteins regulate ERK phosphorylation

Nuria Martinez-Lopez et al. Nat Commun. 2013.
Free PMC article

Abstract

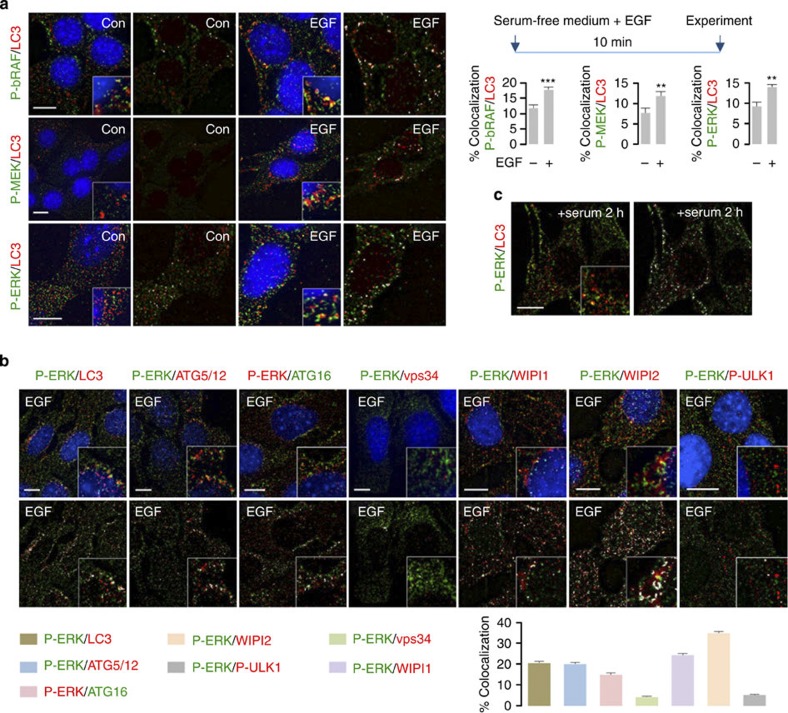
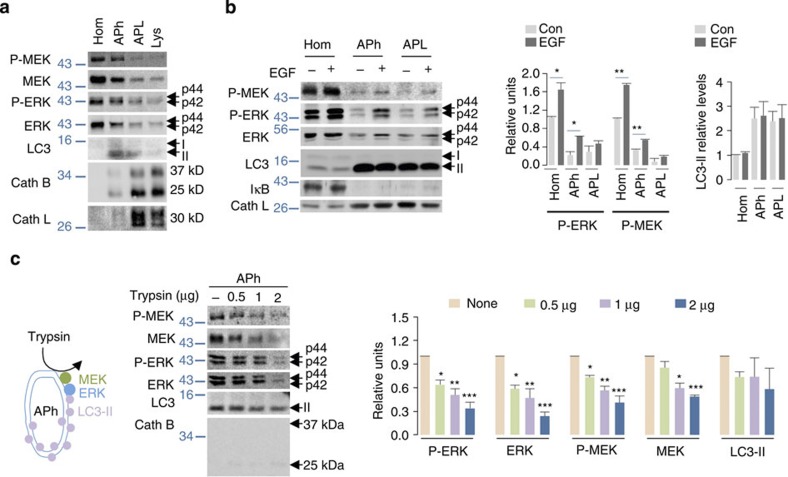
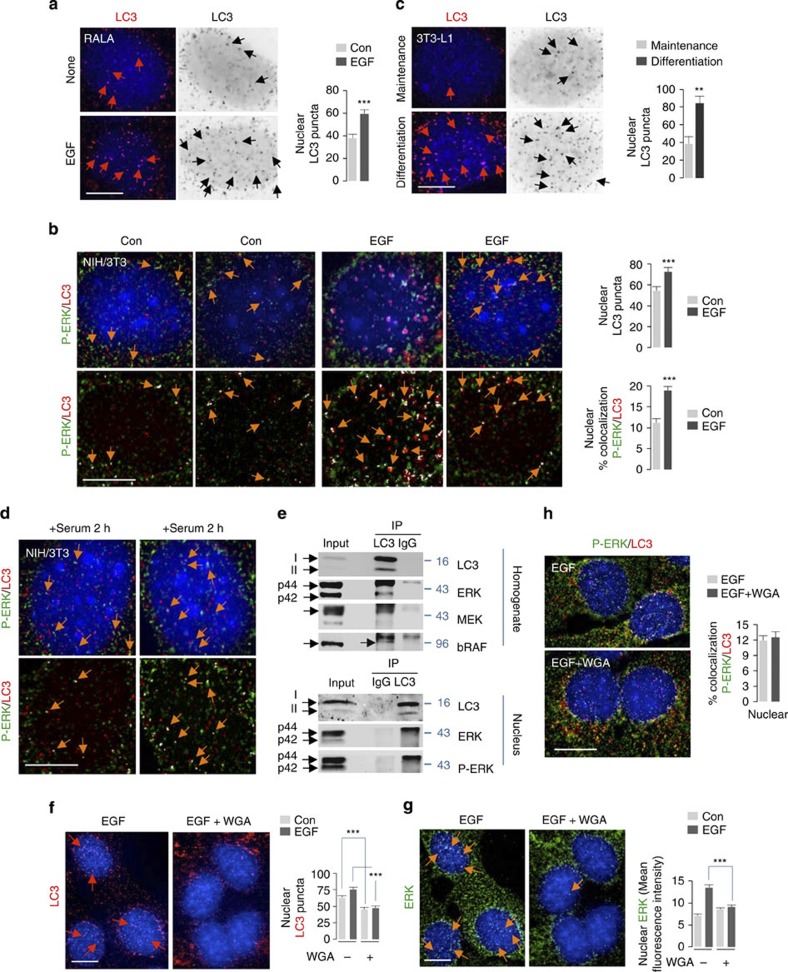
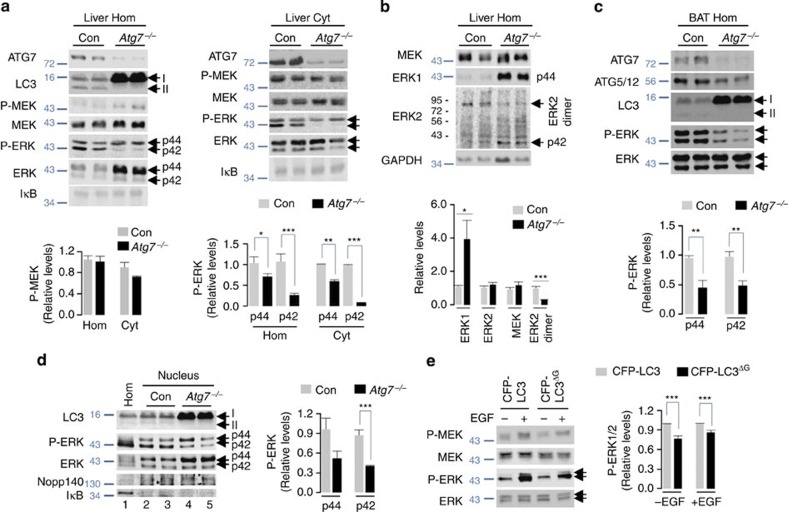
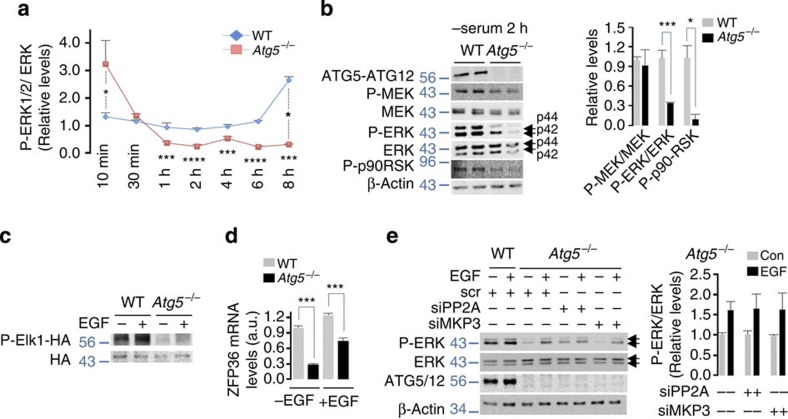
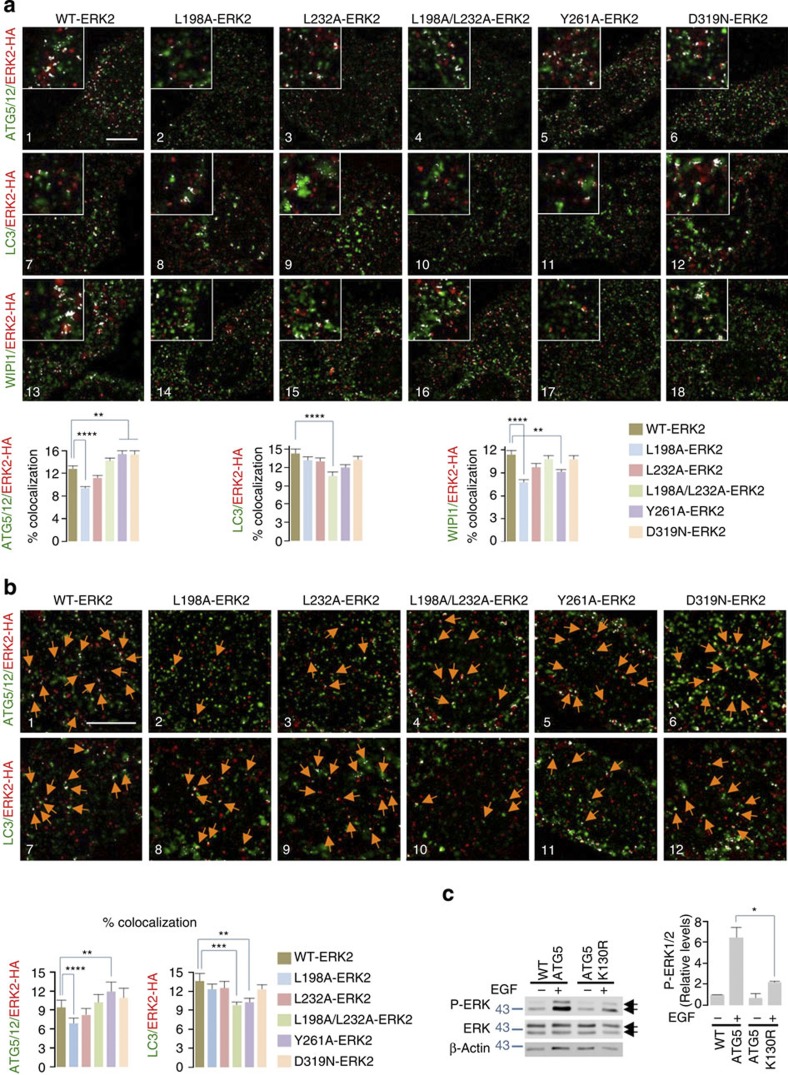
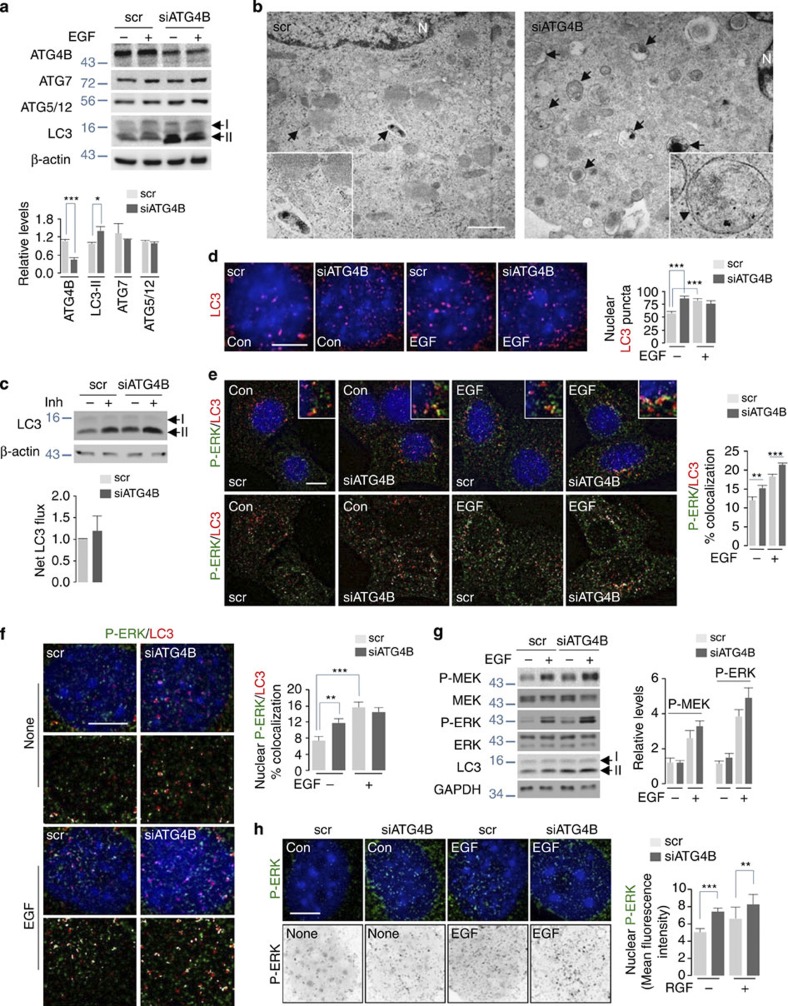
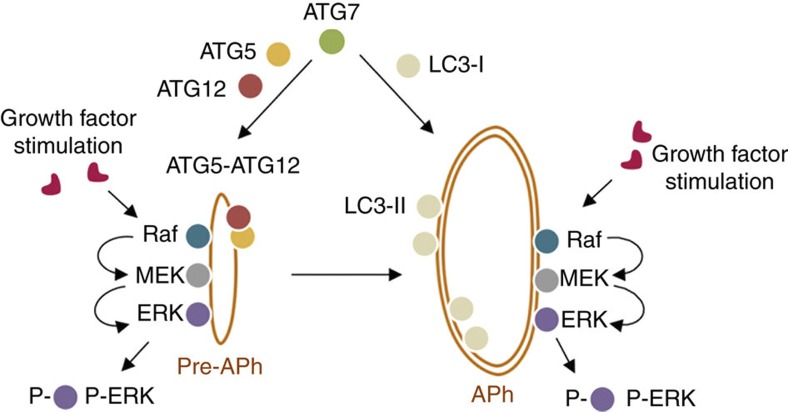
Autophagy is a conserved pathway that maintains cellular quality control. Extracellular signal-regulated kinase (ERK) controls various aspects of cell physiology including proliferation. Multiple signalling cascades, including ERK, have been shown to regulate autophagy, however whether autophagy proteins (ATG) regulate cell signalling is unknown. Here we show that growth factor exposure increases the interaction of ERK cascade components with ATG proteins in the cytosol and nucleus. ERK and its upstream kinase MEK localize to the extra-luminal face of autophagosomes. ERK2 interacts with ATG proteins via its substrate-binding domains. Deleting Atg7 or Atg5 or blocking LC3 lipidation or ATG5-ATG12 conjugation decreases ERK phosphorylation. Conversely, increasing LC3-II availability by silencing the cysteine protease ATG4B or acute trehalose exposure increases ERK phosphorylation. Decreased ERK phosphorylation in Atg5⁻/⁻ cells does not occur from overactive phosphatases. Our findings thus reveal an unconventional function of ATG proteins as cellular scaffolds in the regulation of ERK phosphorylation.


Figures

Figure 1
Figure 1. Components of the ERK signalling cascade associate with APh.
(a) EGF enhances colocalization of phosphorylated (P)-bRAF, P-MEK and P-ERK with LC3. Immunofluorescence (IF) showing colocalization of P-bRAF (green), P-MEK (green) and P-ERK (green) with LC3 (red) in NIH/3T3 cells in presence or absence of EGF (10 min as shown in scheme). The bars represent mean±s.e.m. **P<0.01, ***P<0.001; Student’s t-test, 60 cells analysed from two experiments. Scale bars, 10 μm. (b) P-ERK colocalizes with pre-autophagosomal and autophagosomal structures. IF depicting colocalization of P-ERK (green or red) with LC3 (red), ATG5–ATG12 (red), ATG16 (green), vps34 (red), WIPI1 (red), WIPI2 (red) and P-ULK1 (red) in EGF-treated NIH/3T3 cells. Scale bars, 10 μm. The bars represent mean±s.e.m. 50 cells analysed from two experiments. (c) Growth factors in serum maintain P-ERK/LC3 colocalization. IF depicting colocalization of P-ERK (green) with LC3 (red) in 2 h serum-fed NIH/3T3 cells. (ac) Native merged images or images with colocalization highlighted in white pixels are shown. Nuclei are blue (DAPI). Scale bar, 10 μm.
Figure 2
Figure 2. MEK and ERK localize to the cytoplasmic face of APh.
(a) P- and total MEK and ERK are enriched in APh in vivo. Immunoblots for indicated proteins in homogenate (Hom), APh, APL and Lys fractions from livers of fed mice, n=4. (b) EGF enhances enrichment of P-MEK and ERK in APh fractions in vitro. Immunoblots for indicated proteins in Hom, APh and APL fractions from NIH/3T3 cells in presence or absence of EGF (10 min). The bars represent mean±s.e.m. *P<0.05, **P<0.01; Student’s t-test, n=3. (c) P- and total MEK and ERK localize on to the cytoplasmic/extra-luminal face of APh in vivo. Left; model depicting localization of MEK and ERK on the extra-luminal face of autophagic vesicles and the ability of trypsin to degrade extra-luminal MEK and ERK, and right; immunoblots for indicated proteins in APh fractions from mice livers untreated (−) or treated with increasing amounts of trypsin for 15 min. The bars represent mean±s.e.m. *P<0.05, **P<0.01, ***P<0.001 compared with corresponding trypsin-untreated value; ANOVA–Bonferroni post hoc test, n=3. The p44, p42 forms of ERK, LC3-I and membrane-associated LC3-II, and 37 kDa and 25 kDa forms of cathepsin (Cath) B are indicated.
Figure 3
Figure 3. ERK cascade components interact with LC3.
(a) EGF enhances nuclear LC3-II content in hepatocytes. Immunofluorescence (IF) depicting nuclear LC3-II in RALA hepatocytes in presence or absence of EGF (10 min). Native/inverted images are shown. Scale bar, 5 μm. Bars represent mean±s.e.m. ***P<0.001 compared with control (Con); Student’s t-test, 50 cells from two experiments. (b) EGF enhances nuclear P-ERK/LC3-II colocalization. IF depicting P-ERK (green)/LC3-II (red) colocalization in untreated (Con) or EGF-treated NIH/3T3 cells. Native images (top)/images with colocalization in white pixels (bottom) are shown. Scale bar, 5 μm. Bars represent mean±s.e.m. ***P<0.001 compared with Con; Student’s t-test, 50 cells from two experiments. (c) Adipogenic differentiation increases nuclear LC3-II. Images depict nuclear LC3-II in 3T3-L1 preadipocytes in maintenance or differentiation medium (2 h). Scale bar, 5 μm. Bars represent mean±s.e.m. **P<0.01 compared with Con; Student’s t-test, 50 cells from two experiments. (d) Nuclear P-ERK/LC3-II colocalization in serum-fed cells. IF showing P-ERK (green)/LC3 (red) colocalization in 2 h serum-fed NIH/3T3 cells. Native images (top)/images with colocalization in white pixels (bottom) are shown. Scale bar, 5 μm. (e) LC3 interacts with ERK in vivo. Immunoblots showing co-immunoprecipitation of LC3 with ERK, MEK and bRAF in homogenate (Hom) (e, top), and of LC3 with P- and total ERK in nuclear fractions from mouse livers (e, bottom). (f) Blocking nuclear transport decreases EGF-induced increase in nuclear LC3-II. LC3 IF (red) in EGF-treated NIH/3T3 cells pre-exposed (30 min) or not to WGA. Bars represent mean±s.e.m. ***P<0.001 compared to with; Student’s t-test, 60 cells from n=3. Scale bar, 10 μm. (g) Blocking nuclear transport decreases nuclear ERK content. ERK IF (green) in EGF-treated NIH/3T3 cells pre-exposed (30 min) or not to WGA. Bars represent mean±s.e.m. ***P<0.001 compared with Con; Student’s t-test. (h) Blocking nuclear transport does not modify P-ERK/LC3-II colocalization. IF depicting nuclear P-ERK (green)/LC3 (red) colocalization in EGF-treated NIH/3T3 cells pre-exposed or not to WGA. For (g) and (h): Scale bar, 10 μm, bars are mean±s.e.m. 50 cells from n=2. Nuclei are blue (DAPI). Arrows indicate LC3 puncta, ERK or colocalization.
Figure 4
Figure 4. ATG7/LC3-II regulates ERK phosphorylation.
(a) Atg7−/− livers display decreased ERK phosphorylation. Immunoblots for the indicated proteins in liver homogenate (Hom) and cytosolic (Cyt) fractions of control (Con) and liver-specific Atg7−/− mice are shown. The bars represent mean±s.e.m. *P<0.05, **P<0.01, ***P<0.001 compared with Con; Student’s t-test, n=4. (b) Atg7−/− livers display decreased ERK2 dimers. Immunoblots show the indicated proteins in Hom from Con and Atg7−/− livers. The bars represent mean±s.e.m. *P<0.05, ***P<0.001 compared to Con; Student’s t-test, n=4–5. Arrows indicate p42 monomers and dimers. (c) Atg7−/− brown adipose tissues (BAT) display decreased ERK phosphorylation. Immunoblots for indicated proteins in Hom from Con and Atg7−/−BAT. The bars represent mean±s.e.m. **P<0.01 compared with Con; Student’s t-test, n=4–6. (d) Atg7−/− livers exhibit decreased nuclear ERK phosphorylation. Immunoblots show the indicated proteins in homogenate (Hom, lane 1) and nuclear fractions (lanes 2–5) from Con and Atg7−/− livers. The bars represent mean±s.e.m. ***P<0.001 compared with Con; Student’s t-test, n=4–5. (e) LC3 C terminus glycine-deleted (ΔG) mutants exhibit decreased ERK phosphorylation. Immunoblots for indicated proteins in total lysates from CFP-LC3- and CFP-LC3ΔG-transfected NIH/3T3 cells exposed or not to EGF (10 min). The bars represent mean±s.e.m. ***P<0.001 compared with Con; Student’s t-test, n=8.
Figure 5
Figure 5. ERK phosphorylation in Atg5−/−cells depends on nutrient availability.
(a) Atg5−/− MEFs display reduced ERK phosphorylation during nutrient deprivation. Quantification of P-ERK levels normalized to total ERK (detected by immunoblotting) in WT and Atg5−/− MEFs cultured in the absence of serum for indicated times. The bars represent mean±s.e.m. *P<0.05 compared with corresponding WT value; ***P<0.001, ****P<0.0001 compared with 10 min serum-starved Atg5−/− MEFs; ANOVA-Bonferroni post hoc test, n=3. (b) Serum-deprived Atg5−/− MEFs display decreased ERK and p90RSK phosphorylation. Immunoblots for the indicated proteins in total lysates from 2 h serum-deprived WT and Atg5−/− MEFs. The bars represent mean±s.e.m. *P<0.05, ***P<0.001 compared with Con; Student’s t-test, n=3. (c) Atg5−/− MEFs display decreased nuclear ERK activity. Immunoblots for phosphorylated HA (haemagglutinin)-tagged Elk1 in total lysates from 2 h serum-deprived WT and Atg5−/− MEFs cells exposed or not to EGF (10 min). (d) Atg5−/− MEFs display decreased Elk1-driven gene expression. Elk1-driven ZFP36 mRNA levels from 2 h serum-deprived WT and Atg5−/− MEFs cells exposed or not to EGF (10 min). The bars represent mean±s.e.m. ***P<0.001 compared with Con; Student’s t-test, n=3. (e) Decreased ERK phosphorylation in Atg5−/− MEFs occurs independently of changes in ERK phosphatases. Immunoblots for the indicated proteins in 2 h serum-deprived WT MEFs transfected with scrambled siRNA (scr), and Atg5−/− MEFs transfected with scr or siRNAs against MKP3 or PP2A in the presence or absence of EGF. The bars represent mean±s.e.m., n=3.
Figure 6
Figure 6. ERK2 utilizes kinase-docking domains to interact with ATG5–ATG12 and LC3-II.
(a) Mutations in FRS on ERK2 decrease colocalization of ERK2 with ATG5–ATG12, LC3 and WIPI1. Immunofluorescence (IF) showing colocalization (depicted as white pixels by ‘colocalization finder application’) of WT-ERK2-HA, FRS ERK2 mutants (L198A-, L232A-, L198A/L232A-, Y261A-ERK2-HA) or common docking (CD) mutant (D319N-ERK2-HA) with ATG5–ATG12 (panels 1–6), LC3 (panels 7–12) or WIPI1 (panels 13–18) in EGF-treated NIH/3T3 cells. ERK2 is stained in red, and autophagy proteins are stained in green. Scale bar, 10 μm. The bars represent mean±s.e.m. **P<0.01, ****P<0.0001 compared with WT-ERK2-transfected cells; Student’s t-test, 50 cells analysed from n=2. (b) Mutations in FRS on ERK2 decrease colocalization of ERK2 with nuclear ATG5–ATG12 or LC3. IF showing colocalization (white pixels) of WT-ERK2-HA (red), FRS ERK2 mutants (L198A-, L232A-, L198A/L232A-, Y261A-ERK2-HA) or common docking (CD) mutant (D319N-ERK2-HA) with ATG5–ATG12 (panels 1–6) or LC3-II (panels 7–12) in EGF-treated NIH/3T3 cells. Scale bar, 5 μm. The bars represent mean±s.e.m. **P<0.01, ***P<0.001, ****P<0.0001 compared with WT-ERK2-transfected cells; Student’s t-test, 50 cells analysed from n=2. Arrows depict colocalization. (c) ATG5–ATG12 conjugation is required for ERK phosphorylation. Immunoblots for P-ERK, total ERK and β-actin in NIH/3T3 cells transfected with WT ATG5 or the conjugation-defective ATG5 K130R mutant and treated with EGF (10 min). The bars represent mean±s.e.m. *P<0.05 compared with WT ATG5-transfected cells; Student’s t-test, n=3.
Figure 7
Figure 7. Silencing ATG4B increases LC3-II content and ERK phosphorylation.
(a) ATG4B depletion increases steady-state LC3-II levels. Immunoblots for indicated proteins in NIH/3T3 cells transfected with scrambled siRNAs (scr) or siRNAs against ATG4B (siATG4B) in presence/absence of EGF. Bars represent mean±s.e.m. *P<0.05, ***P<0.001 compared with scr; Student’s t-test, n=4. (b) siATG4B cells exhibit increased autophagic vesicles. Representative electron micrographs depicting autophagic vesicles (indicated by black arrows) in scr and siATG4B NIH/3T3 cells. (c) ATG4B depletion does not increase autophagic flux in serum-fed cells. Immunoblots for indicated proteins in lysates from scr or siATG4B NIH/3T3 cells in presence/absence of lysosomal inhibitors, ammonium chloride and leupeptin (Inh) for 2 h. Scale bars, 1 μm. Bars represent mean±s.e.m., n=3. (d) siATG4B cells display increased nuclear LC3-II. Images for LC3-II (red) in scr or siATG4B NIH/3T3 cells in presence/absence of EGF (10 min). Scale bar, 5 μm. Bars represent mean±s.e.m. ***P<0.001 compared with scr; Student’s t-test, 60 cells from n=2. (e) ATG4B deficiency increases P-ERK/LC3-II colocalization. Immunofluorescence (IF) for P-ERK (green)/LC3 (red) colocalization in scr or siATG4B NIH/3T3 cells in presence/absence of EGF (10 min). Scale bars, 10 μm. Bars represent mean±s.e.m. **P<0.01, ***P<0.001 compared with scr; Student’s t-test, 60 cells from n=2. (f) ATG4B-deficient cells display increased nuclear P-ERK/LC3 colocalization. IF depicting P-ERK (green)/LC3 (red) colocalization in nuclei of scr or siATG4B NIH/3T3 cells in presence/absence of EGF. Scale bars, 5 μm. Bars represent mean±s.e.m. **P<0.01, ***P<0.001 compared with scr; Student’s t-test, 60 cells from n=2. (g) ATG4B deficiency augments EGF-induced MEK and ERK phosphorylation. Immunoblots for P- and total MEK and ERK, LC3 and GAPDH in total lysates from scr or siATG4B NIH/3T3 cells in presence/absence of EGF. Bars represent mean±s.e.m., n=3. (h) ATG4B deficiency increases nuclear P-ERK levels. Native (top)/inverted images (bottom) showing nuclear P-ERK content. P-ERK fluorescence in untreated (Con)/EGF-treated scr or siATG4B NIH/3T3 cells is shown. Scale bars, 5 μm. Bars represent mean±s.e.m. **P<0.01, ***P<0.001 compared with scr; Student’s t-test, 60 cells from n=2. Nuclei are blue (DAPI).
Figure 8
Figure 8. Autophagy proteins regulate ERK phosphorylation.
We propose that growth factor stimulation results in the docking of the ERK cascade components, Raf, MEK and ERK onto the cytoplasmic face of autophagic structures. ATG5–ATG12-positive preautophagosomes and LC3-II-positive membranes serve as scaffolds or cellular signalling platforms that facilitate efficient spatial coordination of the Raf–MEK–ERK cascade and thus facilitate growth factor-induced ERK phosphorylation.

References

    1. Shaul Y. D. & Seger R. The MEK/ERK cascade: from signaling specificity to diverse functions. Biochim. Biophys. Acta 1773, 1213–1226 2007. - PubMed
    1. Murphy L. O. & Blenis J. MAPK signal specificity: the right place at the right time. Trends Biochem. Sci. 31, 268–275 (2006). - PubMed
    1. Settembre C. et al. TFEB links autophagy to lysosomal biogenesis. Science 332, 1429–1433 (2011). - PMC - PubMed
    1. Colecchia D. et al. MAPK15/ERK8 stimulates autophagy by interacting with LC3 and GABARAP proteins. Autophagy 8, 1724–1740 (2012). - PMC - PubMed
    1. Pankiv S. et al. p62/SQSTM1 binds directly to Atg8/LC3 to facilitate degradation of ubiquitinated protein aggregates by autophagy. J. Biol. Chem. 282, 24131–24145 (2007). - PubMed

Publication types

MeSH terms

Substances