. 2014 Jan;17(1):106-13.
doi: 10.1038/nn.3582. Epub 2013 Nov 17.

Prefrontal entrainment of amygdala activity signals safety in learned fear and innate anxiety

Affiliations

Prefrontal entrainment of amygdala activity signals safety in learned fear and innate anxiety

Ekaterina Likhtik et al. Nat Neurosci. 2014 Jan.

Abstract

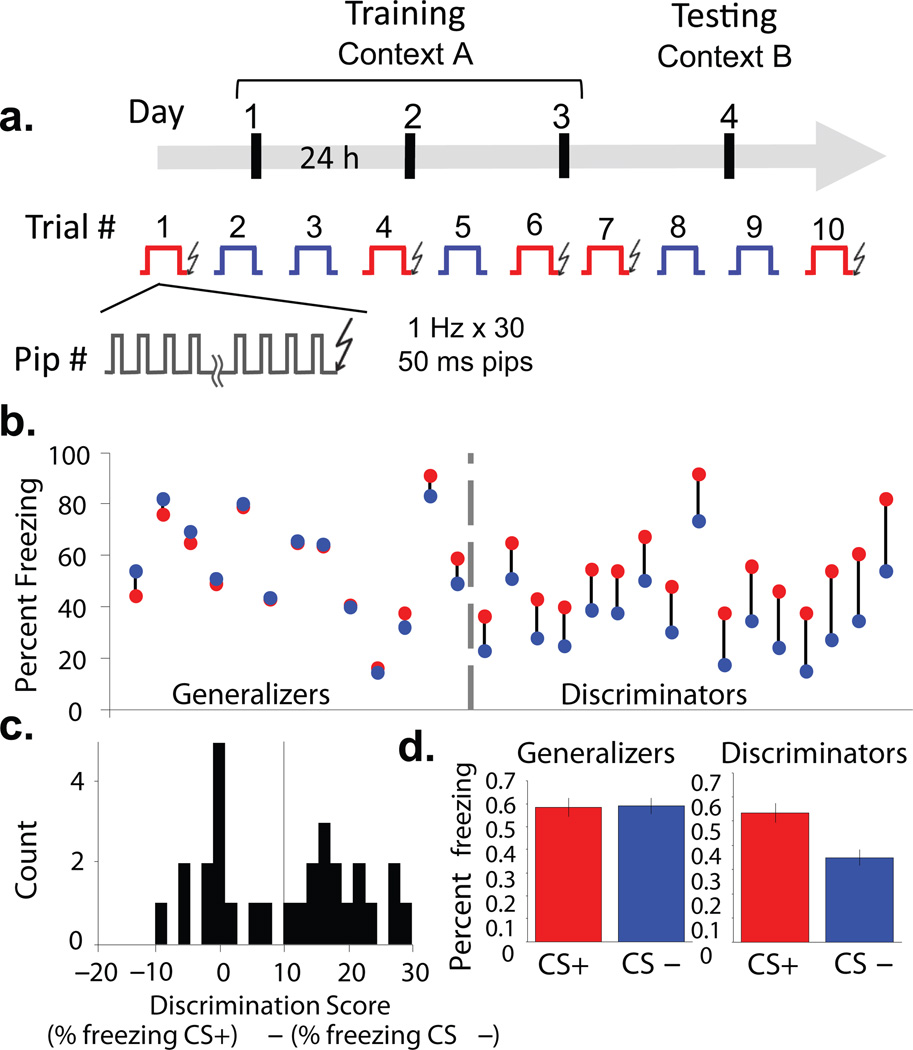
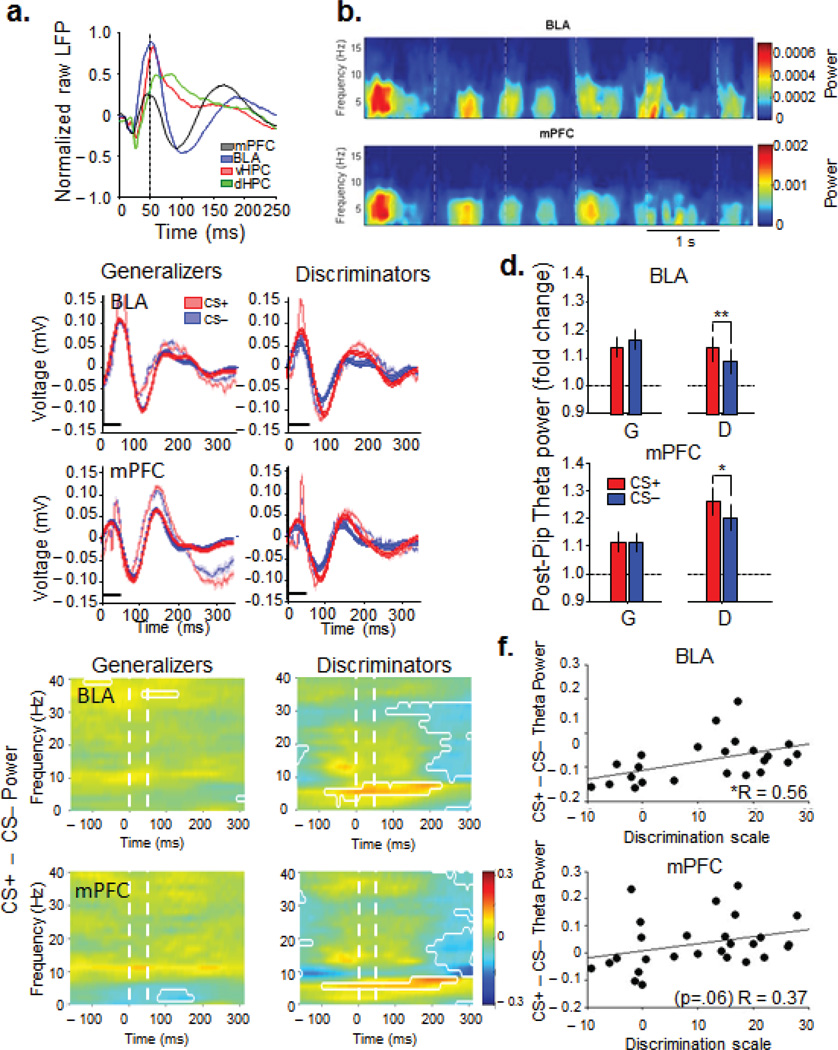
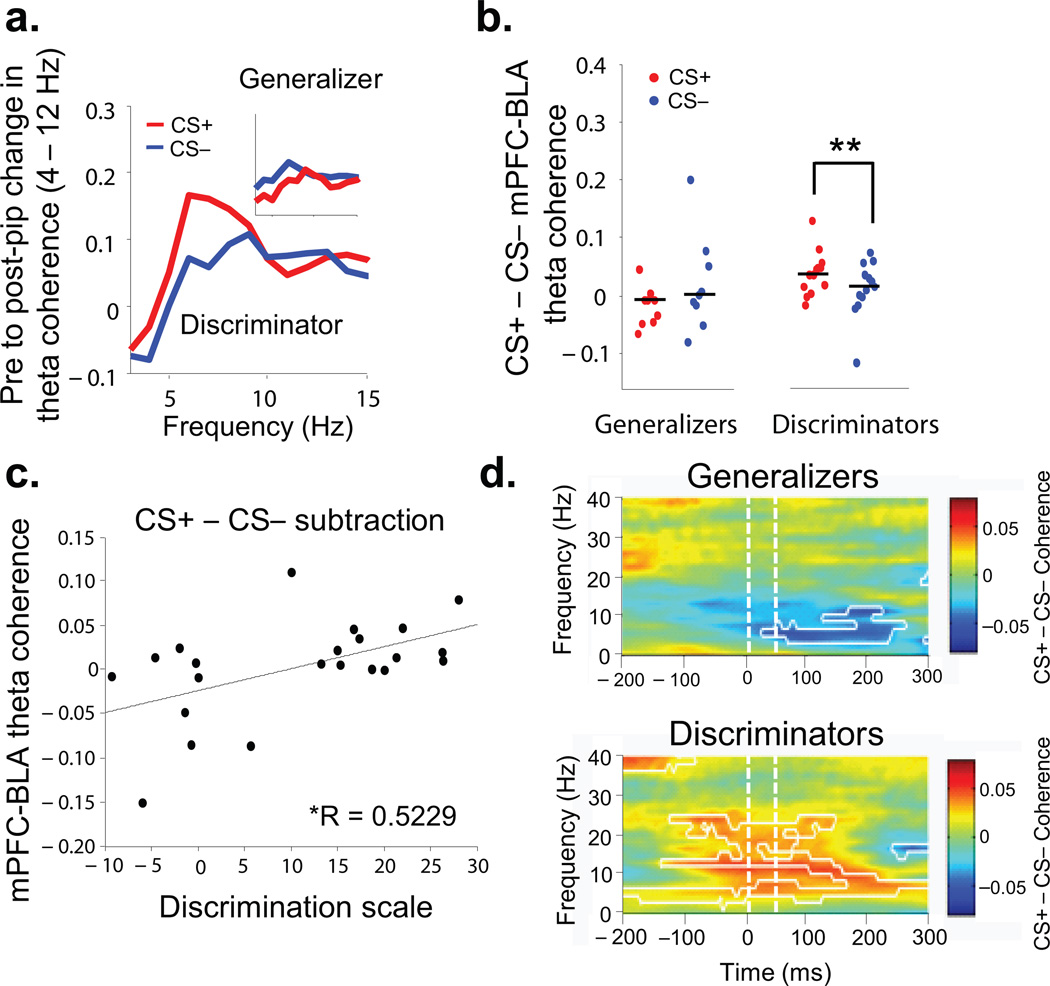
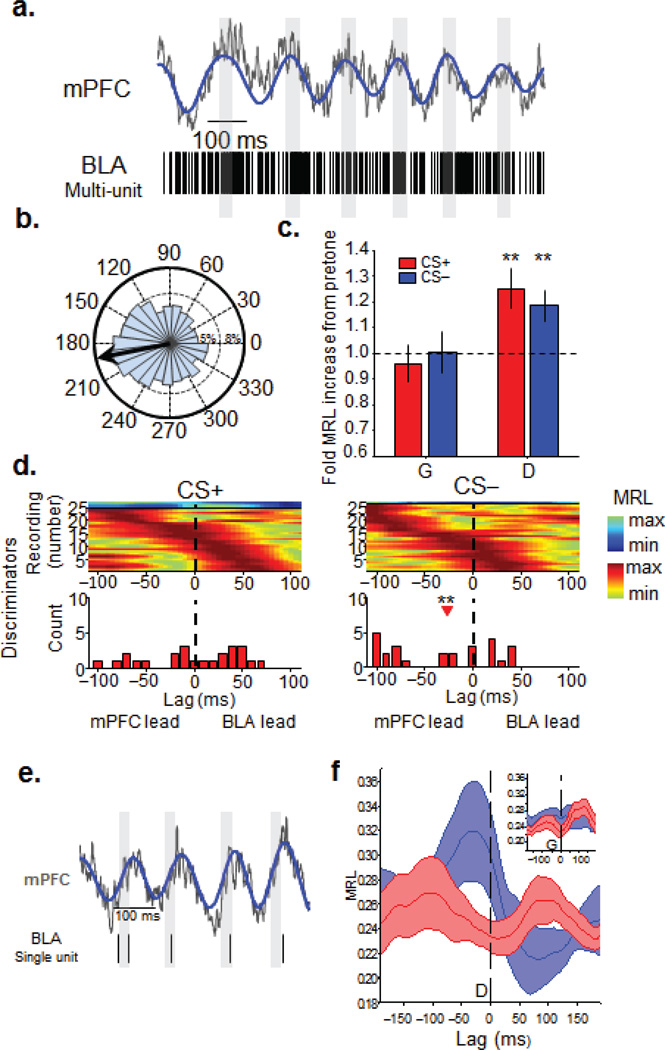
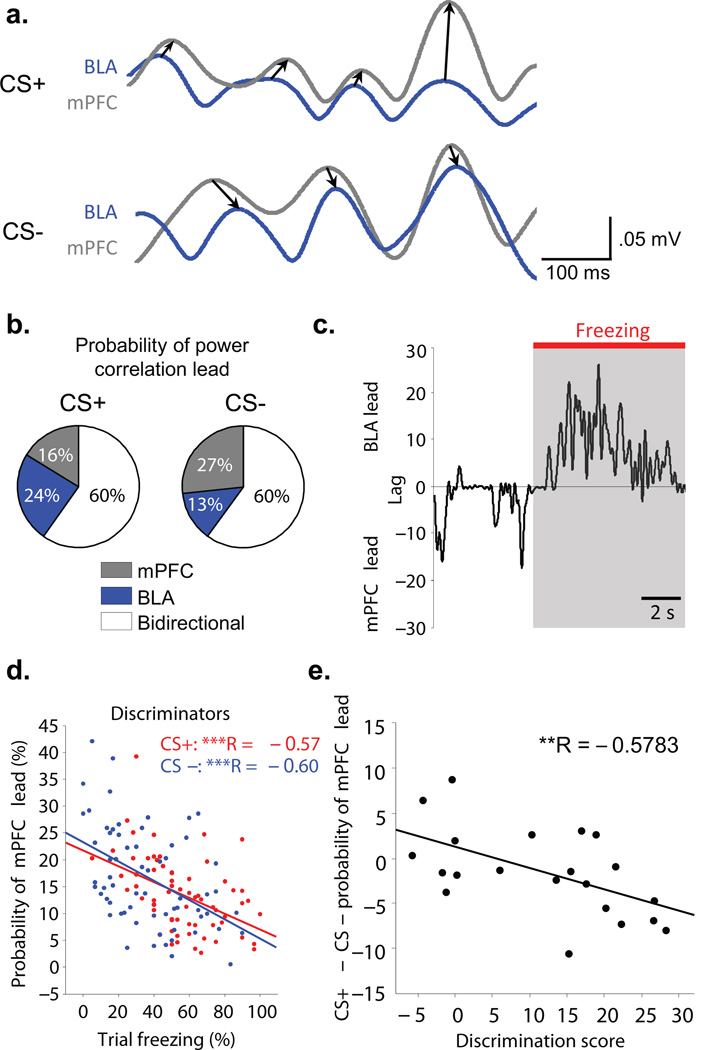
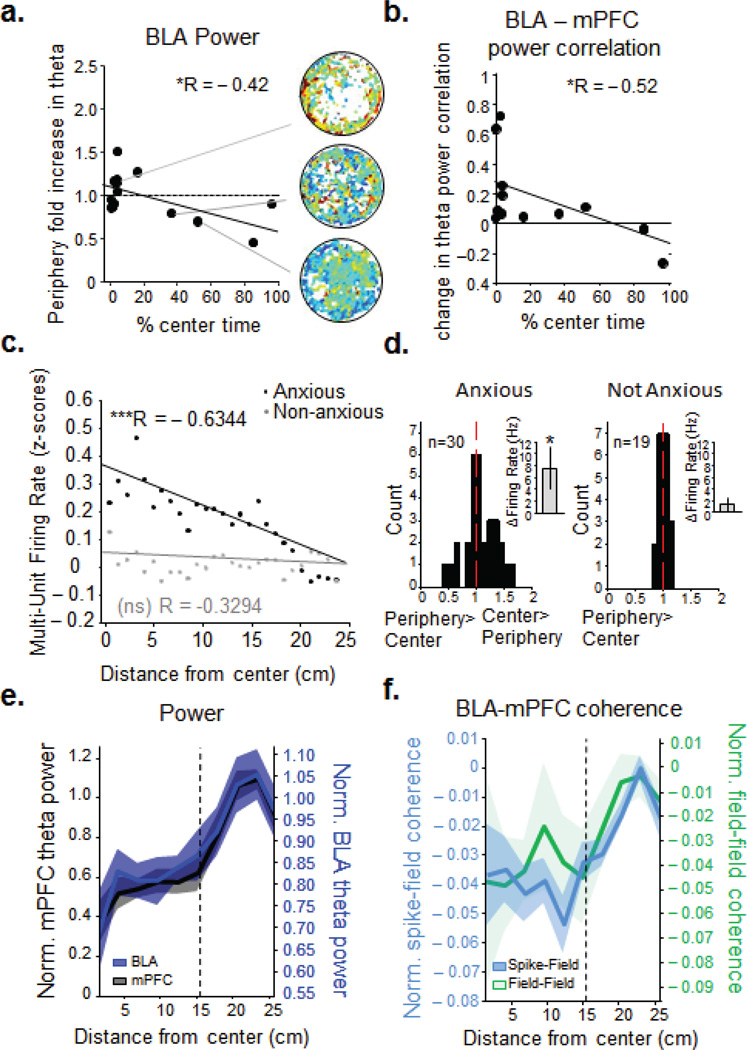
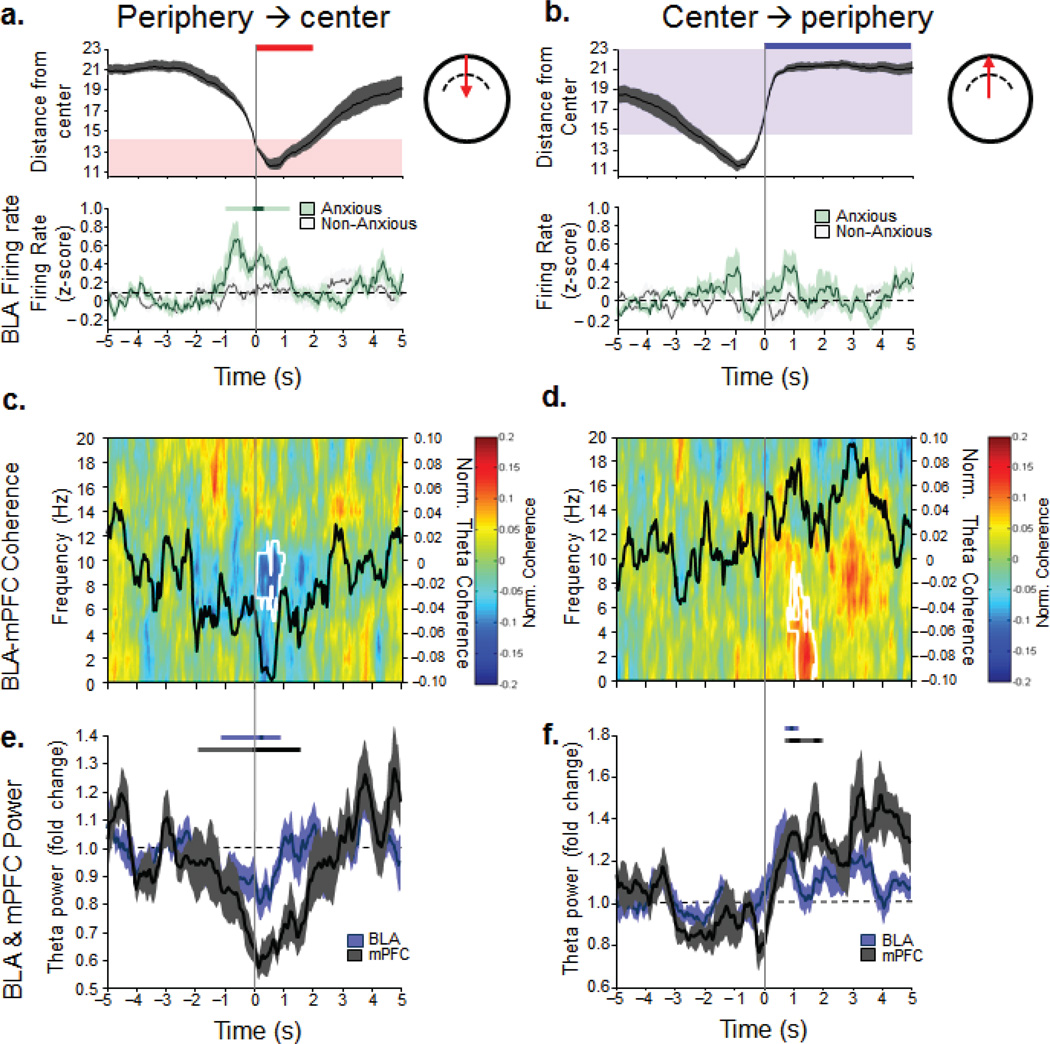
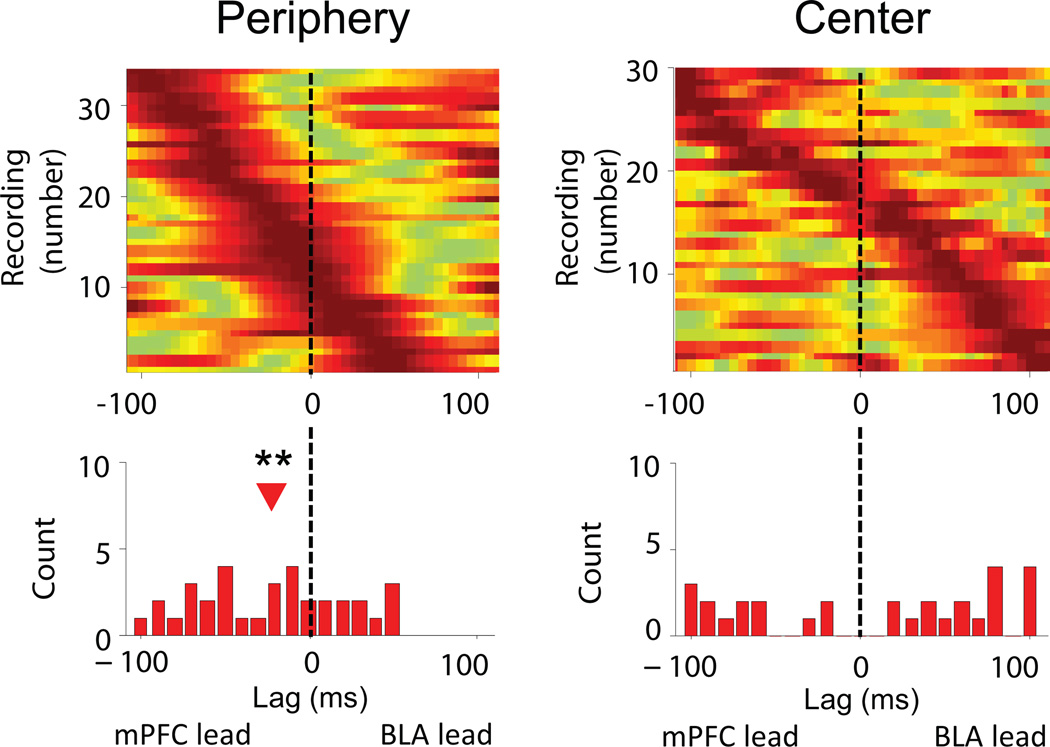
Successfully differentiating safety from danger is an essential skill for survival. While decreased activity in the medial prefrontal cortex (mPFC) is associated with fear generalization in animals and humans, the circuit-level mechanisms used by the mPFC to discern safety are not clear. To answer this question, we recorded activity in the mPFC, basolateral amygdala (BLA) and dorsal and ventral hippocampus in mice during exposure to learned (differential fear conditioning) and innate (open field) anxiety. We found increased synchrony between the mPFC and BLA in the theta frequency range (4-12 Hz) only in animals that differentiated between averseness and safety. Moreover, during recognized safety across learned and innate protocols, BLA firing became entrained to theta input from the mPFC. These data suggest that selective tuning of BLA firing to mPFC input provides a safety-signaling mechanism whereby the mPFC taps into the microcircuitry of the amygdala to diminish fear.


Figures

Figure 1
Figure 1. Individual variation in discrimination after differential fear conditioning
(a) Experimental protocol. Over three successive days, mice were exposed to five presentations each of a CS+ (red) or CS− (blue). Each stimulus consisted of 30 pips, 50 ms in duration, presented at 1 Hz. Each presentation of the CS+ was paired with a 1 s shock. On the fourth day, freezing responses to five additional presentations each of the CS− and CS+ were assessed in the absence of shock. (b) Individual animals’ freezing to CS+ (red circles) and CS− (blue circles). (c) Histogram of discrimination scores in the sample; vertical line, cutoff for discrimination (d) Freezing to CS+ and CS− for Generalizers (left) and Discriminators (right), (mean +/− s.e.m.).
Figure 2
Figure 2. Pip-evoked responses in amygdala and mPFC are modulated by successful discrimination
(a) Example pip-evoked LFP in mPFC, BLA, vHPC and dHPC. Mean of 145 pip presentations from a single animal. Dashed line, pip offset (b) Example spectrogram of BLA and mPFC pip responses. Dashed lines,pip onset. (c) Examples of averaged (faded) and theta-filtered average (solid) traces +/− sem (faded bands) of CS+ and CS− pip-evoked responses from Generalizers and Discriminators. Black line, 50ms pip presentation. (d) Pip-induced change in theta power by CS type and area for Generalizers (G) and Discriminators (D). Mean +/− s.e.m, Generalizers: BLA: n=8,CS+,1.14±.04, CS−, 1.17±.04, signrank, p>0.05; Discriminators: BLA, n=13, CS+, 1.14±.04, CS−, 1.09±.04, signrank, p<0.05; Generalizers: mPFC, n=12, CS+,1.12±.04, CS−, 1.12±.03, signrank, p>0.05, Discriminators: mPFC, n=14, CS+, 1.26±.05, CS−, 1.20±.05, signrank, p<0.05 (e) Subtractive spectrograms of pip-evoked power. The difference between power evoked by the CS+ and the CS− is shown as a function of frequency and time relative to each pip. Warm colors: CS+ > CS−. Cool colors, CS− > CS+. Significant (p < 0.05) power differences are circumscribed by white lines. 50 consecutive significant windows were required for significance. (f) Changes in pip-evoked theta power from the CS− to the CS+ are correlated with Discrimination Score (BLA, R=0.56, p<.05; mPFC, R=0.37, p=.06).
Figure 3
Figure 3. Enhanced BLA-mPFC synchrony after successful fear discrimination
(a) Pip-evoked change in theta-frequency coherence in an example Discriminator by stimulus type. Inset, same in example Generalizer. (b) Medians and distribution of pip-evoked changes in theta-frequency coherence for all Generalizers and Discriminators, by stimulus type. (c) Changes (CS− to CS+) in mPFC-BLA theta coherence are correlated with Discrimination Score (R=0.5229, p<.05) (d) Subtractive coherograms of pip-evoked coherence. Conventions as in Figure 2e.
Figure 4
Figure 4. The CS− is associated with mPFC-to-BLA directionality in discriminators
(a) Example raw (grey) and theta-filtered (blue) mPFC LFP traces, along with simultaneously recorded multiunit activity recorded in the BLA. Grey bars are aligned on zero phase. (b) Distribution and mean (black arrow) of theta phases from this recording. (c) Fold increase in the strength of MUA phase-locking in Generalizers (G) and Discriminators by stimulus type. (Generalizers, CS+ (n=24), 0.96 ± 0.07, signrank, p>0.05; CS− (n=24), 1.00 ± 0.08, signrank, p>0.05, Discriminators, fold increase in MRL from pre-tone to CS+, n=29, 1.25±0.08, signrank, p=<0.01; CS− (n=29), 1.19±0.06, signrank, p=<0.01) Mean +/− s.e.m. **, p < 0.01. (d) Color plots are phase locking strength as a function of lag for all multiunit recordings from Discriminators, aligned by peak lag and grouped by significance of phase-locking (cool colors, n.s.; warm colors, p < 0.05). Histograms below each plot are distributions of lags at which peak phase-locking occurred for significant units only. Red arrowhead indicates median lag that is significantly different from 0. **, p < 0.01 (e) Example raw and theta-filtered mPFC LFP and simultaneously recorded BLA single unit activity. Conventions as in Figure 4a. (f) Mean (solid lines) +/− s.e.m. (faded bands) phase locking strength averaged across all single units recorded from Discriminators, as a function of lag, grouped by stimulus type. Inset, same for all single units recorded from Generalizers. During the CS−, BLA single units of Discriminators (blue line, n=12), were significantly more phase locked to mPFC theta oscillations of the recent past than the near future (200-0ms versus 0–200 ms, signrank, p=.018).
Figure 5
Figure 5. Short time scale fluctuations in mPFC-lead are associated with Discrimination
(a) Examples of BLA and mPFC theta filtered recordings illustrating the power cross-correlation lag analysis in the CS+ (top) and CS− (bottom). Arrows drawn from the leading area to the lagging area (b) Example of a discriminator showing that the proportion of time with an mPFC lead in the power correlation increases in CS− (average across 5 CS+ and 5 CS− trials). (c) Fine scale switches in power lead/lag correlations. Within trial example showing that an increased BLA lead is associated with freezing, whereas increased mPFC lead occurs during movement. (d) Discriminators show a negative correlation between the proportion of time the mPFC leads and percent freezing on a given trial. (CS+, R= −0.57, p<.001; CS−, R= −0.6, p<.001). (e) Correlation between the change (CS+ − CS−) in the probability of an mPFC lead and Discrimination Score (R = −0.5783, p<.01). A larger mPFC lead in the CS− occurs at higher Discrimination scores.
Figure 6
Figure 6. BLA synchronizes with mPFC in the periphery and increases firing in the center of the open field
(a) Fold increase in BLA theta power (compared to familiar environment) and (b) change in theta power correlation between BLA and mPFC as a function of center avoidance in the open field. *, p < 0.05, **, p < 0.01 for linear correlation (black line). (c) BLA firing rate as a function of Distance from the center on the open field for Anxious (black, R= − 0.6344, p<.001) and Non-Anxious animals (grey, R=− 0.3294, p>.05) (d) Fold change in BLA spike rate in center compared to periphery for multiunit recordings from Anxious (left) and Non-Anxious (right) animals. Firing rate increased by 7.55 ± 3.53 Hz (paired ttest, p<0.05) for the Anxious animals (left inset), whereas it did not change for the Non-Anxious animals (right inset, 1.33 ± 1.23 Hz increase, paired ttest, p >0.05) (e) In Anxious animals, normalized mean mPFC (black line) and BLA (blue line) theta power f increase as they travel from the center to the periphery of the open field. (f) Anxious animals' normalized BLA spike- mPFC field (blue line, left axis) and BLA field- mPFC field (green line, right axis) coherence increase with the distance from the center (faded bands, +/− sem).
Figure 7
Figure 7. BLA-mPFC activity predicts center-periphery transitions of Anxious animals
(a, b, top panels), Animals’ position during the transitions from the periphery to the center (left) and center to the periphery (right) as a function of time (transition occurred at zero, 5 seconds of data on both sides of the transition are shown). Red area, center of the open field, blue area, periphery of the open field. (a,b, bottom panels) Mean +/− sem (faded bands) BLA firing rate for Anxious and Non-anxious animals as they transition into (left) and out of (right) the center. Only the Anxious animals show a significant increase in BLA firing as they are going towards the center. +/−2 sec around transition point were compared to 3 sec of baseline (−5 to −2s). Bonferoni-corrected (p<.00042 [p<0.05/120]) significant bins were identified (darker significance line). All time bins adjacent to the point-wise significant bins were tested for global significance (p<0.05, lighter significance lines), see Statistics. (c,d) Anxious animals: BLA-mPFC coherograms as the animals are entering the center (c) or the periphery (d). Black line, average theta coherence during the transitions, white contours, ranksum p<0.05, comparing +/−2 sec around transition point to baseline (e,f) Anxious animals: mean theta power BLA and mPFC +/− sem (faded bands) during transitions into (e) and out of (f) the center. Darker significance lines show point-wise significance (signrank, p<.0039) for at least two consecutive bins, lighter significance lines, globally significant (signrank, p<.05) bins adjacent to the point-wise significant bins (see Statistics).
Figure 8
Figure 8. mPFC-to-BLA directionality in Anxious animals predicts safety in a test of innate anxiety
Strength of phase-locking of BLA MUA to mPFC theta oscillations as a function of lag in the periphery (right) and center (left) of the open field in Anxious animals. Conventions as in Figure 4d.

References

    1. Resnik J, Sobel N, Paz R. Auditory aversive learning increases discrimination thresholds. Nat. Neurosci. 2011;14:791–796. - PubMed
    1. Dunsmoor JE, Mitroff SR, LaBar KS. Generalization of conditioned fear along a dimension of increasing fear intensity. Learn. Memory. 2009;16:460–469. - PMC - PubMed
    1. Jovanovic T, Kazama A, Bachevalier J, Davis M. Impaired safety signal learning may be a biomarker of PTSD. Neuropharmacology. 2012;62:695–704. - PMC - PubMed
    1. Reinecke A, Becker ES, Hoyer J, Rinck M. Generalized implicit fear associations in generalized anxiety disorder. Depress. Anxiety. 2010;27:252–259. - PubMed
    1. Gazendam FJ, Kamphuis JH, Kindt M. Deficient safety learning characterizes high trait anxiety individuals. Biol Psychol. 2013;92:342–352. - PubMed

Publication types