. 2014 Jan;75(1):116-26.
doi: 10.1002/ana.24052. Epub 2014 Jan 2.

Cerebrospinal fluid neurofilament concentration reflects disease severity in frontotemporal degeneration

Affiliations

Cerebrospinal fluid neurofilament concentration reflects disease severity in frontotemporal degeneration

Carole S Scherling et al. Ann Neurol. 2014 Jan.

Abstract

Objective: Cerebrospinal fluid (CSF) neurofilament light chain (NfL) concentration is elevated in neurological disorders, including frontotemporal degeneration (FTD). We investigated the clinical correlates of elevated CSF NfL levels in FTD.

Methods: CSF NfL, amyloid-β1-42 (Aβ42), tau, and phosphorylated tau concentrations were compared in 47 normal controls (NC), 8 asymptomatic gene carriers (NC2) of FTD-causing mutations, and 79 FTD (45 behavioral variant frontotemporal dementia [bvFTD], 18 progressive nonfluent aphasia [PNFA], 16 semantic dementia [SD]), 22 progressive supranuclear palsy, 50 Alzheimer disease, 6 Parkinson disease, and 17 corticobasal syndrome patients. Correlations between CSF analyte levels were performed with neuropsychological measures and the Clinical Dementia Rating scale sum of boxes (CDRsb). Voxel-based morphometry of structural magnetic resonance images determined the relationship between brain volume and CSF NfL.

Results: Mean CSF NfL concentrations were higher in bvFTD, SD, and PNFA than other groups. NfL in NC2 was similar to NC. CSF NfL, but not other CSF measures, correlated with CDRsb and neuropsychological measures in FTD, but not in other diagnostic groups. Analyses in 2 independent FTD cohorts and a group of autopsy-verified or biomarker-enriched cases confirmed the larger group analysis. In FTD, gray and white matter volume negatively correlated with CSF NfL concentration, such that individuals with the highest NfL levels exhibited the most atrophy.

Interpretation: CSF NfL is elevated in symptomatic FTD and correlates with disease severity. This measurement may be a useful surrogate endpoint of disease severity in FTD clinical trials. Longitudinal studies of CSF NfL in FTD are warranted.


Figures

Figure 1
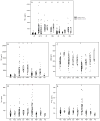
Figure 1. Group comparisons of CSF analyte concentrations
A) Individual values for CSF NfL concentration for the the original cohort (circles, shaded boxes) compared to the validation cohort (squares, open boxes), investigating healthy normal controls (NC) to all patient groups. * and † indicates differences between NC and patient groups for original (p< 0.001) and validation cohorts (p< 0.001), respectively. B)–E) Individual values for CSF concentrations of B) NfL (combined cohort), C) Aβ, D) Tau, E) ptau, comparing NC to all patient groups. Univariate Analysis of Variance or Kruskal-Wallis tests were used to determine group differences (see Methods). * indicates differences between NC and patient groups: B) bvFTD, SD, PNFA and AD, p< 0.001; C) AD, p< 0.001; D) bvFTD, SD, PNFA and AD, p< 0.036; E) AD, p< 0.001. For the boxplots, the middle line indicates median; bottom and top of box indicate the 25th and 75th percentile, respectively. Abbreviations: NC= normal controls, NC2= clinically normal carriers of known FTD-causing mutations, bvFTD= behavioral variant FTD, SD = semantic dementia, PNFA = progressive non-fluent aphasia, AD= Alzheimer’s disease, PSP= progressive supranuclear palsy, CBS= Corticobasal syndrome, PD= Parkinson’s disease.
Figure 2
Figure 2. CSF Neurofilament concentrations and disease severity in FTD, AD and PSP
Correlations between NfL and disease severity as measured by CDRsb in all FTD subtypes: A) original cohort, B) validation cohort, and C) combined cohort. Symbols: ● = bvFTD, ■ = SD and ▲ = PNFA. ii) Correlations between NfL and CDRsb in disease subtypes: D) bvFTD; E) SD; F) PNFA; G) AD; H) PSP. Colored and filled symbols indicate cases with additional autopsy, genetic or PiB data used in confirmatory analysis, from biomarker enriched cohort. Abbreviations: CDRsb: Clinical dementia rating sum of boxes, NC= normal controls, bvFTD= behavioral variant FTD, SD = semantic dementia, PNFA = progressive non-fluent aphasia, all FTD subtypes: bvFTD+SD+PNFA, AD= Alzheimer’s disease, PSP= progressive supranuclear palsy, CBS= Corticobasal syndrome, PD= Parkinson’s disease
Figure 3
Figure 3. Regional brain volume correlates with CSF NfL concentration in FTD
A), B): Negative correlations between CSF NfL and gray (blue) and white (red) matter volume in lateralized frontal, temporal and parietal regions, with overlapping clusters in pink. Overlap occurs due to 12 mm smoothing kernel used for VBM analysis (see Methods). Shown in: A) All FTD patients (n=66), and B) only bvFTD patients (n=39). Spearman analyses, 2-tailed, puncorrected< 0.005 for display purposes. FDR-corrected statistics for each region given in Supplemental Table 3. C), D), E): Scatterplots of CSF NfL concentrations versus individual subjects’ signal intensity at peak voxels in selected gray matter clusters. Regions selected are peak voxels from the Spearman correlational analysis, correlated (p < 0.05, False Discovery Rate corrected) in the all FTD image. Montreal Neurological Coordinates: C) left inferior frontal gyrus [−36, 13, 15], D) left middle temporal gyrus [−53, −53, 4], E) left precuneus [−8, −64, 23]. Please refer to Figure 2 for symbol and color legends.

References

    1. Neary D, Snowden JS, Gustafson L, et al. Frontotemporal lobar degeneration - A consensus on clinical diagnostic criteria. Neurology. 1998;51:1546–1554. - PubMed
    1. Gorno-Tempini ML, Hillis AE, Weintraub S, et al. Classification of primary progressive aphasia and its variants. Neurology. 2011;76:1006–1014. - PMC - PubMed
    1. Blennow K, Zetterberg H, Rinne JO, et al. Effect of immunotherapy with bapineuzumab on cerebrospinal fluid biomarker levels in patients with mild to moderate Alzheimer disease. Archives of Neurology. 2012;69:1002–1010. - PubMed
    1. Petersen RC. Alzheimer’s disease: progress in prediction. Lancet Neurology. 2010;9:4–5. - PMC - PubMed
    1. Green AJE, Harvey RJ, Thompson EJ, Rossor MN. Increased tau in the cerebrospinal fluid of patients with frontotemporal dementia Alzheimer’s disease. Neuroscience Letters. 1999;259:133–135. - PubMed

Publication types