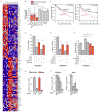
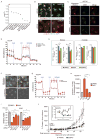
. 2013 Oct 24;155(3):552-66.
doi: 10.1016/j.cell.2013.09.041. Epub 2013 Oct 24.

Systematic identification of molecular subtype-selective vulnerabilities in non-small-cell lung cancer

Affiliations

Systematic identification of molecular subtype-selective vulnerabilities in non-small-cell lung cancer

Hyun Seok Kim et al. Cell. .

Abstract

Context-specific molecular vulnerabilities that arise during tumor evolution represent an attractive intervention target class. However, the frequency and diversity of somatic lesions detected among lung tumors can confound efforts to identify these targets. To confront this challenge, we have applied parallel screening of chemical and genetic perturbations within a panel of molecularly annotated NSCLC lines to identify intervention opportunities tightly linked to molecular response indicators predictive of target sensitivity. Anchoring this analysis on a matched tumor/normal cell model from a lung adenocarcinoma patient identified three distinct target/response-indicator pairings that are represented with significant frequencies (6%-16%) in the patient population. These include NLRP3 mutation/inflammasome activation-dependent FLIP addiction, co-occurring KRAS and LKB1 mutation-driven COPI addiction, and selective sensitivity to a synthetic indolotriazine that is specified by a seven-gene expression signature. Target efficacies were validated in vivo, and mechanism-of-action studies informed generalizable principles underpinning cancer cell biology.


Figures

Figure 1
Figure 1. Public and private genetic vulnerabilities
A. Schematic of discovery platform for target/biomarker relationships. B. Genome-wide view of relative genomic DNA content, mRNA content, and RNAi toxicity in HCC4017 by two independent siRNA libraries (orange indicates Z < −3). C. Penetrance of the HCC4017 RNAi hits in 22 NSCLC lines. D. Gene ontology (%) of the private (N = 30; response in 1–2 lines) and public (N=48; response in > 2 lines) RNAi hits. Subgraphs from the PPI network (see Figure S1H) are displayed in the boxes. See also Figure S1, Table S1, S2, and S3, and Data S1, S2, S4, S5, and S6.
Figure 2
Figure 2. Context-selective FLIP-addiction
A. Barplots indicate toxicity of CFLAR depletion in the most sensitive (relative viability < 0.3) and most resistant NSCLC cell lines (> 0.9), and two nontumorigenic lines. Heatmap indicates the gene expression signature with the maximal bimodal distribution between groups. SMAC responsiveness is indicated as determined by LD50 (supplemental table 5). Error bars indicate +/− standard deviation from the mean (SDM, N = 3). B. The indicated siRNAs were tested for consequences on siCFLAR dependent toxicity within each of the CFLAR-dependent cell lines. Error bars as in A. C. The indicated siRNAs were tested for consequences on SMAC mimetic induced toxicity within each of the SMAC mimetic-responsive cell lines. Error bars as in A. D. Pfam-A domain structure of NALP3 and maps of somatic mutations found. E. Empirical CDF plot of PYCARD expression from lung adenocarcinomas with or without highly deleterious mutations in NLRP3 (TCGA). F. Consequence of NLRP3 depletion on CFLAR dependency ** P < 0.01, * P < 0.05 by two-sided unpaired Student’s t-test. siRNA-mediated NLRP3 gene depletion is indicated as measured by qPCR (right). Error bars as in A. G. Tumor weights (g) following treatment with either control or CFLAR siRNAs. Error bars indicate +/− standard error from the mean (SEM). *P = 0.026 by Wilcoxon rank sum test. See also Figure S2 and Table S4.
Figure 3
Figure 3. KRASmut/LKB1mut mutation status specifies Coatomer 1 addiction
A. RNAi toxicity profiles of the most sensitive and most resistant NSCLC lines to siRNA pools targeting COPI are shown. Mutation status of the KRAS and LKB1 is indicated, M (mutant) or wt (wild type). B. The indicated cell lines were transfected with the indicated siRNAs in 96-well plates, and incubated for 48 hours followed by transfer to 24-well plates and incubation for an additional 6 days. Crystal violet stained wells are shown. The immunoblot indicates persistence of target depletion in HBEC3 at the 8-day timepoint. C. The consequence of COPI depletion on HCC4017 colony formation in soft-agar is shown. Error bars indicate +/− SDM, N = 3. D. Therapeutic effects of ARCN1 siRNA in an orthotopic lung adenocarcinoma model (A549). Error bars indicate +/− SEM. One-sided Wilcoxon rank sum test p-values were all < 0.01 (**). E. Consequence of AICAR on AMPK activation in two COPI dependent (HCC4017 and H460) and two independent (H2009 and H441) KRAS mutant lines. F. Additional NSCLC lines from outside the test panel, with known KRASmut/LKB1mut status, were assayed for BrdU incorporation to detect consequences of COPI depletion on proliferation as shown. Error bars as in C. G. Consequence of LKB1/COPI codepletion in KRAS mutant cells. Immunoblots indicate target depletion. Error bars as in C. See also Figure S3.
Figure 4
Figure 4. Oncogenic KRAS together with LKB1 loss is sufficient to induce COPI-addiction
A. Steady-state accumulation of the indicated proteins and phospho-proteins was assessed by immunoblot of whole-cell lysates from the indicated HBEC30KT derivatives. B. Representative H&E images, of xenograft tumors formed upon subcutaneous inoculation of HBEC30KT-shTP53/KRASG12V/shLKB1, indicating mixed adenosquamous (top) and squamous (bottom) histology. C. Toxicity profile of the HCC4017 siRNA hits within the HBEC30KT progression series. The 17/85 siRNAs selectively toxic to the KRASmut/LKB1mut cell lines are shown. D. Viability distributions of siRNA pools from 4C across 18 NSCLC lines with the indicated genotypes. Boxplots whiskers extend to +/− 1.5 IQR. Two-sided KS test p-values for all pair comparisons against the double mutants are less than E-10 (**). E. The indicated cells were stained with crystal violet as in Figure 3B. Immunoblot indicates persistence of target depletion in resistant cells at the 8-day timepoint. See also Figure S4.
Figure 5
Figure 5. The KRASmut/LKB1mut NSCLC subtype mirrors the mesenchymal (Claudin-low) subtype of triple negative breast cancer
A. Top 100 differentially regulated genes as identified by signal to noise ratio between COPI dependent and independent cancer lines. Claudin-low signature genes are indicated in red for upregulated (10/437) and green (19/370) for downregulated genes, hypergeometric p < 6.7 X 10E-16. B. Selective consequence of ARCN1 depletion on the viability of breast cancer cell lines. Error bars indicate +/− SDM, N = 3. C. Patient cohorts with the COPI-addicted gene expression signature (Cluster I) show poor prognosis. Kaplan-Meier plots are shown for overall (left) and cancer free survival (right) of the patient populations dichotomized as described in Figure S5C. p-values are log-rank test. D.E.F. Consequence of codepletion of IL6 (D), IL6R (E), or exposure to Let-7 family of miRNA mimics (F) on siRNA toxicity of indicated COPI subunits. Error bars as in B. G.H. IL-6 secretion was measured by ELISA post-transfection of the indicated siRNAs in the indicated cell lines. Values were normalized to cell number. ** P < 0.01, * P < 0.05, two-sided unpaired Student’s t-test, error bars as in B. See also Figure S5 and Table S5.
Figure 6
Figure 6. Lysosomal maturation is required to support mitochondrial oxidative phosphorylation and survival of KRASmut/LKB1mut NSCLC cells in vitro and in vivo
A. Compound mimic screen. The indicated compounds were tested over 11 doses (2X serial dilution) for toxicity in HCC4017 and KRASmut/LKB1mut lines (N=6) versus HBEC30KT and others (N=14). AUC was estimated by the sum of % viability over testing doses. One-sided two-sample K-S tests were performed to discriminate compounds with selective activity. K-S test p-values in negative log scale were used to generate the plot. B. HCC44 cells, transfected with the indicated siRNAs, were stained with the indicated dyes and antibodies. 71% of siARCN1 cells were Lysotracker negative versus 3.0% of siNC cells, p-value < 2.2E-16, Fisher’s exact test. C. Confocal imaging of mitochondrial morphology after 42 hour exposure to vATPase inhibitors. 92% bafA-treated and 85% saliPhe-treated cells had dysmorphic mitochondria versus 2.7% with DMSO, p-value < 2.2E-16 for both, Fisher’s exact test. D. Oxygen consumption rates (OCR) of HCC44 cells exposed to the indicated compounds. Error bars indicate +/− SDM, N = 3. E. Mass isotopomer analysis of citrate in HCC44 cells cultured with D[U-13C]glucose and unlabeled glutamine (left for each cell line) or L[U-13C]glutamine and unlabeled glucose (right for each cell line) after exposure to 10 nM BafA or 1 μM SaliPhe for 16 hours. **P < 0.01, * P< 0.05, two-sided t-test, error bars as in B. F. Live cell images obtained as in 6B and 6C. G. As in 6D except that HCC44 cells were transfected with the indicated siRNAs prior to the assay. 93% of siATP6V1B2 cells had dysmorphic mitochondria versus 0% of siNC cells, p-value < 2.2E-16, Fisher’s exact test, error bars as in B. H. Caspase-3 and 7 activity was measured after exposure of HCC4017 to DMSO or bafA (5 nM) for 48 hours together with methyl pyruvate (8 mM), dimethyl-2-oxoglutarate (MOG, 5 mM), or water (CTL). Error bars as in B. I. Indicated siRNAs were tested for consequences on bafA (10 nM) dependent toxicity in HCC44 and A549. Cells were exposed to bafA 48 hours post transfection. Error bars as in B. J. 2.5 × 10⁶ HCC4017 cells were injected subcutaneously into NOD/SCID mice. Tumor volume vs. days post tumor injection is displayed for mice treated with saliPhe, or saline as indicated. Error bars indicate +/− SEM. See also Figure S6 and Table S5.
Figure 7
Figure 7. A gene expression model predicts sensitivity to an indolotriazine
A. AC50 for the HCC4017-selective synthetic indolotriazine derivative against 74 additional NSCLC cell lines and immortalized HBECs. B. Top 10 differential gene expression responses to SW044248 (2 μM, 6 hours) in HCC4017 parental (P) and resistant clones (RS, RW) as detected by RNA-seq (ANOVA P < 0.005, Data S7). C. Relative accumulation of CHOP, IRE1α, and BiP proteins upon exposure of HCC4017 for the indicated times. D. As in 7C except using a 24 hr exposure with indicated cell lines. E. Predictive basal gene expression features for SW044248 sensitivity in 48 NSCLCs by elastic net regression modeling. Compound response (AC50) is indicated in the top row. Predictive gene expression features (normalized by sample median) across 48 NSCLCs are shown. Bar plot on the left indicates the average weight for the corresponding feature as determined from a 200X bootstrapping analysis. Frequency of feature occurrence is shown in parenthesis. F. Dose response curves for a predicted sensitive cell line, HCC2429, and a predicted resistant cell line H1770, based on the expression signature-derived scoring function. Error bars indicate +/− SDM, n = 3. See also Figure S7 and Data S3–1, S3–2, S3–3, and S7.

References

    1. Abu-Elheiga L, Matzuk MM, Abo-Hashema KA, Wakil SJ. Continuous fatty acid oxidation and reduced fat storage in mice lacking acetyl-CoA carboxylase 2. Science. 2001;291:2613–2616. - PubMed
    1. Barretina J, Caponigro G, Stransky N, Venkatesan K, Margolin AA, Kim S, Wilson CJ, Lehar J, Kryukov GV, Sonkin D, et al. The Cancer Cell Line Encyclopedia enables predictive modelling of anticancer drug sensitivity. Nature. 2012;483:603–607. - PMC - PubMed
    1. Bryant C, Fitzgerald KA. Molecular mechanisms involved in inflammasome activation. Trends Cell Biol. 2009;19:455–464. - PubMed
    1. Cancer Genome Atlas Research N. Comprehensive genomic characterization of squamous cell lung cancers. Nature. 2012;489:519–525. - PMC - PubMed
    1. Cerami E, Gao J, Dogrusoz U, Gross BE, Sumer SO, Aksoy BA, Jacobsen A, Byrne CJ, Heuer ML, Larsson E, et al. The cBio cancer genomics portal: an open platform for exploring multidimensional cancer genomics data. Cancer Discov. 2012;2:401–404. - PMC - PubMed

Publication types

MeSH terms