Comparative Study
. 2014 Feb;15(1):47-64.
doi: 10.1007/s10522-013-9477-9. Epub 2013 Nov 16.

A comparison of replicative senescence and doxorubicin-induced premature senescence of vascular smooth muscle cells isolated from human aorta

Affiliations
Comparative Study

A comparison of replicative senescence and doxorubicin-induced premature senescence of vascular smooth muscle cells isolated from human aorta

Anna Bielak-Zmijewska et al. Biogerontology. 2014 Feb.

Abstract

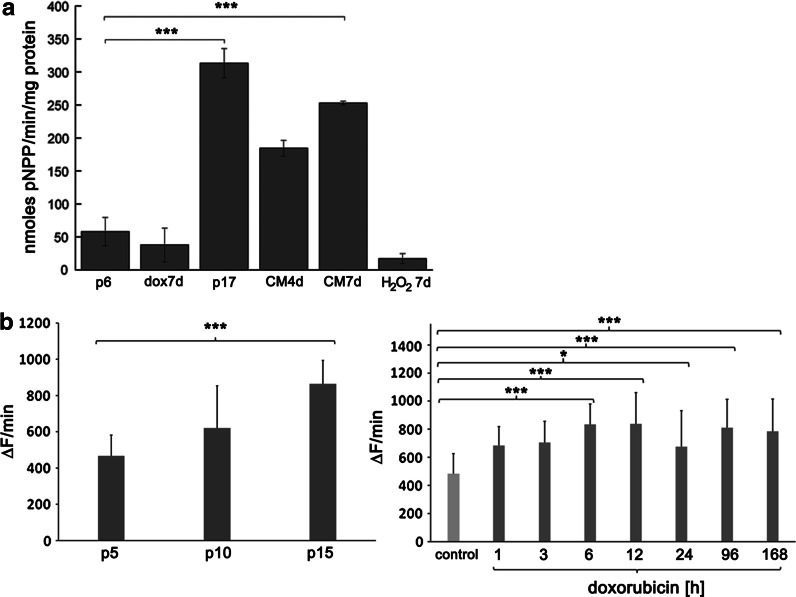
Senescence of vascular smooth muscle cells (VSMCs) contributes to aging as well as age-related diseases of the cardiovascular system. Senescent VSMCs have been shown to be present in atherosclerotic plaques. Both replicative (RS) and stress-induced premature senescence (SIPS) accompany cardiovascular diseases. We aimed to establish the signature of RS and SIPS of VSMCs, induced by a common anticancer drug, doxorubicin, and to discover the so far undisclosed features of senescent cells that are potentially harmful to the organism. Most of the senescence hallmarks were common for both RS and SIPS; however, some differences were observed. 32 % of doxorubicin-treated cells were arrested in the G2/M phase of the cell cycle, while 73 % of replicatively senescing cells were arrested in the G1 phase. Moreover, on the basis of alkaline phosphatase activity measurements, we show that a 7-day treatment with doxorubicin (dox), does not cause precocious cell calcification, which is a characteristic feature of RS. We did not observe calcification even though after 7 days of dox-treatment many other markers characteristic for senescent cells were present. It can suggest that dox-induced SIPS does not accelerate the mineralization of vessels. We consider that detailed characterization of the two types of cellular senescence can be useful in in vitro studies of potential anti-aging factors.


Figures

Fig. 1
Fig. 1
Cell morphology and SA-β-gal activity during young and senescent cells. a Morphology of cells in the culture (RS and dox-induced SIPS) and after detachment (RS). Representative pictures (left) of RS p5, p10, p15 cells growing at the culture dish and p4 and p21 detached cells. Cells treated with doxorubicin (right) after 24, 96 h (4 days) and 168 h (7 days) and, alongside, the corresponding pictures of control cells. Similar changes were observed during RS and dox-induced SIPS. The senescent cells were bigger and flatter than the young ones and after detachment their shape was irregular in contrast to round and small young cells. b, c SA-β-gal activity during RS (left) and dox-induced SIPS (right) expressed as a percentage of SA-β-gal-positive cells (b) and representative pictures of RS p4 and p15, and dox-induced SIPS (control cells and cells treated with doxorubicin during 3 days—dox 3 days) (c). The increased activity of SA-β-gal accompanied both RS and dox-induced SIPS. (t test)
Fig. 2
Fig. 2
Changes of granularity of cells undergoing senescence. Granularity of cells during RS (left) and dox-induced SIPS (right) a expressed as a percentage of cells with increased granularity (U test and t test, respectively) and b representative dot blots obtained using flow cytometry, showing changes in cellular granularity during RS (upper), passages number 7, 10, 15, 18 and dox-induced SIPS (lower), with control cells (p8), and cells after 24 and 48 h of doxorubicin treatment, respectively. The region for analysis of cells with increased granularity was determined for passage 5 in the case of RS and for control cells in the case of doxorubicin treatment and was the same during all analyses. Cells present in the selected region reveal increased granularity in comparison to control. During RS and dox-induced SIPS an increased number of cells with enhanced granularity was observed
Fig. 3
Fig. 3
Estimation of proliferation rate and cell cycle during RS and dox-induced SIPS. a Proliferation rate during RS (left) and dox-induced SIPS (right), assessed as the percentage of BrdU positive cells (RS) (U test) or the number of cells in culture after doxorubicin treatment (dox-induced SIPS) (t test). During both RS and dox-induced SIPS cells stopped to proliferate. For the senescence induction different concentrations of doxorubicin were used. The 100 nM concentration was chosen as it did not induce massive cell death but effectively inhibited cell proliferation. b and c Cell cycle analysis during RS (left and upper panel) and dox-induced SIPS (right and bottom panel). Graphs showing % of cells in a particular phase of the cell cycle (b) and representative histograms showing preferential accumulation of cells in the G1 (RS) or the G2/M (dox-induced SIPS) phase of the cell cycle (c)
Fig. 4
Fig. 4
DNA damage during RS and dox-induced SIPS. a DNA damage expressed as the percentage of cells with DNA damage foci visualized by 53BP1 immunocytochemistry in RS (left), where the percentage of cells with 0, 1, 2–5 and more than 5 foci is shown, and representative pictures for dox-induced SIPS (right). During RS both the number of cells with damaged DNA and the number of DNA damage foci in particular cells increased; after 24 h of doxorubicin treatment in almost all cells more than 5 foci were found. b Micronuclei generation during RS (left) and dox-induced SIPS (right). During both RS and dox-induced SIPS a statistically significant time-dependent increase in micronuclei formation was observed. Cells treated with mitomycin C, which increased micronuclei generation, served as a PC. (ANOVA and Tukey’s a posteriori test). c Western blot analysis of DDR pathway and p16 level during RS (left) and dox-induced SIPS (right). An activation of the DDR pathway was observed during RS and dox-induced SIPS. An increased level of p53 and its phosphorylated form as well as p21 was observed. DDR activation during dox-induced SIPS was only transient. The level of p16 increased with the passage number and during dox-induced SIPS. Two concentrations of doxorubicin were analyzed, one used for dox-induced SIPS induction and a second one, 1 μM (added for 24 h), that led to cell death. In cells which mostly underwent senescence the level of both total and phosphorylated p53 was lower and the p21 expression increased already after 1 day but in cells treated with 1 μM doxorubicin such increase was observed later, only after 2 days. A very high level of γH2AX evidenced also the higher mortality of cells treated with 1 μM doxorubicin
Fig. 5
Fig. 5
Secretory phenotype (SASP) during RS (left) and dox-induced SIPS (right). IL-6 (a), IL-8 (b) and VEGF (c) were analyzed. In both types of senescence an increased level of IL-6 and 8 and VEGF was observed and the production of all analyzed cytokines was higher during dox-induced SIPS than RS (U test)
Fig. 6
Fig. 6
Analysis of ALP activity and superoxide production during RS and dox-induced SIPS. a ALP activity during RS and dox-induced SIPS is shown. ALP activity (expressed in nmoles of p-NPP released per minute (U) per milligram of protein). The results were normalized to the total protein concentration. dox7d—7 days treatment with doxorubicin, CM4d CM7d—4 or 7 days incubation in calcification medium, 100 μM H2O2 treatment for 7 days. The increased activity of ALP was observed only during RS. During SIPS induced by doxorubicin or H2O2 no increased activity of this enzyme was observed (Anova). b Superoxide production during RS (left) and dox-induced SIPS (right). ΔF/min—designates the increase in fluorescence per minute. Representative pictures are shown in Data Supplement. Intracellular superoxide production increased during both RS and dox-induced SIPS
Fig. 7
Fig. 7
DNA methylation, DNMT1 level and DNMTs activity during RS and dox-induced SIPS. a DNA methylation. b DNMT1 level. c activity of DNMTs during RS (left) and dox-induced SIPS (right). DNA methylation of cells at p10 was higher than at p5, whilst DNA methylation of cells at p15 was lower than at p5. No statistically significant changes in DNA methylation in cells treated with doxorubicin was detected. Cells treated with a DNA methylation inhibitor 5-aza-2′-deoxycytidine (5-aza-dC) served as a negative control. We observed passage-dependent decrease in DNMT1 level and DNMT activity but during dox-induced SIPS some fluctuation in DNMT1 level and DNMT activity was observed (ANOVA and Tukey’s a posteriori test)
Fig. 8
Fig. 8
Telomere length during RS and dox-induced SIPS. a TRF length (kb) expressed as a mean telomere area per cell. b Means of telomere area (pixel per spot) for RS (left) and dox-induced SIPS (right) measured by Q-FISH with Human Chromosome Pan-Telomeric Probes, (ANOVA and Tukey’s a posteriori test). c Representative pictures from Southern blot analysis. Mean TRF length (kb) is shown in brackets (in the legend of the particular lanes). RS (left); Lanes 1 DIG-Molecular Weight Marker, [0.8–21.2], 2 control DNA [7.6 ± 0.2], 3 p5 [9.97 ± 0.06], 4 p10 [7.55 ± 0.60], 5 p15 [6.33 ± 0.19]. dox-induced SIPS (right); Lanes 1 p6 1 day, 2 doxorubicin 1 day, 3 p6 4 day, 4 doxorubicin 4 day, 5 p6 7 day, 6 doxorubicin 7 day, 7 control DNA [7.6 ± 0.2], 8 DIG-Molecular Weight Marker [0.8–21.2]. d Representative pictures of Q-FISH for passage-dependent and premature senescence induced by doxorubicin. A passage-dependent telomere length shortening was observed but no changes in the mean telomere length during dox-induced SIPS were recorded

References

    1. Baker DJ, Wijshake T, Tchkonia T, LeBrasseur NK, Childs BG, van de Sluis B, Kirkland JL, van Deursen JM. Clearance of p16Ink4a-positive senescent cells delays ageing-associated disorders. Nature. 2011;479(7372):232–236. doi: 10.1038/nature10600. - DOI - PMC - PubMed
    1. Bellizzi D, D’Aquila P, Montesanto A, Corsonello A, Mari V, Mazzei B, Lattanzio F, Passarino G. Global DNA methylation in old subjects is correlated with frailty. Age (Dordr). 2012;34:169–179. doi: 10.1007/s11357-011-9216-6. - DOI - PMC - PubMed
    1. Bennett MR, Macdonald K, Chan SW, Boyle JJ, Weissberg PL. Cooperative interactions between RB and p53 regulate cell proliferation, cell senescence, and apoptosis in human vascular smooth muscle cells from atherosclerotic plaques. Circ Res. 1998;82:704–712. doi: 10.1161/01.RES.82.6.704. - DOI - PubMed
    1. Calvanese V, Lara E, Kahn A, Fraga MF. The role of epigenetics in aging and age-related diseases. Ageing Res Rev. 2009;8:268–276. doi: 10.1016/j.arr.2009.03.004. - DOI - PubMed
    1. Campisi J, Kim SH, Lim CS, Rubio M. Cellular senescence, cancer and aging: the telomere connection. Exp Gerontol. 2001;36:1619–1637. doi: 10.1016/S0531-5565(01)00160-7. - DOI - PubMed

Publication types

MeSH terms

LinkOut - more resources