. 1992 Mar;2(1):47-62.
doi: 10.1007/BF00866388.

Calcium imaging using fluorescence lifetimes and long-wavelength probes

Affiliations

Calcium imaging using fluorescence lifetimes and long-wavelength probes

J R Lakowicz et al. J Fluoresc. 1992 Mar.

Abstract

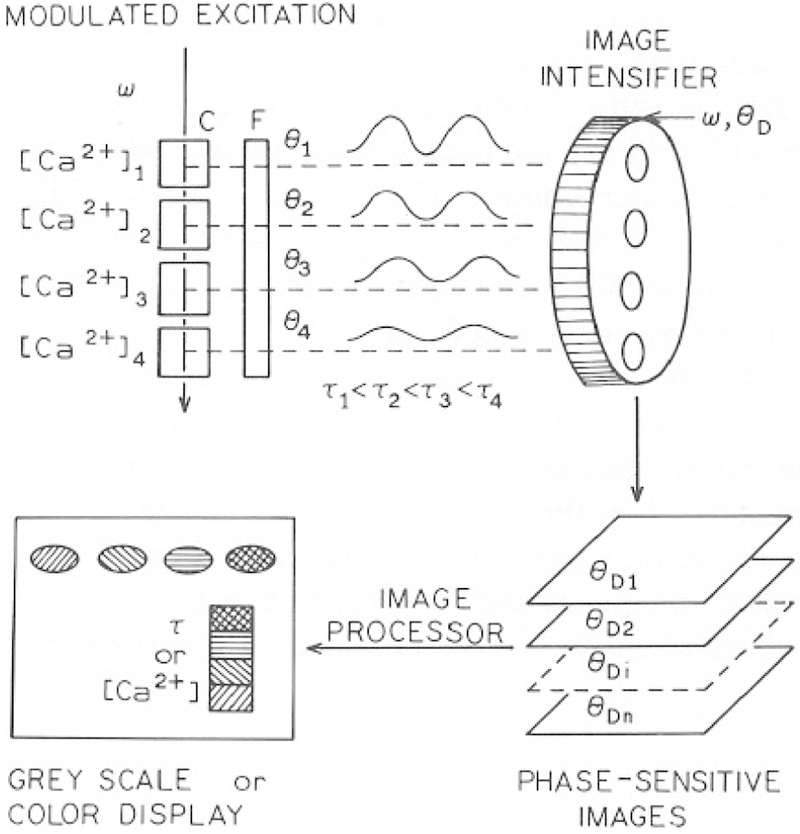
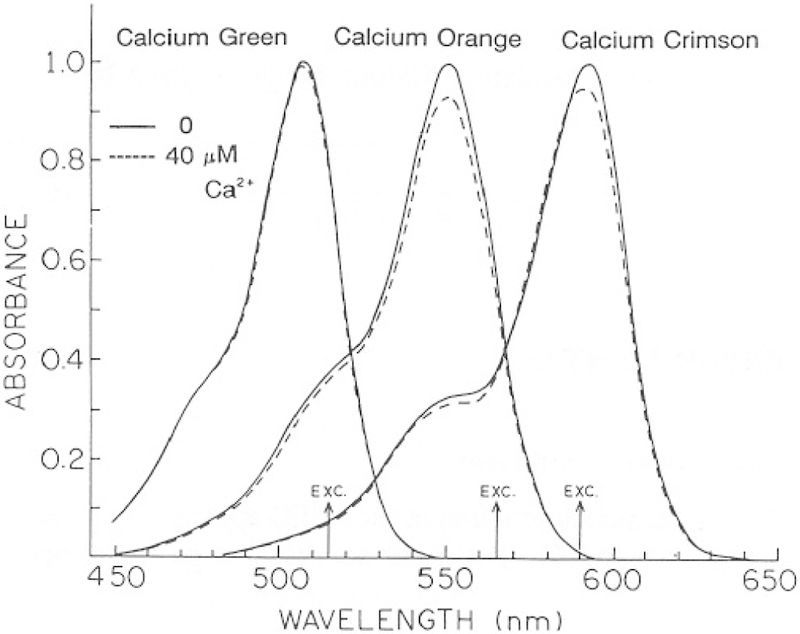
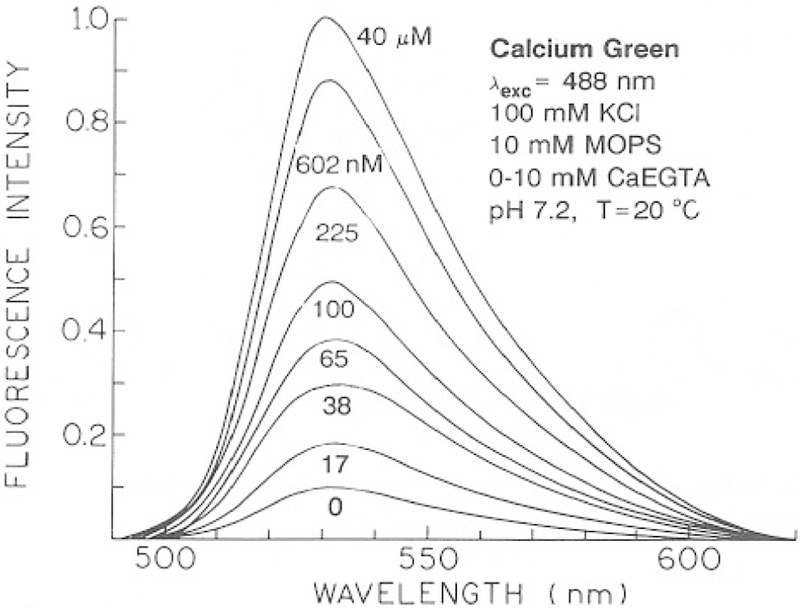
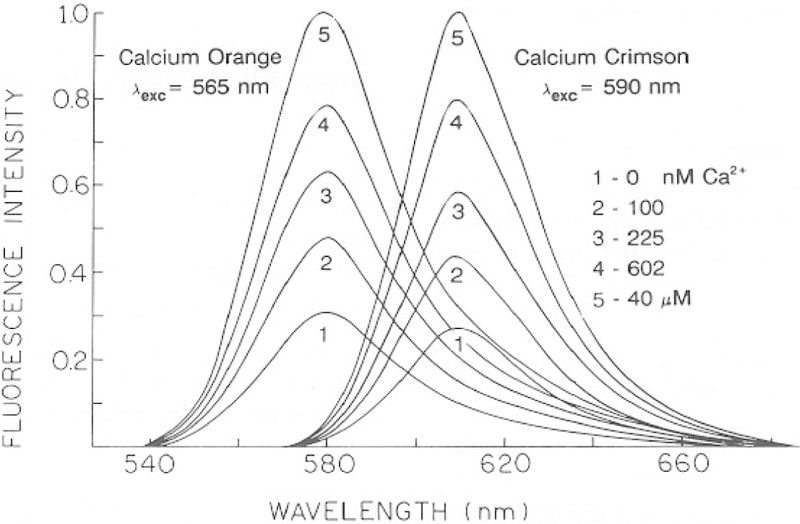
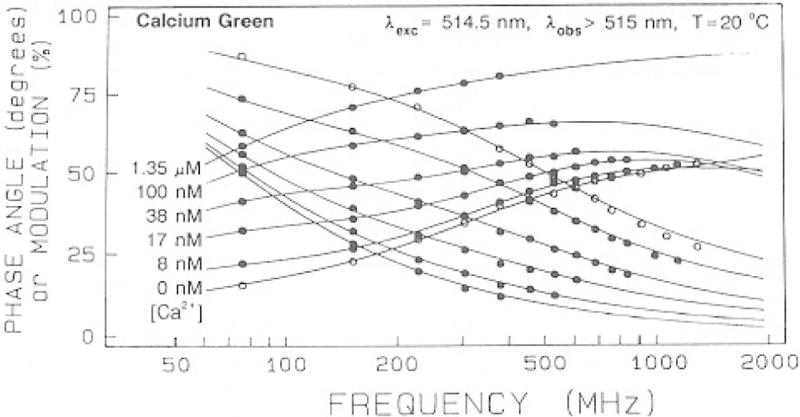
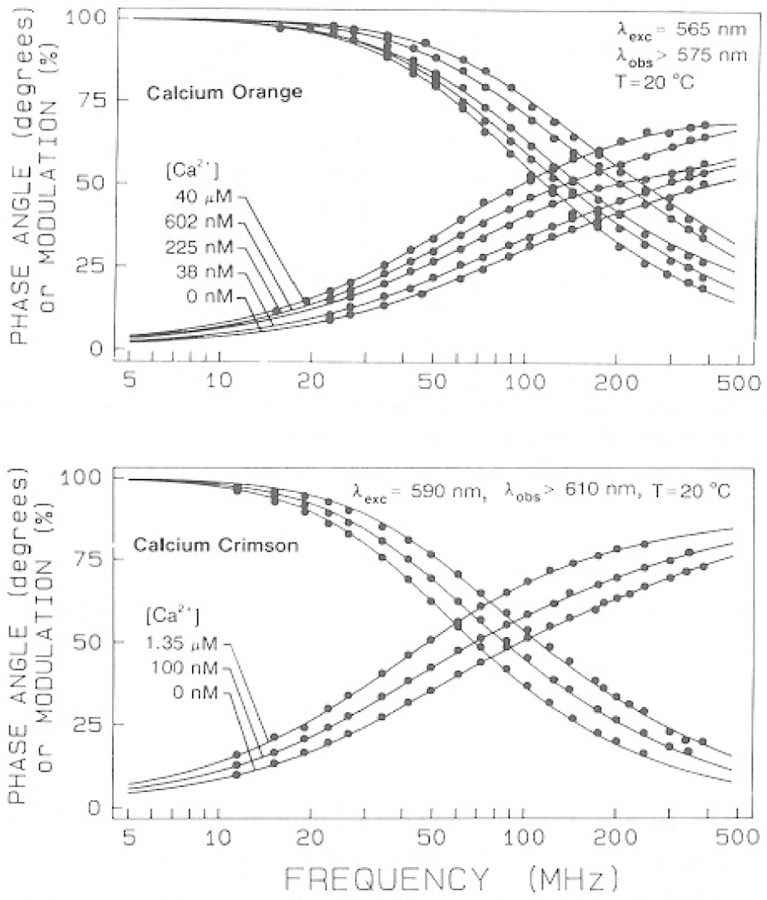
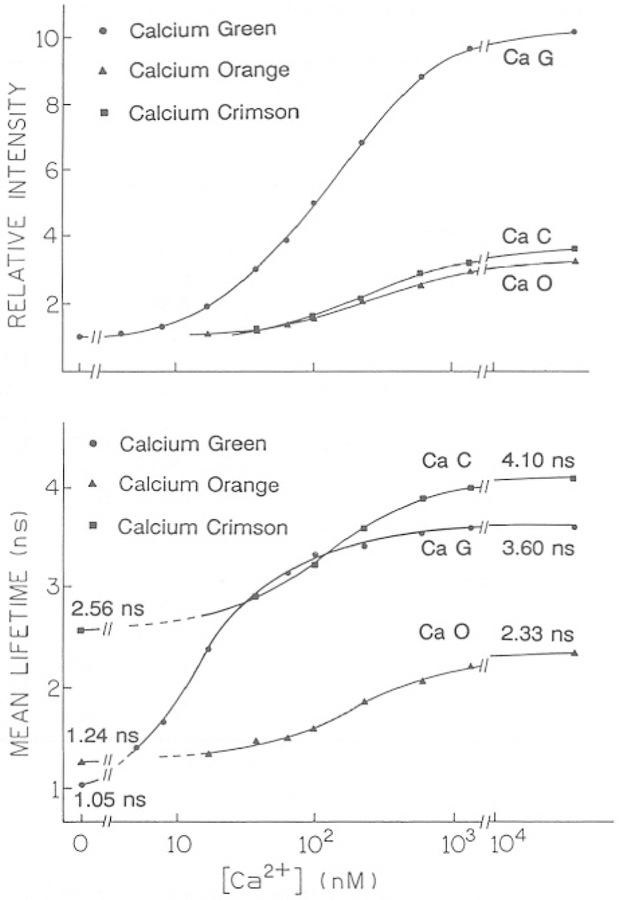
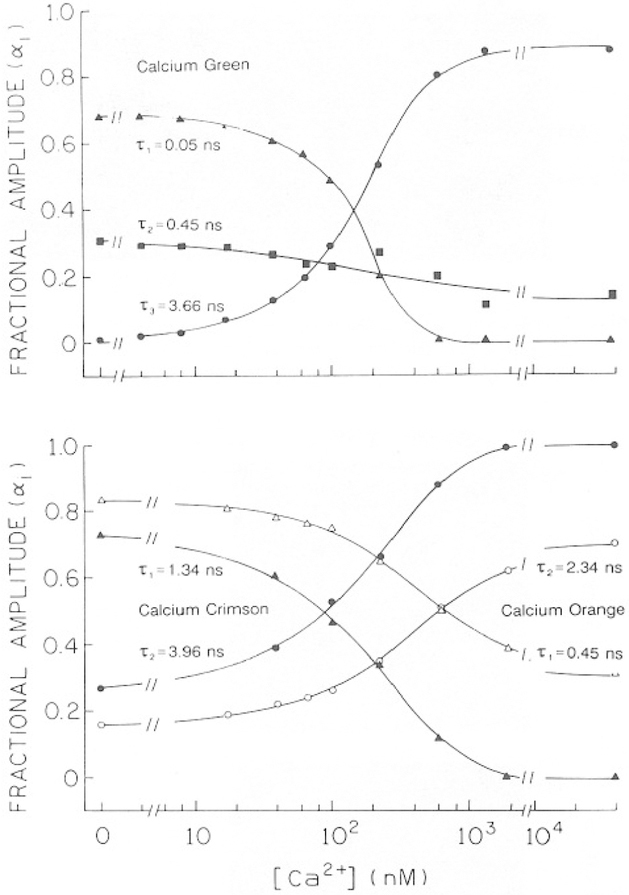
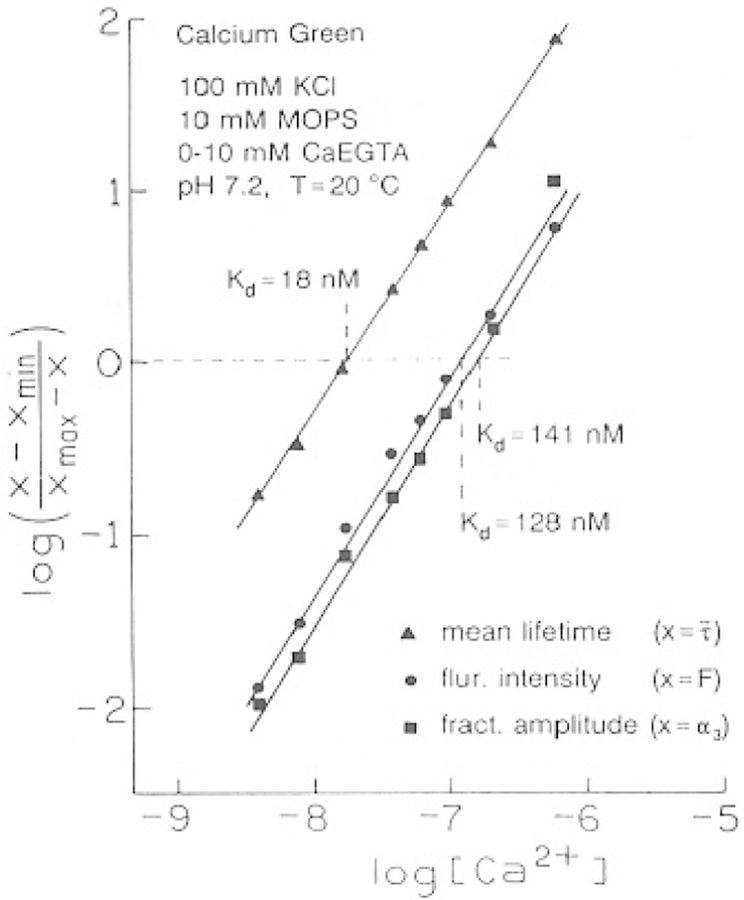
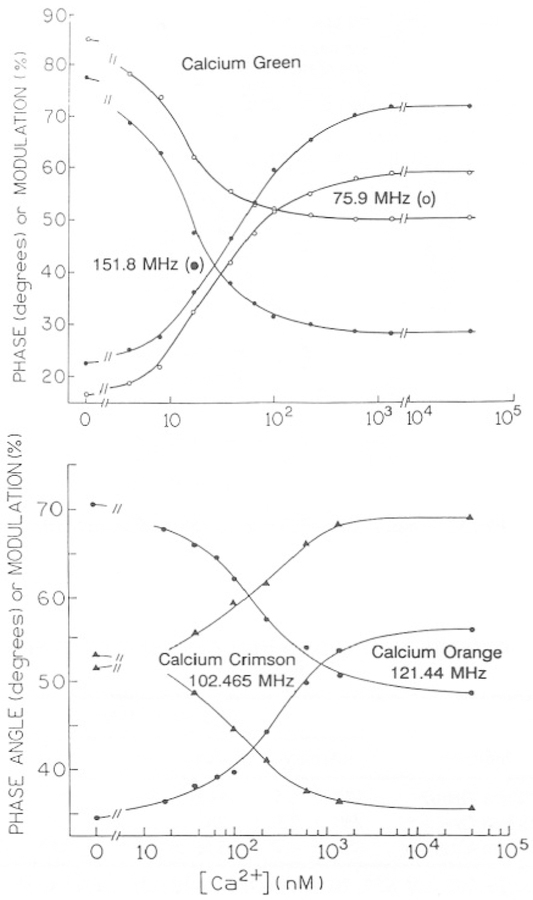
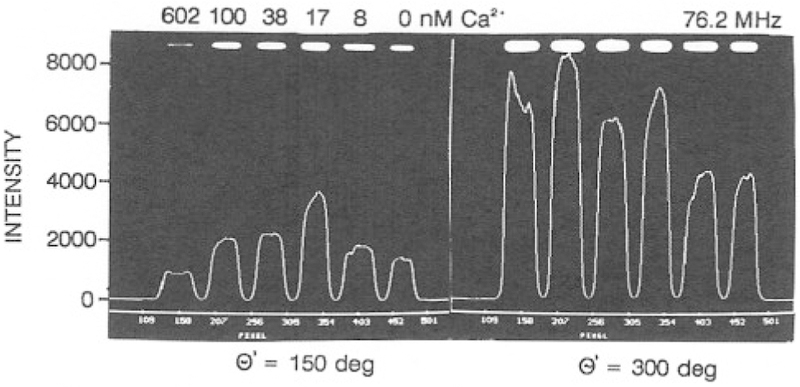
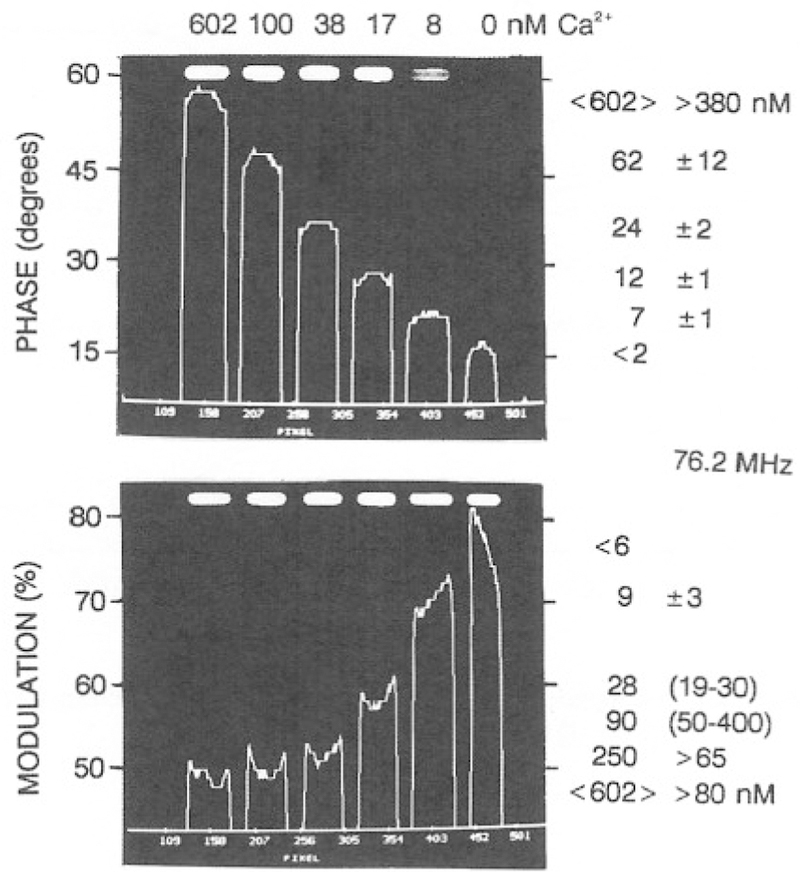
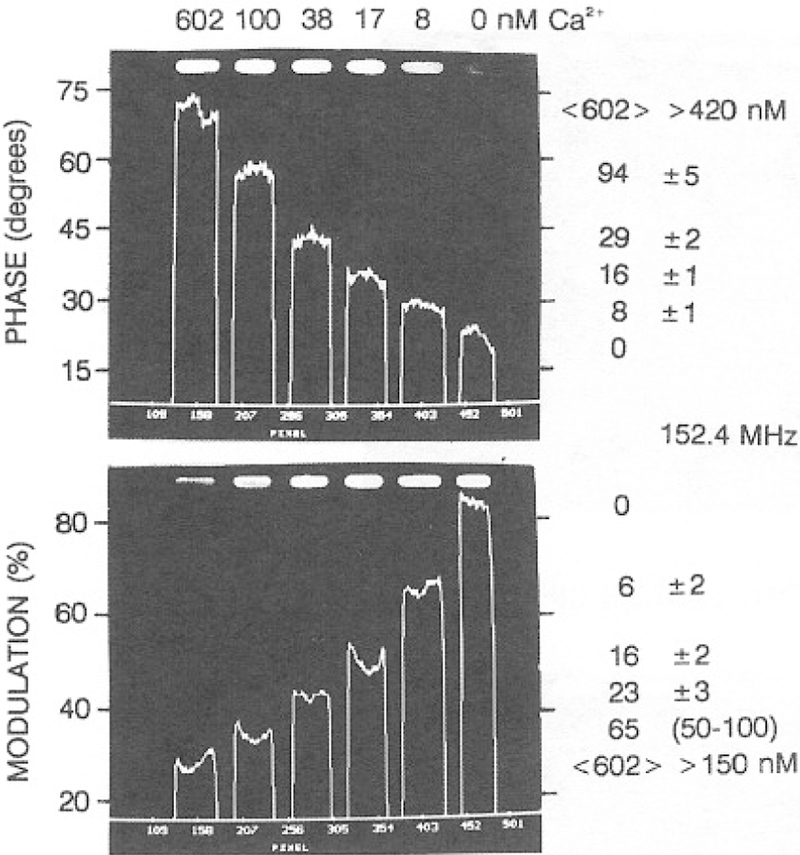
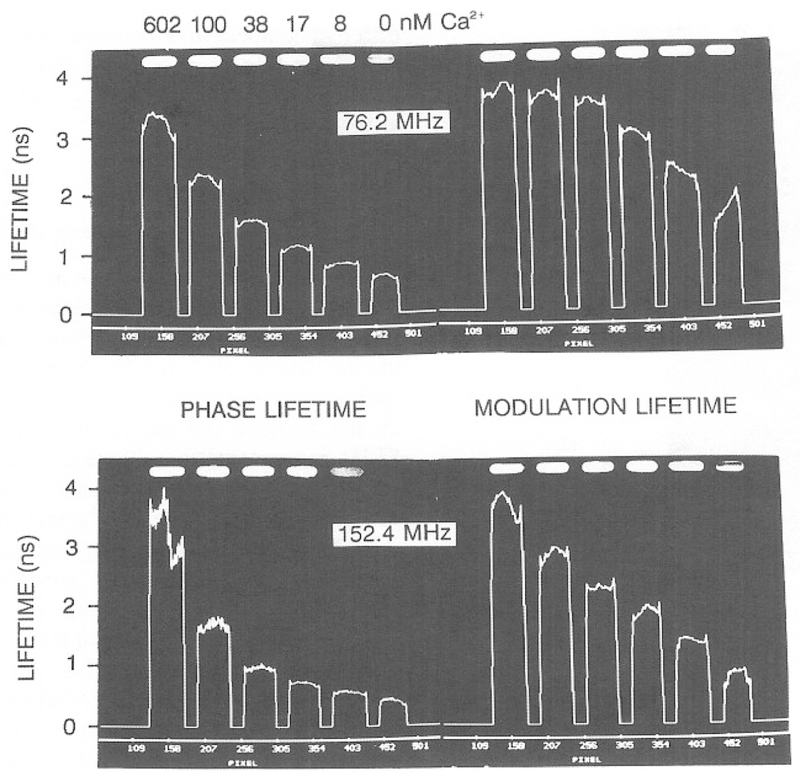
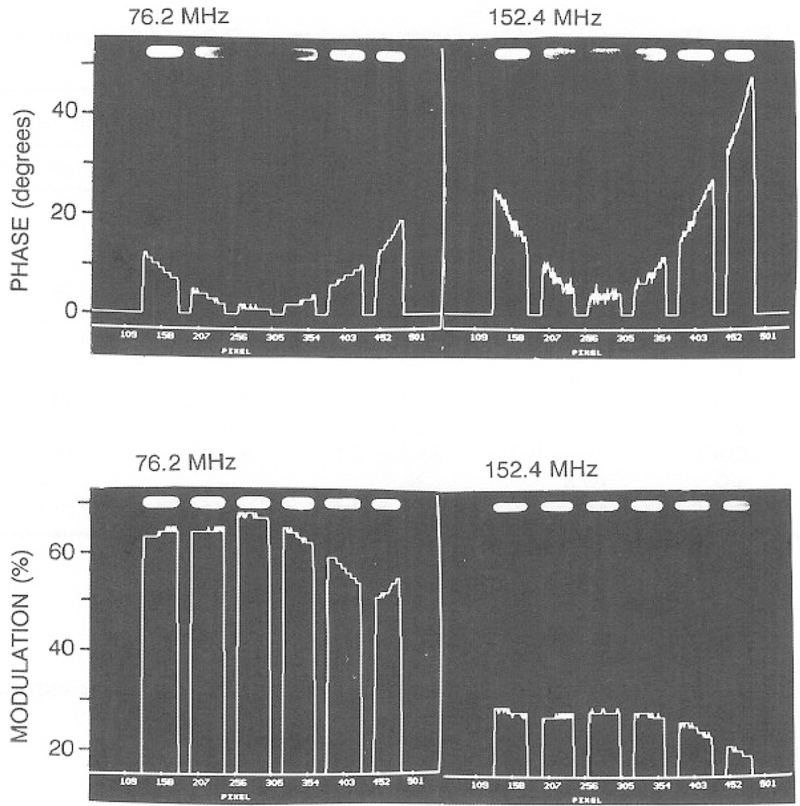
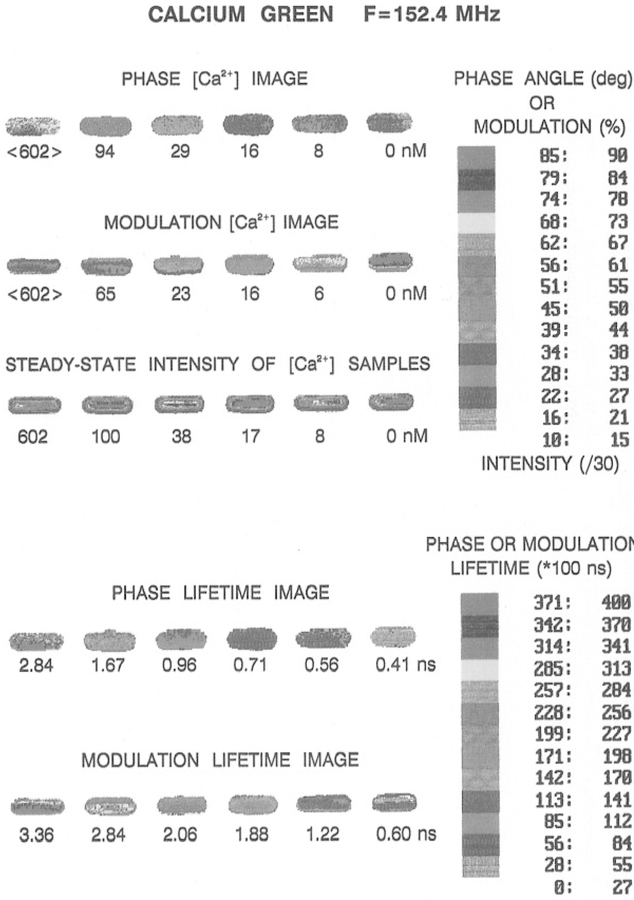
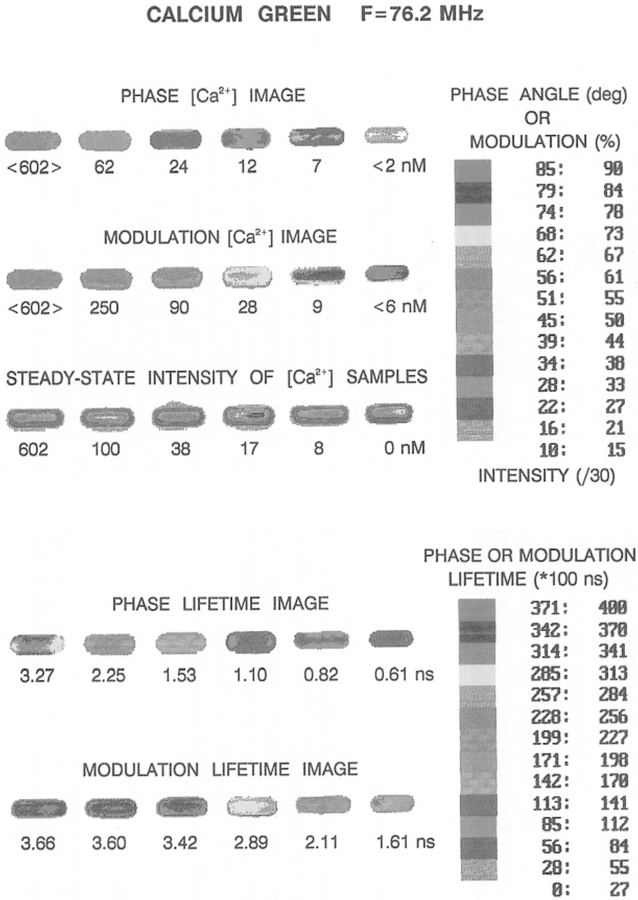
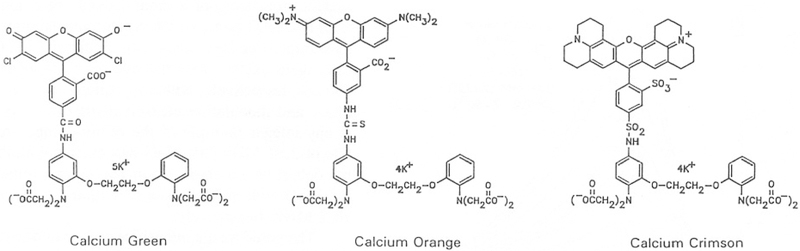
We describe imaging of calcium concentrations using the long-wavelength Ca(2+) indicators, Calcium Green, Orange, and Crimson. The lifetimes of these probes were measured using the frequency-domain method and were found to increase from 50% to severalfold in response to calcium. The two-dimensional images of the calcium concentration were obtained using a new apparatus for fluorescence lifetime imaging (FLIM). We also describe procedures to correct for the position-dependent frequency response of the gain-modulated image intensifier used in the FLIM apparatus. Importantly, the FLIM method does not require the probe to display shifts in the excitation or emission spectra. Using the FLIM method, calcium imaging is possible using probes which display changes in lifetime in response to calcium. Consequently, calcium imaging is possible with excitation wavelengths ranging from 488 to as long as 620 nm, where autofluorescence and/or photochemical damage is minimal. These probes are also suitable for calcium measurements of single cells using lifetime-based flow cytometry.


Figures

Fig. 1.
Fig. 1.
Intuitive schematic of fluorescence lifetime imaging of calcium.
Fig. 2.
Fig. 2.
Absorption spectra of Calcium Orange, Green, and Crimson.
Fig. 3.
Fig. 3.
Calcium-dependent emission spectra of Calcium Green.
Fig. 4.
Fig. 4.
Calcium-dependent emission spectra of Calcium Orange and Crimson.
Fig. 5.
Fig. 5.
Frequency-response of Calcium Green with increasing concentrations of calcium.
Fig. 6.
Fig. 6.
Frequency-response of Calcium Orange (top) and Calcium Crimson (bottom) with increasing amounts of calcium.
Fig. 7.
Fig. 7.
Ca2+-dependent fluorescence intensity (top) and mean lifetime (bottom) for Calcium Green, Orange, and Crimson.
Fig. 8.
Fig. 8.
Calcium-dependent preexponential factors for Calcium Green (top), Orange and Crimson (bottom).
Fig. 9.
Fig. 9.
Apparent dissociation constants of Calcium Green.
Fig. 10.
Fig. 10.
Top: Ca2+-dependent phase and modulation of Calcium Green at 75.9 and 151.8 MHz. Bottom: Ca2+-dependent phase and modulation for Calcium Orange at 121.44 MHz and Calcium Crimson at 102.465 MHz.
Fig. 11.
Fig. 11.
Phase-sensitive intensities of Calcium Green collected with the FLIM apparatus. The data shown are for a single row of pixels in the center of the illuminated regions of the cuvettes.
Fig. 12.
Fig. 12.
Phase angle and modulation images of Calcium Green at 76.2 MHz.
Fig. 13.
Fig. 13.
Phase angle and modulation images of Calcium Green at 152.4 MHz.
Fig. 14.
Fig. 14.
Lifetime images of Calcium Green.
Fig. 15.
Fig. 15.
Image intensifier correction curves. The sample was an axially illuminated tube of rhodamine 6G in water. Data are shown only where there was intensity from the six cuvettes.
Fig. 16.
Fig. 16.
Color imaging of Ca2+ at 76.2 MHz. The upper half shows the color-coded phase and modulation values. The Ca2+ concentrations obtained from the phase and modulation data are shown under each image. The [Ca2+] values under the steady-state intensity images are the known [Ca2+].
Fig. 17.
Fig. 17.
Color images of Ca2+ at 152.4 MHz. See the legend to Fig. 16 for details. The phase and modulation values were corrected for position-dependent phase and modulation values (Fig. 15), as described for Figs. 12 and 13.
Scheme I.
Scheme I.
Chemical structures of Calcium Green (CaG), Orange (CaO), and Crimson (CaC).

References

    1. Tsien R (1980) Biochemistry 19, 2396–2404. - PubMed
    1. Tsien R and Pozzan T (1989) Methods Enzymel 172, 230–262. - PubMed
    1. Grynkiewicz G, Poenie M, and Tsien RY (1985) J. Biol. Chem 260, 3440–3450. - PubMed
    1. Komada H, Nakabayashi H, Nakano H, Hara M, Yoshida T, Takanari H, and Izutsu K (1989) Cell Struct. Funct 14, 141–150. - PubMed
    1. Moore ED, Becker PL, Fogarty KE, Williams DA, and Fay FS (1990) Cell Calcium 11, 157–179, - PubMed

LinkOut - more resources