. 2013 Nov;5(11):802-12.
doi: 10.18632/aging.100613.

Enhancing protein disaggregation restores proteasome activity in aged cells

Affiliations

Enhancing protein disaggregation restores proteasome activity in aged cells

Veronica Andersson et al. Aging (Albany NY). 2013 Nov.

Abstract

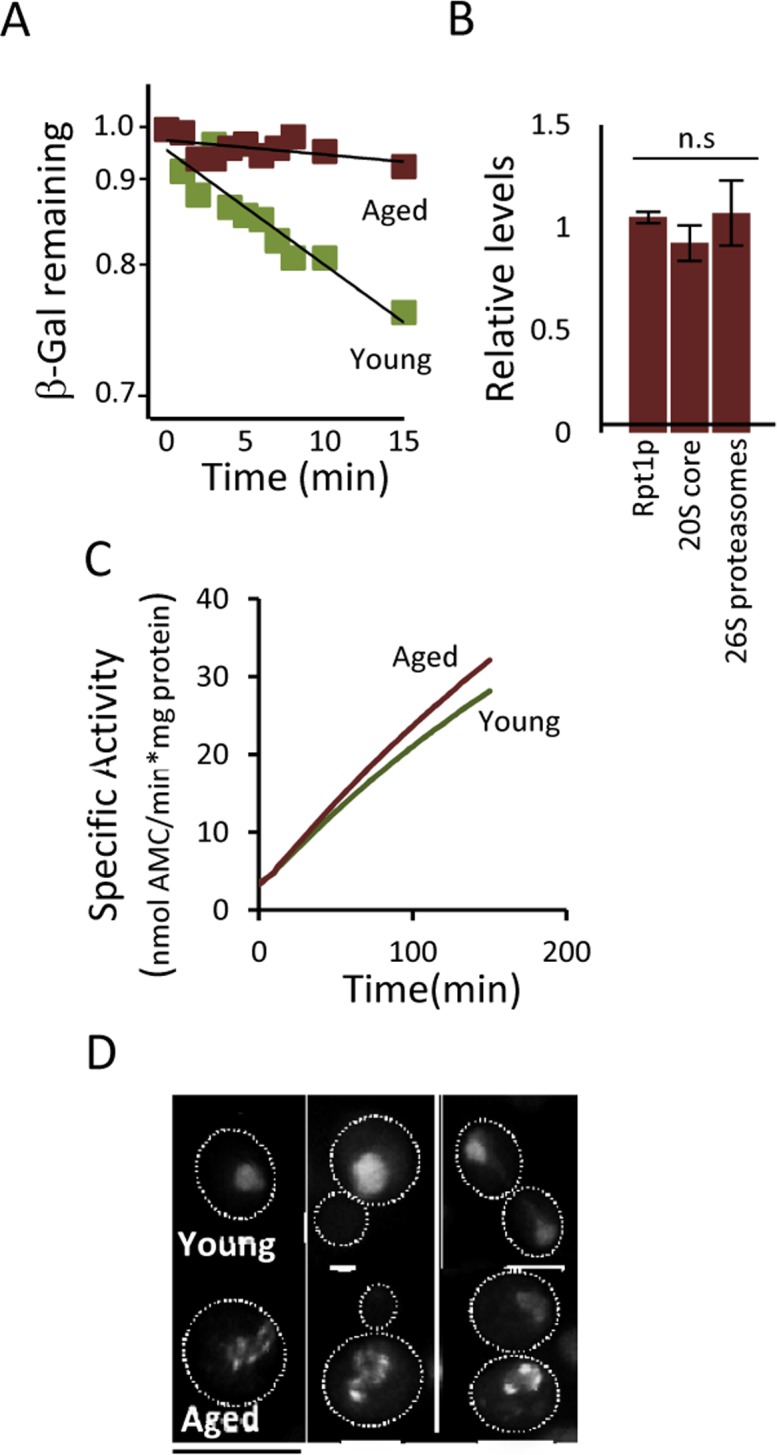
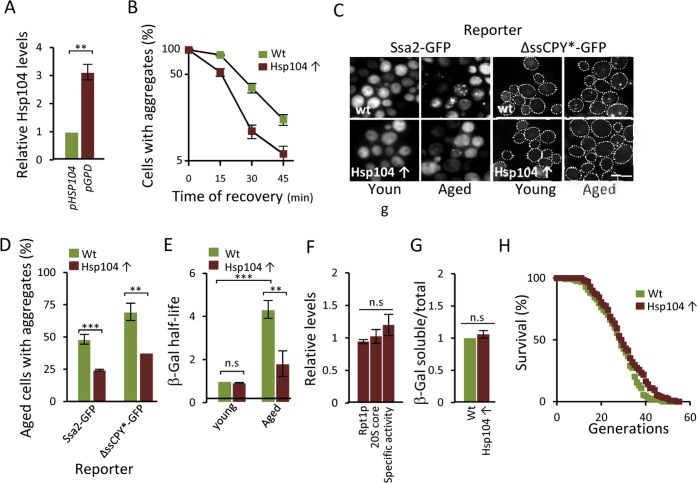
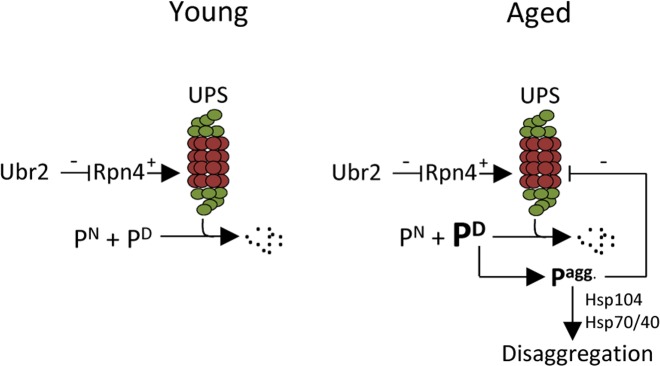
The activity of the ubiquitin-proteasome system, UPS, declines during aging in several multicellular organisms. The reason behind this decline remains elusive. Here, using yeast as a model system, we show that while the level and potential capacity of the 26S proteasome is maintained in replicatively aged cells, the UPS is not functioning properlyin vivo. As a consequence cytosolic UPS substrates, such as ΔssCPY* are stabilized, accumulate, and form inclusions. By integrating a pGPD-HSP104 recombinant gene into the genome, we were able to constitutively elevate protein disaggregase activity, which diminished the accumulation of protein inclusions during aging. Remarkably, this elevated disaggregation restored degradation of a 26S proteasome substrate in aged cells without elevating proteasome levels, demonstrating that age-associated aggregation obstructs UPS function. The data supports the existence of a negative feedback loop that accelerates aging by exacerbating proteostatic decline once misfolded and aggregation-prone proteins reach a critical level.


Conflict of interest statement

The authors of this manuscript declare no conflicts of interest.

Figures

Figure 1
Figure 1. Aged yeast cells accumulate aggregates of the cytosolic UPS substrate ΔssCPY*.
(A) Representative image of bud scars in young and aged fractions. (B) Age distribution in the young and aged mother cell fractions collected. (C) The average age (arrow) of the isolated mother cells in relation to the life-span survival curve. (D) Localization of ΔssCPY*-GFP in young and aged cells. (E) Percentage of cells with ΔssCPY*-GFP foci in young and aged fractions (n=3). (F) Representative image of Hsp104-GFP distribution in young and aged cells (G) Percentage of cells with Hsp104-GFP foci in young and aged fractions (n>3). Error bars represent standard deviation. For statistical analyses, the paired two-tailed t-test was used ***P<0.001. (n= sets of analysis; Scale-bars represent 10μm).
Figure 2
Figure 2. Lowering proteasome function results in increased protein aggregation.
(A) Representative images of Hsp104-GFP distribution with and without the addition of the proteasome inhibitor MG132 (100 μM) to a growing culture. (B) Percentage of cells with Hsp104-GFP foci after partial proteasomal inhibition by MG132. (C) Relative levels of protein ubiquitination upon growing the conditional proteasomal mutant rpt4-145 (ts) at the permissive (22°C) and near non-permissive (35°C) temperature. Levels were normalized to the levels in wt cells grown at 22°C. (D) Representative images of Hsp104-GFP localization upon growth of wt and rpt4-145 cell at the permissive (22°C) and near non-permissive (35°C) temperature. (E) Percentage of wt and rpt4-145 cells with Hsp104-GFP foci after growth at the permissive (22°C) and near non-permissive (35°C) temperature. (F) The clearance of Hsp104-GFP foci was followed over time after an initial burst in aggregate formation after the temperature shift. Time point “0” depicts cells growing at 22°C and subsequent time points depict cells following the indicated time at 35°C. (G) Percentage of wt and rpt4-145 cells with Hsp104-GFP foci. Quantification of Hsp104-GFP foci formation in the experiment in “F”. Error bars represent standard deviation (n=2). For statistical analysis, the paired two-tailed t-test was used where *P<0.05, **P<0.01, ***P<0.001 and n.s = no significant difference. (n= sets of analysis; Scale-bars represent 10μm).
Figure 3
Figure 3. Increasing proteasome production reduces aggregate formation.
(A) Representative images of Hsp104-GFP distribution in wt and ubr2Δ cells after H2O2 exposure (0.6 mM). Time point “0” depicts cells before stress whereas subsequent time points depict cells at the indicated time point following the addition of H2O2. (B) Percentage of wt and ubr2Δ cells with Hsp104-GFP foci over time after peroxide stress (n=2). (C) Representative image of Hsp104-GFP localization in young and aged (~13-15 generations) wt and ubr2Δ cells. (D) Percentage of aged wt and ubr2Δ cells containing Hsp104-GFP foci (n≥3). “Total” represents the percentage of cells containing foci independent of size, whereas “inclusions” represent the percentage of cells with large foci. Error bars represent standard deviation. For statistical analysis, the paired two-tailed t-test was used where *P<0.05, **P<0.01, ***P<0.001 and n.s = no significant difference. (n= sets of analysis; Scale-bars represent 10μm).
Figure 4
Figure 4. Proteasome function is diminished in aged cells.
(A) Degradation of the in vivo UPS substrate ub-P-βgal over time in young and aged (~13-15 generations) cells after the inhibition of protein synthesis. The starting β-gal levels were set to 1. The figure depicts representative results from one out of six independent experiments (P=7.38E-06). (B) Relative levels of Rpt1p (19S subunit), 20S core proteins, and 26S proteasomes (based on native gels) in aged cells compared to young cells (n≥3). (C) Proteasomal capacity in total protein extracts measured as the rate of hydrolysis of the fluorogenic peptide suc-LLVY-AMC (Chymotryptic activity) depicted as the specific activity (nmol AMC/min*mg total protein). A representative figure is presented (n=3). (D) Rpt6-GFP (19S subunit) localization in young and aged (~13-15 generations) cells. Error bars represent standard deviation. For statistical analysis, the paired two-tailed t-test was used where *P<0.05, **P<0.01, ***P<0.001 and n.s = no significant difference. (n= sets of analysis; Scale-bars represent 10μm.
Figure 5
Figure 5. Overproducing Hsp104 mitigates aggregate accumulation and restores proteasome function in aged cells.
(A) Relative levels of Hsp104 produced from the wt HSP104 and GPD promoters as determined by anti-Hsp104 immuno-blot analysis (n=2). (B) Percentage of cells with Ssa2-GFP foci following heat stress in the wt and Hsp104 overproducing (Hsp104↑) strains. Time point “0” represents cells after 30 min incubation at 42°C, whereas subsequent time points represent cells following the indicated time of recovery at 30°C (n=2). (C) The effect of Hsp104 overproduction on aggregate formation. Representative image of Ssa2-GFP and ΔssCPY*-GFP in young and aged, wt and Hsp104 overproducing cells. (D) Percentage of aged wt and Hsp104 overproduction cells with Ssa2-GFP or ΔssCPY*-GFP foci (n=2). (E) Relative half-life of β-gal in wt and Hsp104 overproducing young and aged cells. Values were normalized to the half-life in wt young cells (n=3). (F) Relative levels of Rpt1p (19S subunit), 20S core proteins, and proteasome specific activity (rate of hydrolysis of suc-LLVY-AMC) in Hsp104 overproducing cells compared to wt cells. (n≥2). (G) Relative levels of soluble β-gal in wt and Hsp104 overproducing cells normalized to total protein (see Experimental procedures for details) (n=2). Error bars represent standard deviation. For statistical analysis, the paired two-tailed t-test was used where *P<0.05, **P<0.01, ***P<0.001 and n.s = no significant difference. (Scale-bar represents 10μM). (H) Life-span curves of wt and Hsp104 overproducing cells. Mean replicative life-spans are: wt (28 ± 0), Hsp104 overproduction (29.5 ± 1.5) (n=2). (n= sets of analysis).
Figure 6
Figure 6. Schematic representation of how aggregated proteins might result in a negative proteostasis feedback loop.
One of many cellular functions of the UPS is to degrade native (e.g. cell cycle regulators), damaged, or aberrant proteins. If the level of damaged proteins exceeds the proteasomal capacity or if UPS degradation is somehow compromised, protein aggregates will form. The disaggregase Hsp104 can together with Hsp70/40 resolve protein aggregates. However, if the accumulation of aggregated protein is too severe, as seen in aged cells, these may interfere with the proper function of the UPS creating a negative feedback loop. This study indicates that the buildup of aggregates in aged cells can be counteracted either by increasing the amount of proteasomes present by stabilizing Rpn4, through the deletion of UBR2, or by increasing the level of disaggregation through Hsp104 overproduction. [UPS=ubiquitin proteasome system; PN= native protein; PD= damaged protein Pagg.= aggregated proteins].

References

    1. Stadtman ER, Starke-Reed PE, Oliver CN, Carney JM, Floyd RA. Protein modification in aging. Exs. 1992;62:64–72. - PubMed
    1. Barja G. Mitochondrial free radical production and aging in mammals and birds. Annals of the New York Academy of Sciences. 1998;854:224–238. - PubMed
    1. Levine RL. Carbonyl modified proteins in cellular regulation, aging, and disease. Free radical biology & medicine. 2002;32:790–796. - PubMed
    1. Nystrom T. Role of oxidative carbonylation in protein quality control and senescence. The EMBO journal. 2005;24:1311–1317. - PMC - PubMed
    1. Koga H, Kaushik S, Cuervo AM. Protein homeostasis and aging: The importance of exquisite quality control. Ageing research reviews. 2011;10:205–215. - PMC - PubMed

Publication types

MeSH terms

Substances