. 2013 Dec 15;191(12):5973-83.
doi: 10.4049/jimmunol.1301521. Epub 2013 Nov 15.

Essential functions for ID proteins at multiple checkpoints in invariant NKT cell development

Affiliations

Essential functions for ID proteins at multiple checkpoints in invariant NKT cell development

Mihalis Verykokakis et al. J Immunol. .

Abstract

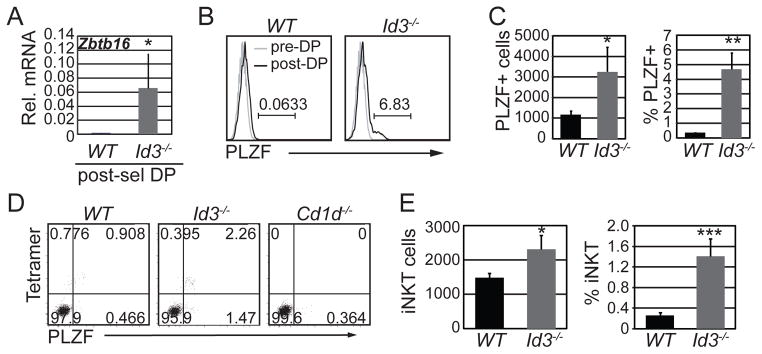
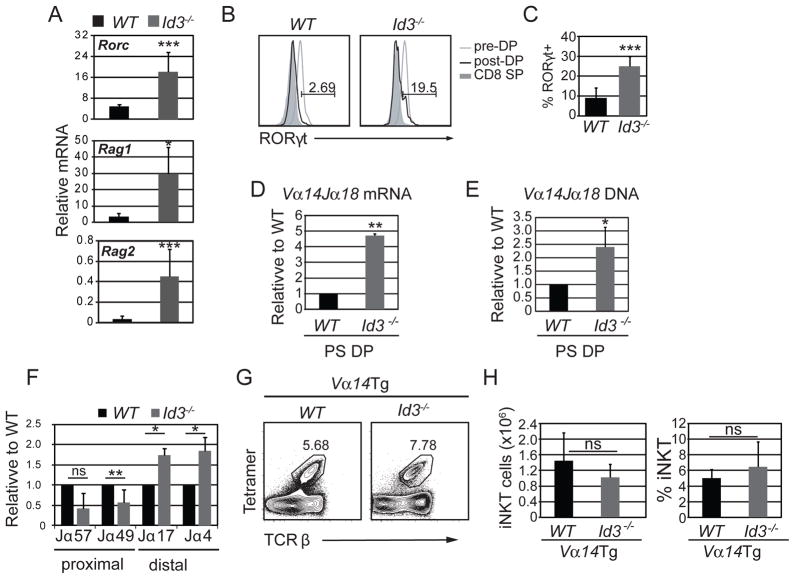
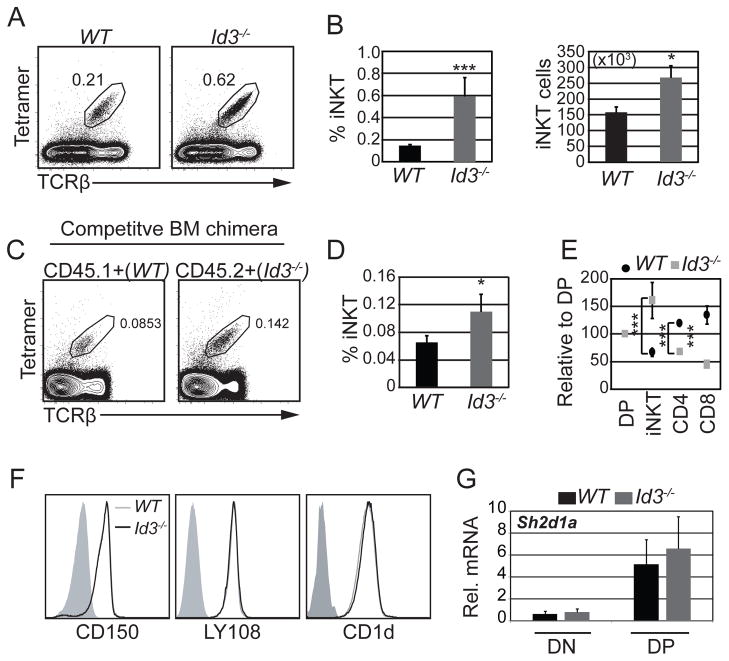
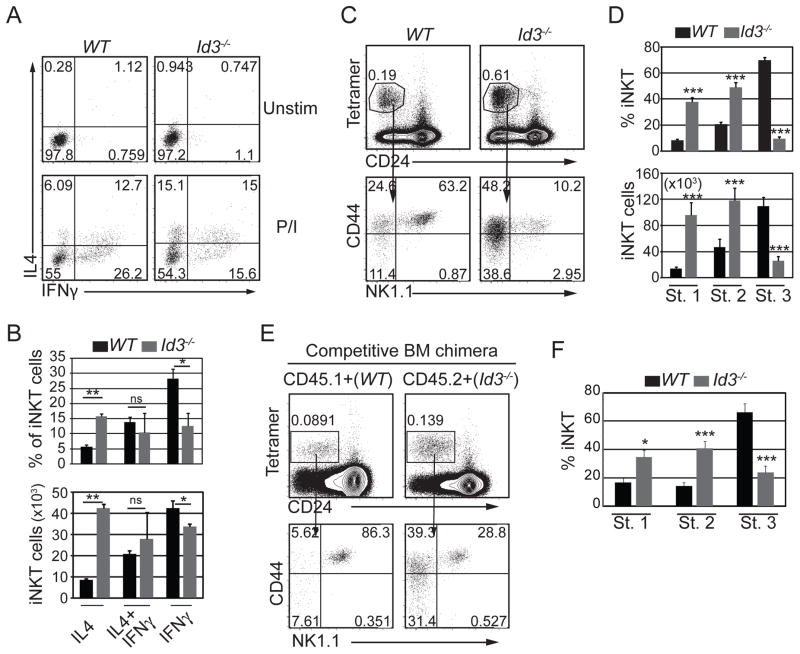
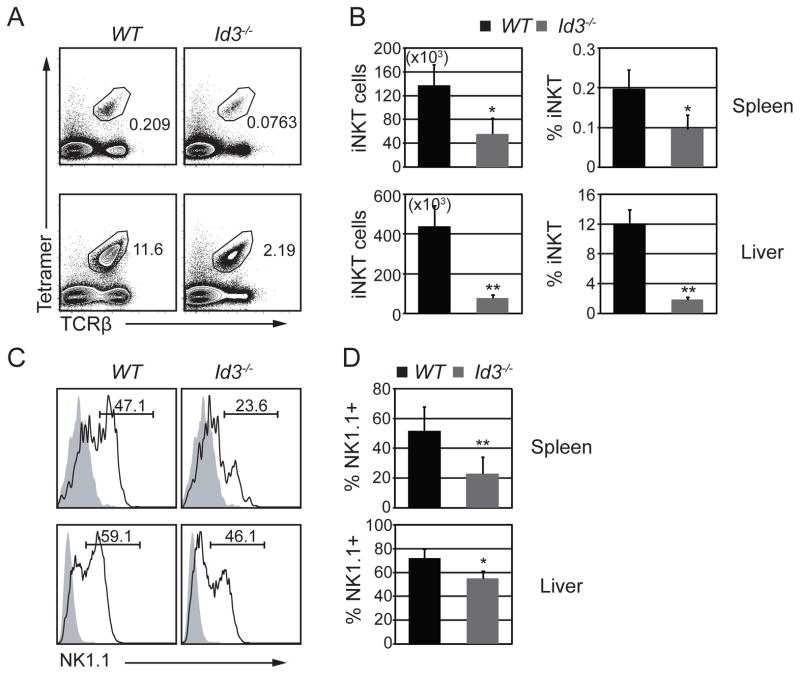
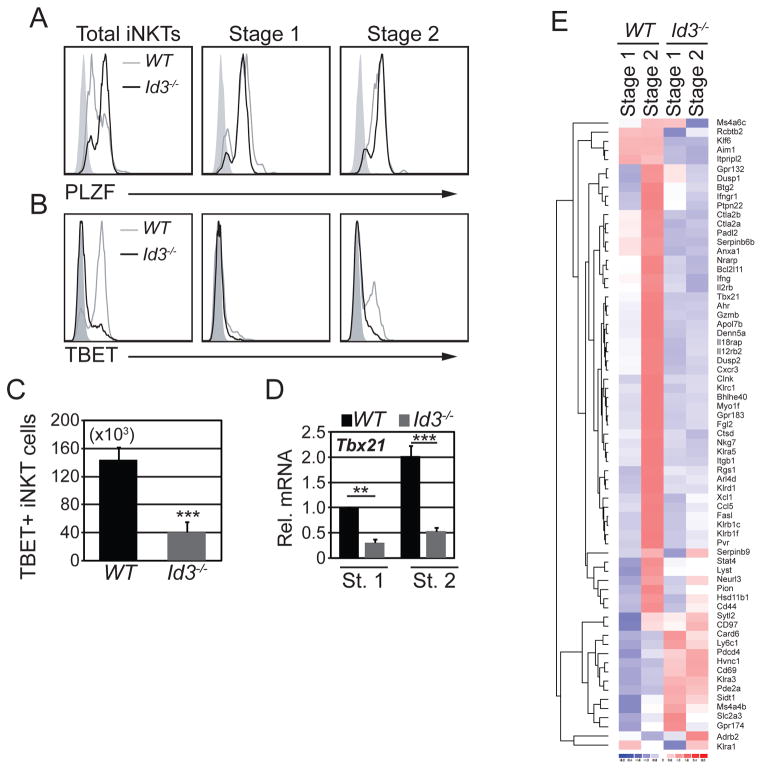
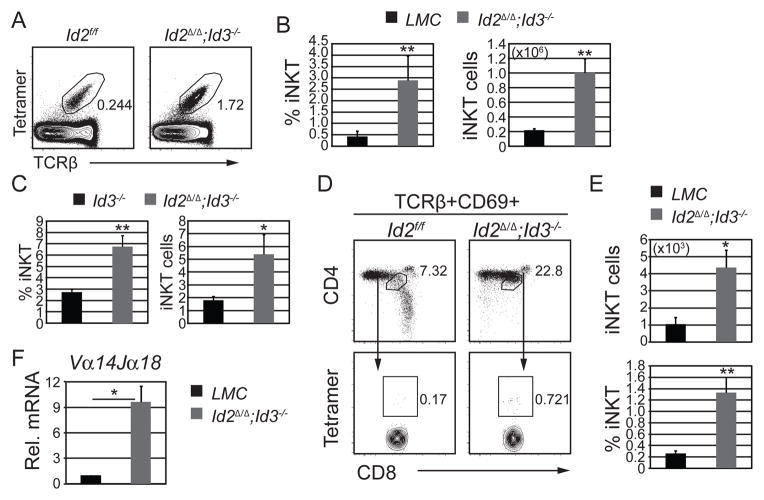
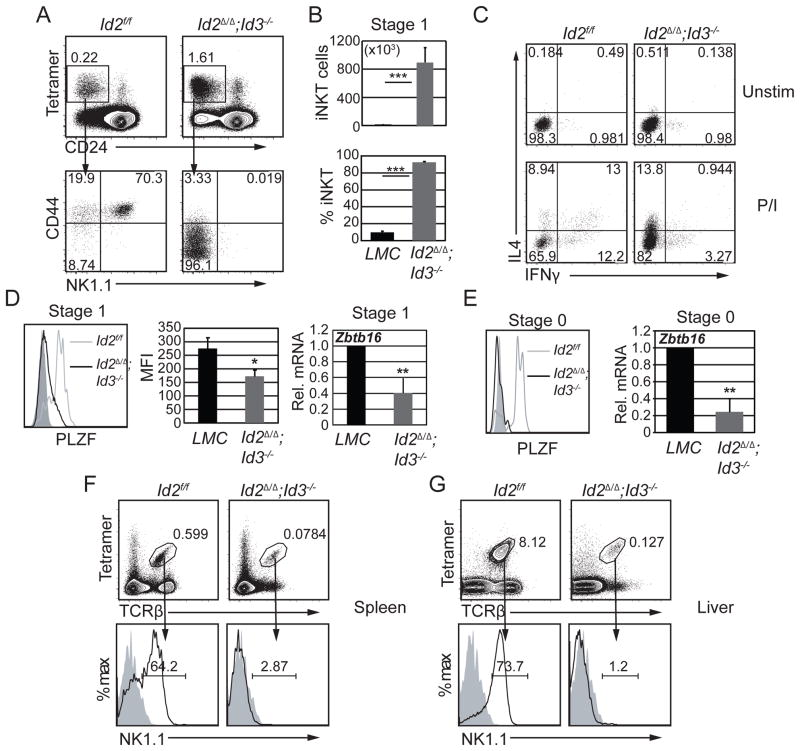
Invariant NKT (iNKT) cells display characteristics of both adaptive and innate lymphoid cells (ILCs). Like other ILCs, iNKT cells constitutively express ID proteins, which antagonize the E protein transcription factors that are essential for adaptive lymphocyte development. However, unlike ILCs, ID2 is not essential for thymic iNKT cell development. In this study, we demonstrated that ID2 and ID3 redundantly promoted iNKT cell lineage specification involving the induction of the signature transcription factor PLZF and that ID3 was critical for development of TBET-dependent NKT1 cells. In contrast, both ID2 and ID3 limited iNKT cell numbers by enforcing the postselection checkpoint in conventional thymocytes. Therefore, iNKT cells show both adaptive and innate-like requirements for ID proteins at distinct checkpoints during iNKT cell development.


Conflict of interest statement

Disclosure

The authors declare no competing financial interests.

Figures

Figure 1
Figure 1. ID3 limited the number of PLZF+ and Tet+ cells among PS DP thymocytes
(A) Quantitative RT-PCR (qPCR) analysis for Zbtb16 (PLZF) mRNA in sorted WT and Id3−/− TCRγδ-CD4+CD8+TCRβ+CD69+ thymocytes. The y-axis indicates Zbtb16 mRNA relative to Hprt mRNA analyzed in the same samples. Graphs show the mean ± SD of 5 independent experiments. n=5, *p<0.05, two-tailed unpaired t test. (B) Histograms showing expression of PLZF in gated TCRγδ-CD4+CD8+TCRβ+CD69+ (black line, post-DP) or TCRγδ-CD4+CD8+TCRβ−CD69− cells (grey line, pre-DP) thymocytes from the indicated mouse strains. The number above the line shows percent of PLZF+ cells among PS DP cells. (C) Average number and percentage of of PLZF+ among TCRγδ-CD4+CD8+TCRβ+CD69+ thymocytes. Graphs show mean ± SD of 8 independent experiments. n=8, *p<0.05, **p<0.01, ***p<0.001. (D) Flow cytometry plots showing PLZF and Tet staining on TCRγδ-CD4+CD8+TCRβ+CD69+ thymocytes from mice of the indicated genotype. (E) Graphs show the average number and percentage of Tet+ PS DP cells among PS DP thymocytes in WT and Id3−/− mice. Graphs show mean ± SD of 10 independent experiments. n=10, *p<0.05, ***p<0.001, two-tailed paired t test.
Figure 2
Figure 2. Id3−/− PS DP thymocytes had an increased number of Vα14Jα18 recombination events
(A) qPCR analysis of Rorc, Rag1 and Rag2 mRNA in sorted CD4+CD8+TCRβ+CD69+ thymocytes from WT and Id3−/− mice. Graphs show mean ± SD of 5 independent experiments. n=5, *p<0.05, two-tailed unpaired t test. (B) RORγt in gated post-selection (black line) or preselection (grey line) DP thymocytes from WT and Id3−/− mice. The shaded histogram shows RORγt expression in CD8+TCRβ+ cells, as a negative control. The number above the line shows percent of RORγt+ cells among PS DP cells. (C) Graph shows the average percentage of RORγt+ cells among PS DP cells in WT and Id3−/− mice. n=8, ***p<0.001. qPCR analysis of (D) Vα14Jα18 mRNA and (E) Vα14Jα18 DNA rearrangements in sorted CD4+CD8+TCRβ+CD69+ thymocytes from WT and Id3−/− mice. Numbers change in detection relative to WT. Graphs show the mean ± SD from 5 independent experiments. n=5 *p<0.05, **p<0.01, two-tailed unpaired t test. (F) qPCR analysis of transcripts containing gene segments that are proximal and distal to in TCRγδ-CD4+CD8+TCRβ+CD69+ thymocytes cells sorted from WT and Id3−/− mice. Numbers show change in detection relative to WT for each transcript. Graphs show the mean ± SD from 3 independent experiments. n=3 *p<0.05, **p<0.01, two-tailed unpaired t test. (G) Flow cytometry plots of total thymocytes from Id3+/+;Vα14Tg and Id3−/−;Vα14Tg mice showing the percentage of Tet+TCRβ+ iNKT cells. (H) Average number and percentage of iNKT cells in the indicated mouse strains. Graphs show the mean ± SD from 10 independent experiments, n=10.
Figure 3
Figure 3. Id3−/− mice had increased iNKT cell numbers
(A) Flow cytometry plots of total thymocytes from WT and Id3−/− mice showing the percentage of iNKT cells indentified by CD1dPBS57-tetramer and TCRβ staining. (B) Average percentage and number of total iNKT thymocytes in the indicated mouse strains. n=20 for each genotype *p<0.05, ***p<0.001. Graphs show the average of >15 independent experiments. Bars indicate standard deviation (SD). (C) Flow cytometry plots showing the percentage of Tet+TCRβ+ iNKT cells among CD45.1+ (WT) and CD45.2+ (Id3−/−) cells in competitive bone marrow (BM) chimeras. (D) Average percentage of Tet+Tcrβ+ iNKT cells among CD45.1+ (WT) and CD45.2+ (Id3−/−) cells. n=8 chimeric mice, *p<0.05, two-tailed paired t test. Bars indicate SD. (E) Analysis of DP, iNKT, CD4 and CD8 cells in competitive bone marrow chimeras shown as the percent of WT or Id3−/− DP cells. n=8, ***p<0.001, two-tailed paired t test. Bars indicate SD. (F) Histograms showing expression of CD150, LY108 and CD1d in DP thymocytes from WT and Id3−/− mice. (G) RT-QPCR analysis of Sh2d1a mRNA (encoding for the adaptor protein SAP), in CD4−CD8− and CD4+CD8+ sorted thymocytes from WT and Id3−/− mice. Solid grey histogram indicates isotype control.
Figure 4
Figure 4. ID3 was required for iNKT cell maturation
(A) Intracellular staining for IFNγ and IL4 in gated Tet+CD24− cells after in vitro culture with (lower panel) or without (upper panel) PMA and ionomycin for 5 hours. Numbers indicate percent of cells in each quadrant. (B) Average percentage and number of iNKT thymocytes expressing the indicated cytokines from WT and Id3−/− mice. Graphs show the mean ± SD from 4 independent experiments. n=4 for each genotype, *p<0.05, **p<0.01. (C) WT and Id3−/− thymocytes were analyzed for Tet+CD24− iNKT cells (upper panel) and CD44 and NK1.1 expression is shown in gated Tet+CD24− iNKT cells (lower panel). Numbers in plots indicate percent of cell subsets in the respective gates. (D) Average percentage and number of stage 1, stage 2 and stage 3 iNKT cells in WT and Id3−/− thymi. Graphs show the mean ± SD from >15 independent experiments. n=19, ***p<0.001. (E) Chimeric mice shown in Figure 1 were analyzed for Tet+CD24− thymocytes (upper panel) and surface expression of CD44 and NK1.1 (lower panel). (F) Average percentage of stage 1, stage 2 and stage 3 iNKT cells in CD45.1+(WT) and CD45.2+(Id3−/−) cells from the competitive bone marrow chimeras. Graphs show the mean ± SD from 8 independent experiments. n=8, *p<0.05, ***p<0.001, two-tailed paired t test.
Figure 5
Figure 5. Id3−/− peripheral iNKT cells failed to mature
(A) Flow cytometry plots showing the percentage of Tet+TCRβ+ iNKT cells in the spleen and liver from WT and Id3−/− mice. (B) Graphs show average number and percentage of iNKT cells in the spleen and liver of the indicated mouse strains. Graphs show mean ± SD from 8–10 independent experiments. *p<0.05, **p<0.01. (C) Histograms showing the expression of NK1.1 on total iNKT cells in the spleen and liver of WT and Id3−/− mice. Shaded histogram is the isotype control. Numbers indicate percent of NK1.1+ cells among iNKT cells. (D) Graphs show average percentage of NK1.1+ cells among the iNKT population in the spleen and liver of the indicated mouse strains. Graphs show mean ± SD from 8–10 independent experiments. *p<0.05, **p<0.01.
Figure 6
Figure 6. Id3−/− iNKT cells failed to induce the stage 3-associated transcriptional program
Histograms showing (A) PLZF or (B) TBET in total (left), stage 1 (middle) and stage 2 (right) iNKT cells from WT (grey line) and Id3−/− (black line) mice. Shaded histogram is expression of the respective protein in conventional CD4+ thymocytes, which are a negative control. (C) Average number of TBET+ iNKT cells in the thymus. The graph shows the mean ± SD from 12 independent experiments. n=12, ***p<0.001. (D) qPCR analysis of Tbx21 mRNA in sorted stage 1 and 2 iNKT thymocytes from WT and Id3−/− mice. The y-axis indicates change relative to expression in WT stage 1. The graph shows the mean ± SD from 3 independent experiments. Two mice for each mouse strain were pooled for each experiment. n=3, **p<0.01, ***p,0.001, two-tailed unpaired t test. (E) A set of 70 genes that are progressively upregulated during the transition from WT stage 1 through stage 3 was identified by analyzing normalized data from the Immunological Genome Consortium. The expression of each gene in WT and Id3−/− stage 1 and stage 2 iNKT cells is shown as a heatmap.
Figure 7
Figure 7. Increased iNKT cell development in the absence of both Id2 and Id3
(A) Flow cytometry plots of total thymocytes from Id2f/f and CD4Cre;Id2f/f;Id3−/− (Id2Δ/Δ;Id3−/−) mice showing the percentage of Tet+TCRβ+ iNKTs. (B) Average percentage and number of total iNKT thymocytes in the indicated mouse strains. (C) Fold change in iNKT percentage (left) and cell numbers (right) of Id3−/− and Id2Δ/Δ;Id3−/− relative to littermate controls (LMC). Graphs show the mean ± SD of 10 independent experiments. n=10, *p<0.05, **p<0.01. (D) TCRβ+CD69+ (post-selection) thymocytes from the indicated mouse strains were analyzed for CD4 and CD8 expression (upper panel) and DP cells were then analyzed for CD1dPBS57-tetramer staining. Numbers in the plots indicate percent of DP cells among PS thymocytes (upper panel), and percent of Tet+ cells among PS DP cells (lower panel). (E) Average number of CD4+CD8+TCRβ+CD69+Tet+ (upper graph) and percentage of Tet+ thymocytes among PS DP cells (lower graph). Graphs show the mean ± SD of 10 independent experiments. n=10, *p<0.05, **p<0.01. (F) qPCR analysis of Vα14Jα18 mRNA (in sorted CD4+CD8+TCRβ+CD69+ thymocytes from LMC and Id2Δ/Δ;Id3−/− mice. Graphs show the mean ± SD of 3 independent experiments. n=3, *p<0.05, two-tailed unpaired t test.
Figure 8
Figure 8. Id2 and Id3 regulate iNKT cell specification
(A) Id2f/f and Id2Δ/Δ;Id3−/− thymocytes were analyzed for Tet+CD24− iNKT cells (upper panel). The percentage of Tet+CD24− cells is indicated. CD44 and NK1.1 expression is shown in gated Tet+CD24− iNKT cells (lower panel). Numbers indicate percent of cells in the respective quadrants. (B) Average cell number and percentage of stage 1 iNKT cells in the indicated mouse strains. Graphs show the mean ± SD of 8 independent experiments. n=8, ***p<0.001. (C) Total thymocytes from Id2f/f and Id2Δ/Δ;Id3−/− mice were cultured in vitro with (lower panel) or without (upper panel) PMA and ionomycin for 5 hours. Intracellular staining of IFNγ and IL4 in gated Tet+CD24− cells is shown. Numbers indicate percent of cells in each quadrant. (D) Histogram (left panel) showing PLZF expression in stage 1 iNKT cells from Id2f/f (grey line) and Id2Δ/Δ;Id3−/− (black line) mice. Solid grey indicates PLZF expression from conventional CD4 thymocytes from littermate control mice. Graph (middle panel) shows the average mean fluorescence intensity (MFI) from 10 independent experiments. n=12, *p<0.05. Graph (right panel) shows qPCR analysis of Zbtb16 mRNA in sorted stage 1 (Tet+CD24−CD44−NK1.1−,) iNKT thymocytes from LMC and Id2Δ/Δ;Id3−/− mice. Numbers in the y-axis indicate fold change relative to LMC stage 1 expression. Graphs show the mean ± SD from 3 independent experiments. n=3, **p<0.01, two-tailed unpaired t test. (E) Histogram (left panel) showing PLZF expression in stage 0 (Tet+CD24+CD69+CD44−) iNKT cells from Id2f/f (grey line) and Id2Δ/Δ;Id3−/− (black line) mice. Solid grey indicates PLZF expression from conventional CD4 thymocytes from littermate control mice. Histogram is representative of two independent experiments. Graph (right panel) shows qPCR analysis of Zbtb16 mRNA in sorted stage 0 (Tet+CD24+CD69+CD44−) iNKT thymocytes from LMC and Id2Δ/Δ;Id3−/− mice. Numbers in the y-axis indicate fold change relative to LMC stage 1 expression. Graphs show the mean ± SD from 3 independent experiments. n=3, **p<0.01, two-tailed unpaired t test. Flow cytometry plots showing lymphocytes from the (F) spleen and (G) liver of the indicated mouse strains analyzed for Tet+TCRβ+ cells (upper panel). The percent of Tet+TCRβ+ cells is indicated. Histograms showing the percent of NK1.1+ iNKTs (lower panel). Solid grey indicates the isotype control.

Similar articles

Cited by

References

    1. Bendelac A, Savage PB, Teyton L. The biology of NKT cells. Annu Rev Immunol. 2007;25:297–336. - PubMed
    1. Van Kaer L, V, Parekh V, Wu L. Invariant natural killer T cells as sensors and managers of inflammation. Trends Immunol. 2013;34:50–58. - PMC - PubMed
    1. Berzins SP, Smyth MJ, Baxter AG. Presumed guilty: natural killer T cell defects and human disease. Nat Rev Immunol. 2011;11:131–142. - PubMed
    1. Park SH, Weiss A, Benlagha K, Kyin T, Teyton L, Bendelac A. The mouse CD1d-restricted repertoire is dominated by a few autoreactive T cell receptor families. J Exp Med. 2001;193:893–904. - PMC - PubMed
    1. Engel I, Kronenberg M. Making memory at birth: understanding the differentiation of natural killer T cells. Curr Opin Immunol. 2012;24:184–190. - PMC - PubMed

Publication types

MeSH terms

Substances

Associated data