Dose dependent side effect of superparamagnetic iron oxide nanoparticle labeling on cell motility in two fetal stem cell populations
- PMID: 24244310
- PMCID: PMC3820601
- DOI: 10.1371/journal.pone.0078435
Dose dependent side effect of superparamagnetic iron oxide nanoparticle labeling on cell motility in two fetal stem cell populations
Abstract
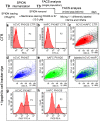
Multipotent stem cells (SCs) could substitute damaged cells and also rescue degeneration through the secretion of trophic factors able to activate the endogenous SC compartment. Therefore, fetal SCs, characterized by high proliferation rate and devoid of ethical concern, appear promising candidate, particularly for the treatment of neurodegenerative diseases. Super Paramagnetic Iron Oxide nanoparticles (SPIOn), routinely used for pre-clinical cell imaging and already approved for clinical practice, allow tracking of transplanted SCs and characterization of their fate within the host tissue, when combined with Magnetic Resonance Imaging (MRI). In this work we investigated how SPIOn could influence cell migration after internalization in two fetal SC populations: human amniotic fluid and chorial villi SCs were labeled with SPIOn and their motility was evaluated. We found that SPIOn loading significantly reduced SC movements without increasing production of Reactive Oxygen Species (ROS). Moreover, motility impairment was directly proportional to the amount of loaded SPIOn while a chemoattractant-induced recovery was obtained by increasing serum levels. Interestingly, the migration rate of SPIOn labeled cells was also significantly influenced by a degenerative surrounding. In conclusion, this work highlights how SPIOn labeling affects SC motility in vitro in a dose-dependent manner, shedding the light on an important parameter for the creation of clinical protocols. Establishment of an optimal SPIOn dose that enables both a good visualization of grafted cells by MRI and the physiological migration rate is a main step in order to maximize the effects of SC therapy in both animal models of neurodegeneration and clinical studies.
Conflict of interest statement
Figures


Similar articles
-
Strategies to enhance efficacy of SPION-labeled stem cell homing by magnetic attraction: a systemic review with meta-analysis.Int J Nanomedicine. 2019 Jul 3;14:4849-4866. doi: 10.2147/IJN.S204910. eCollection 2019. Int J Nanomedicine. 2019. PMID: 31308662 Free PMC article.
-
Superparamagnetic iron oxide nanoparticles as a tool to track mouse neural stem cells in vivo.Mol Biol Rep. 2019 Feb;46(1):191-198. doi: 10.1007/s11033-018-4460-9. Epub 2018 Nov 12. Mol Biol Rep. 2019. PMID: 30421128
-
Superparamagnetic iron oxide nanoparticle uptake alters M2 macrophage phenotype, iron metabolism, migration and invasion.Nanomedicine. 2016 May;12(4):1127-1138. doi: 10.1016/j.nano.2015.11.020. Epub 2015 Dec 28. Nanomedicine. 2016. PMID: 26733263
-
Longitudinal tracking of human fetal cells labeled with super paramagnetic iron oxide nanoparticles in the brain of mice with motor neuron disease.PLoS One. 2012;7(2):e32326. doi: 10.1371/journal.pone.0032326. Epub 2012 Feb 27. PLoS One. 2012. PMID: 22384217 Free PMC article.
-
Colloidal stability of superparamagnetic iron oxide nanoparticles in the central nervous system: a review.Nanomedicine (Lond). 2018 Jun;13(11):1385-1400. doi: 10.2217/nnm-2018-0021. Nanomedicine (Lond). 2018. PMID: 29949472 Review.
Cited by
-
Practical Issues with the Use of Stem Cells for Cancer Gene Therapy.Stem Cell Rev Rep. 2015 Oct;11(5):688-98. doi: 10.1007/s12015-015-9605-9. Stem Cell Rev Rep. 2015. PMID: 26123358 Free PMC article. Review.
-
Iron oxide nanoparticles may damage to the neural tissue through iron accumulation, oxidative stress, and protein aggregation.BMC Neurosci. 2017 Jun 26;18(1):51. doi: 10.1186/s12868-017-0369-9. BMC Neurosci. 2017. PMID: 28651647 Free PMC article. Review.
-
Strategies to enhance efficacy of SPION-labeled stem cell homing by magnetic attraction: a systemic review with meta-analysis.Int J Nanomedicine. 2019 Jul 3;14:4849-4866. doi: 10.2147/IJN.S204910. eCollection 2019. Int J Nanomedicine. 2019. PMID: 31308662 Free PMC article.
-
Evaluation of Dimercaptosuccinic Acid-Coated Iron Nanoparticles Immunotargeted to Amyloid Beta as MRI Contrast Agents for the Diagnosis of Alzheimer's Disease.Cells. 2023 Sep 14;12(18):2279. doi: 10.3390/cells12182279. Cells. 2023. PMID: 37759500 Free PMC article.
-
Chronic exposure of tilapia (Oreochromis niloticus) to iron oxide nanoparticles: Effects of particle morphology on accumulation, elimination, hematology and immune responses.Aquat Toxicol. 2016 Aug;177:22-32. doi: 10.1016/j.aquatox.2016.05.005. Epub 2016 May 11. Aquat Toxicol. 2016. PMID: 27232508 Free PMC article.
References
-
- Eifler AC, Thaxton CS (2011) Nanoparticle therapeutics: FDA approval, clinical trials, regulatory pathways, and case study. Methods Mol Biol 726: 325–338. - PubMed
-
- Stratmeyer ME, Goering PL, Hitchins VM, Umbreit TH (2010) What we know and don’t know about the bioeffects of nanoparticles: developing experimental approaches for safety assessment. Biomed Microdevices 12: 569–573. - PubMed
-
- Bulte JW, Kraitchman DL (2004) Monitoring cell therapy using iron oxide MR contrast agents. Curr Pharm Biotechnol 5: 567–584. - PubMed
Publication types
MeSH terms
Substances
LinkOut - more resources
Full Text Sources
Other Literature Sources
Medical

