. 2013 Nov 11;8(11):e78518.
doi: 10.1371/journal.pone.0078518. eCollection 2013.

Drug repositioning by kernel-based integration of molecular structure, molecular activity, and phenotype data

Affiliations

Drug repositioning by kernel-based integration of molecular structure, molecular activity, and phenotype data

Yongcui Wang et al. PLoS One. .

Erratum in

  • PLoS One. 2013;8(12). doi:10.1371/annotation/fe02e998-6a38-4fd7-9df6-241bc4d0f267

Abstract

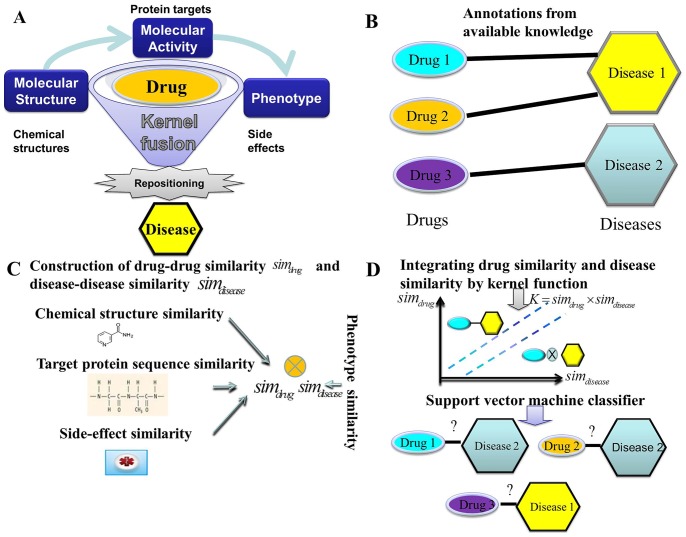
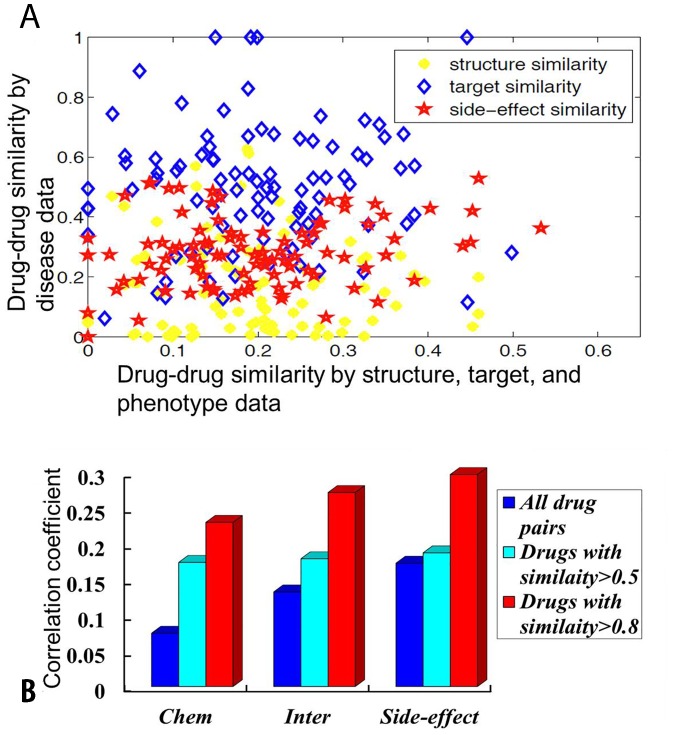
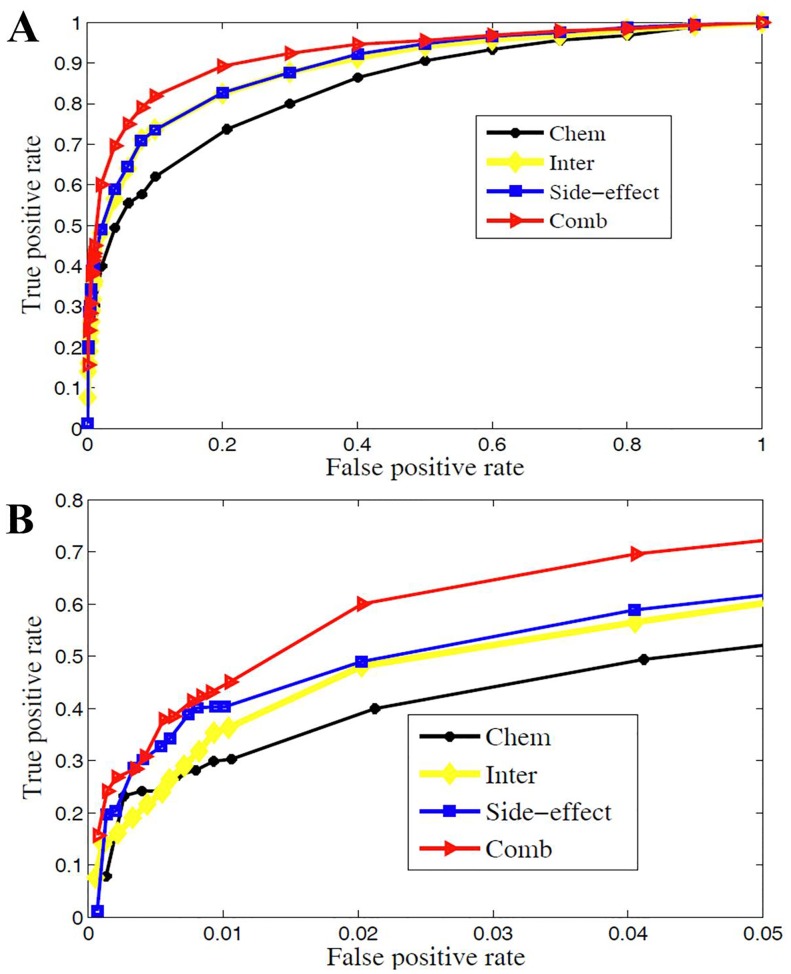
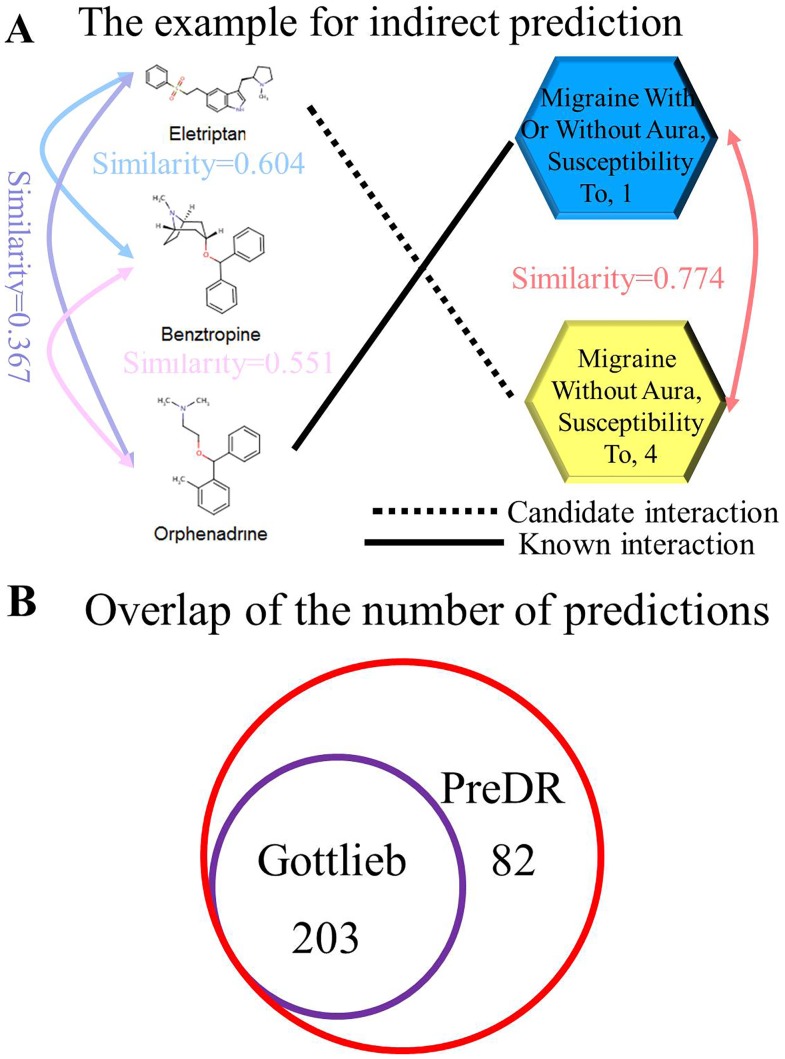
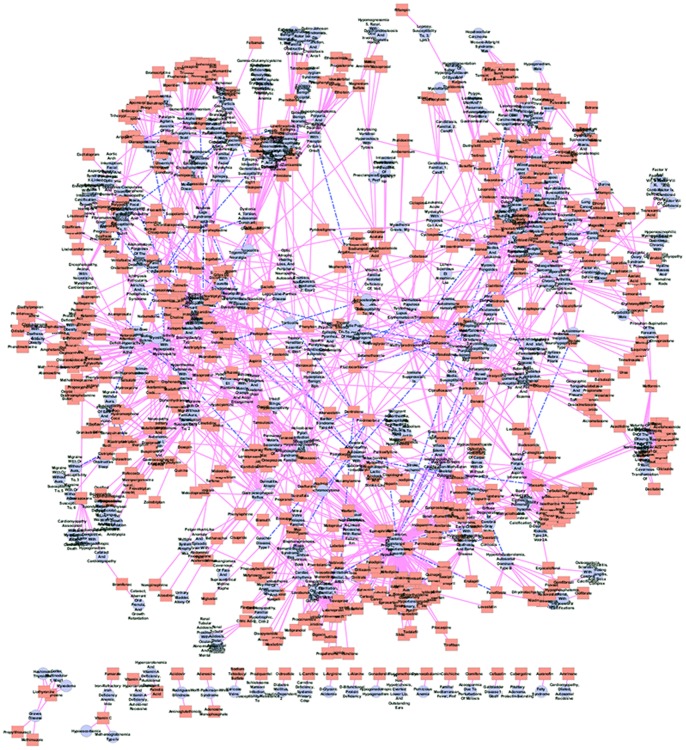
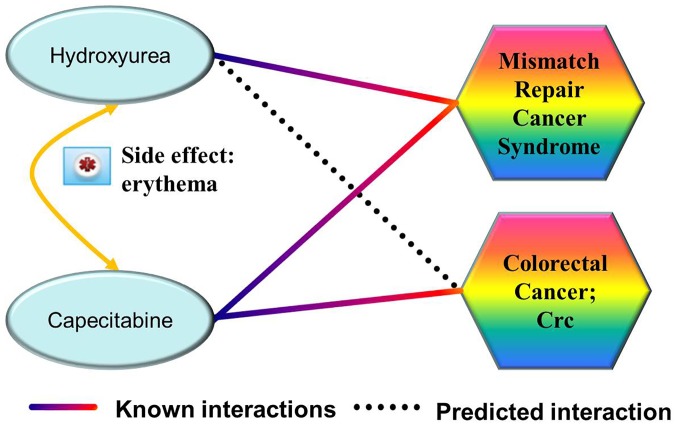
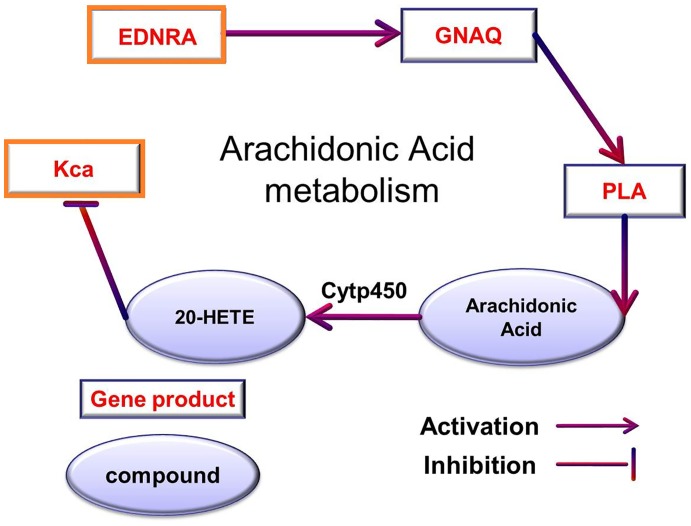
Computational inference of novel therapeutic values for existing drugs, i.e., drug repositioning, offers the great prospect for faster and low-risk drug development. Previous researches have indicated that chemical structures, target proteins, and side-effects could provide rich information in drug similarity assessment and further disease similarity. However, each single data source is important in its own way and data integration holds the great promise to reposition drug more accurately. Here, we propose a new method for drug repositioning, PreDR (Predict Drug Repositioning), to integrate molecular structure, molecular activity, and phenotype data. Specifically, we characterize drug by profiling in chemical structure, target protein, and side-effects space, and define a kernel function to correlate drugs with diseases. Then we train a support vector machine (SVM) to computationally predict novel drug-disease interactions. PreDR is validated on a well-established drug-disease network with 1,933 interactions among 593 drugs and 313 diseases. By cross-validation, we find that chemical structure, drug target, and side-effects information are all predictive for drug-disease relationships. More experimentally observed drug-disease interactions can be revealed by integrating these three data sources. Comparison with existing methods demonstrates that PreDR is competitive both in accuracy and coverage. Follow-up database search and pathway analysis indicate that our new predictions are worthy of further experimental validation. Particularly several novel predictions are supported by clinical trials databases and this shows the significant prospects of PreDR in future drug treatment. In conclusion, our new method, PreDR, can serve as a useful tool in drug discovery to efficiently identify novel drug-disease interactions. In addition, our heterogeneous data integration framework can be applied to other problems.


Conflict of interest statement

Competing Interests: The authors have declared that no competing interests exist.

Figures

Figure 1
Figure 1. The summary of our method: PreDR.
Subfigure A: The schematic plot for the PreDR method. Subfigure B: Collecting known interactions between drugs and diseases as gold standard positives in a bipartite graph. Subfigure C: Calculating the drug-drug and disease-disease similarity metrics. Subfigure D: Relating the similarity among drugs and similarity among diseases by kernel function, and applying SVM-based algorithm to predict unknown relationships among drugs and diseases.
Figure 2
Figure 2. The relationship analysis between drug disease similarity profile and drug molecular structure, activity, and phenotype similarity profiles.
Subfigure A: Scatter plot relating drug structures (yellow circles), targets (blue diamonds), side-effects (red stars) similarity with disease profile similarity. It shows that drug disease profile similarity is better correlated with its side-effect similarity, that is, drugs with similar side-effects similarity tends to cure similar diseases. Subfigure B: Barplot of the PCCs between structures, targets, side-effects similarity and disease profile similarity. All the p-values are smaller than 1e-2.
Figure 3
Figure 3. The performance of predictions are shown as ROC curves.
Subfigure A: The ROC curves for three data sources (“Chem”: chemical structure, “Inter”: target protein, “Side-effect”: side-effect based similarity and “Comb”: integration of “Chem”, “Inter”, and “Side-effect”). “Side-effect” is general more predictive for more experimentally observed drug-disease associations. Subfigure B shows the ROC curves with false positive rate (FPR) less than 0.05. “Chem” obtains the highest true positive rate (TPR) when FPR is very small.
Figure 4
Figure 4. Leave one drug out cross-validation.
Subfigure A: The procedure for leave one drug out cross-validation. Subfigure B: The AUCs obtained from leave one drug out cross-validation (“Chem”: chemical structure, “Inter”: target protein, “Side-effect”: side-effect, and “Comb”: integration of “Chem”, “Inter”, and “Side-effect”). It further shows that all three data sources can uncover new diseases for a novel drug, and integration works even better.
Figure 5
Figure 5. Comparison with previous method.
Subfigure A: An example for ‘indirect drug-disease association’. The candidate drug disease association is revealed utilizing the drug ‘Benztropine’ as a bridge to connect drug ‘Eletriptan’ and drug ‘Orphenadrine’. Subfigure B: The overlap of predictions by our method PreDR and previous method.
Figure 6
Figure 6. The predicted drug-disease network (only top 100 novel predictions are shown).
LightCoral rectangle represents drug and LightSteelBlue cycle represents disease. Pink solid line represents the known interaction and the DarkBlue dash line represents the new prediction.
Figure 7
Figure 7. The most confident prediction achieved by PreDR.
Disease ‘Colorectal Cancer; Crc’ is revealed because that the similar drug ‘Capecitabine’ which shares the same side-effect ‘erythema’, treats disease ‘Colorectal Cancer; Crc’.
Figure 8
Figure 8. Pathway ‘Arachidonic Acid metabolism’.
Drug target proteins and disease genes are highlighted by orange border.

References

    1. DiMasi JA, Hansen RW, Grabowski HG (2003) The price of innovation: new estimates of drug development costs. J Health Econ 22: 151–185. - PubMed
    1. Kinnings SL, Liu N, Buchmeier N, Tonge PJ, Xie L, et al. (2009) Drug discovery using chemical systems biology: repositioning the safe medicine Comtan to treat multi-drug and extensively drug resistant tuberculosis. PLoS Comput Biol 5: e1000423. - PMC - PubMed
    1. Li J, Zhu X, Chen JY (2009) Building disease-specific drug-protein connectivity maps from molecular interaction networks and PubMed abstracts. PLoS Comput Biol 5: e1000450. - PMC - PubMed
    1. Kotelnikova E, Yuryev A, Mazo I, Daraselia N (2010) Computational approaches for drug repositioning and combination therapy design. J Bioinform Comput Biol 8: 593–606. - PubMed
    1. Hu G, Agarwal P (2009) Human disease-drug network based on genomic expression profiles. PLoS One 4: e6536. - PMC - PubMed

Publication types