

Physical factors influencing pleasant touch during tactile exploration
- PMID: 24244425
- PMCID: PMC3828339
- DOI: 10.1371/journal.pone.0079085
Physical factors influencing pleasant touch during tactile exploration
Abstract
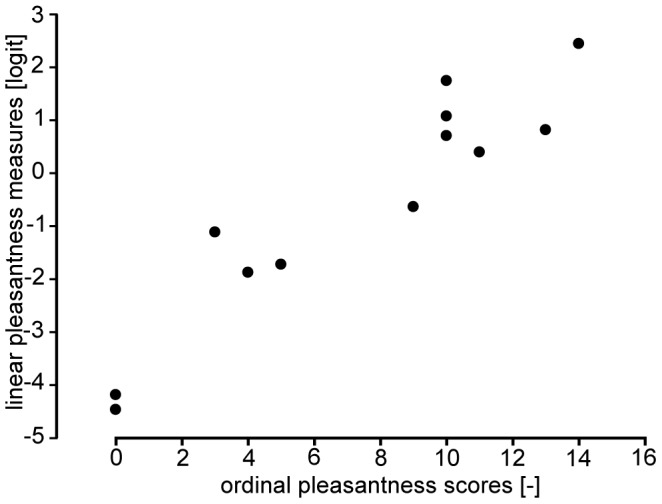
Background: When scanning surfaces, humans perceive some of their physical attributes. These percepts are frequently accompanied by a sensation of (un)pleasantness. We therefore hypothesized that aspects of the mechanical activity induced by scanning surfaces with fingertips could be objectively associated with a pleasantness sensation. Previously, we developed a unidimensional measure of pleasantness, the Pleasant Touch Scale, quantifying the pleasantness level of 37 different materials. Findings of this study suggested that the sensation of pleasantness was influenced by the average magnitude of the frictional forces brought about by sliding the finger on the surface, and by the surface topography. In the present study, we correlated (i) characteristics of the fluctuations of frictional forces resulting from the interaction between the finger and the surface asperities as well as (ii) the average friction with the sensation of pleasantness.
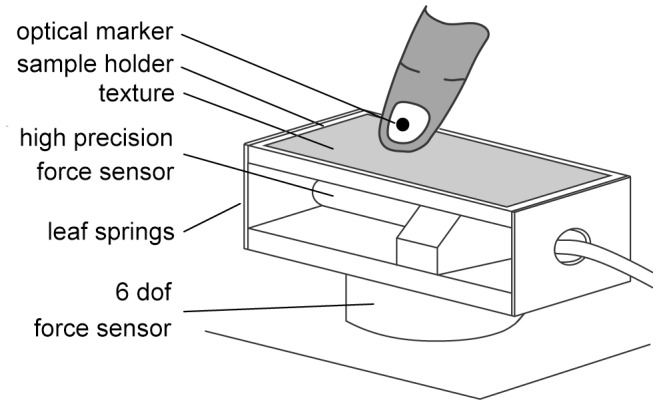
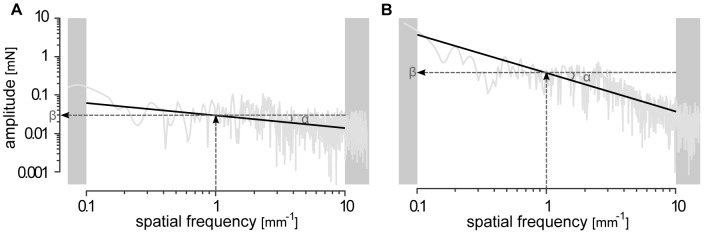
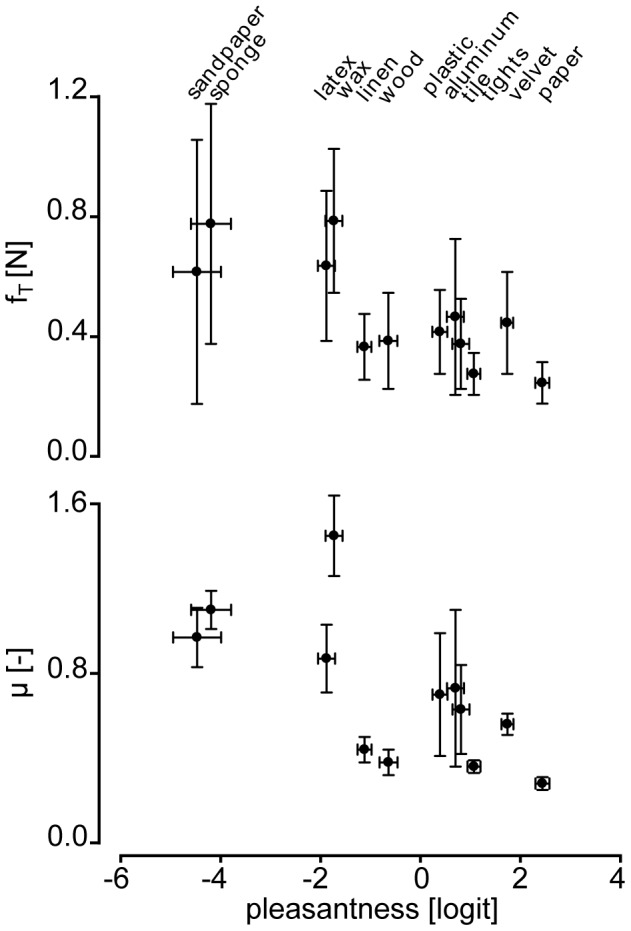
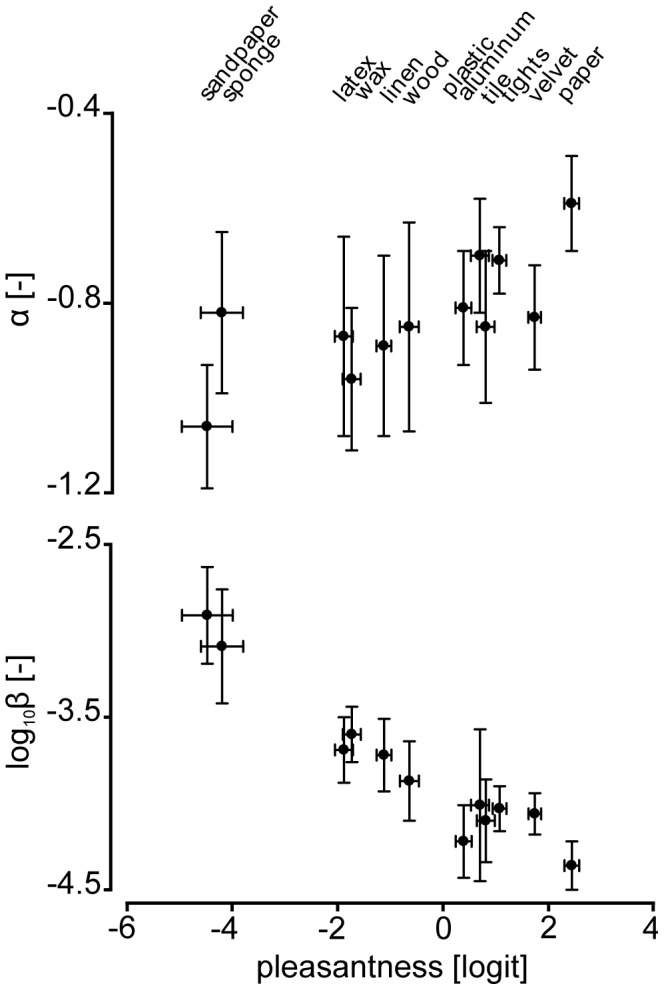
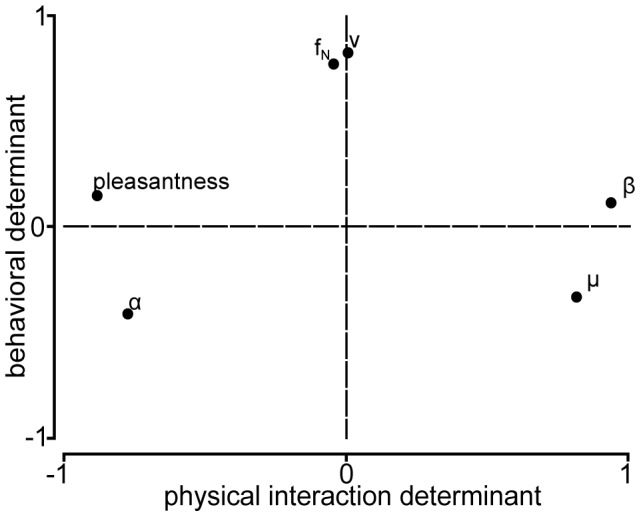
Results: Eight blindfolded participants tactually explored twelve materials of the Pleasant Touch Scale through lateral sliding movements of their index fingertip. During exploration, the normal and tangential interaction force components, fN and fT , as well as the fingertip trajectory were measured. The effect of the frictional force on pleasantness sensation was investigated through the analysis of the ratio fT to fN , i.e. the net coefficient of kinetic friction, μ. The influence of the surface topographies was investigated through analysis of rapid fT fluctuations in the spatial frequency domain. Results showed that high values of μ were anticorrelated with pleasantness. Furthermore, surfaces associated with fluctuations of fT having higher amplitudes in the low frequency range than in the high one were judged to be less pleasant than the surfaces yielding evenly distributed amplitudes throughout the whole spatial frequency domain.
Conclusion: Characteristics of the frictional force fluctuations and of the net friction taking place during scanning can reliably be correlated with the pleasantness sensation of surfaces.
Conflict of interest statement
Figures
References
-
- Hollins M, Bensmaia SJ (2007) The coding of roughness. Can J Exp Psychol 61: 184–195. - PubMed
-
- Scheibert J, Leurent S, Prevost A, Debregeas G (2009) The role of fingerprints in the coding of tactile information probed with a biomimetic sensor. Science 323: 1503–1506. - PubMed
-
- Wiertlewski M, Lozada J, Hayward V (2011) The spatial spectrum of tangential skin displacement can encode tactual texture. Transactions on Robotics 27: 461–472.
Publication types
MeSH terms
LinkOut - more resources
Full Text Sources
Other Literature Sources
Research Materials
Miscellaneous
