. 2013 Nov 14;8(11):e79262.
doi: 10.1371/journal.pone.0079262. eCollection 2013.

Molecular characterization of a human matrix attachment region epigenetic regulator

Affiliations

Molecular characterization of a human matrix attachment region epigenetic regulator

Salina Arope et al. PLoS One. .

Abstract

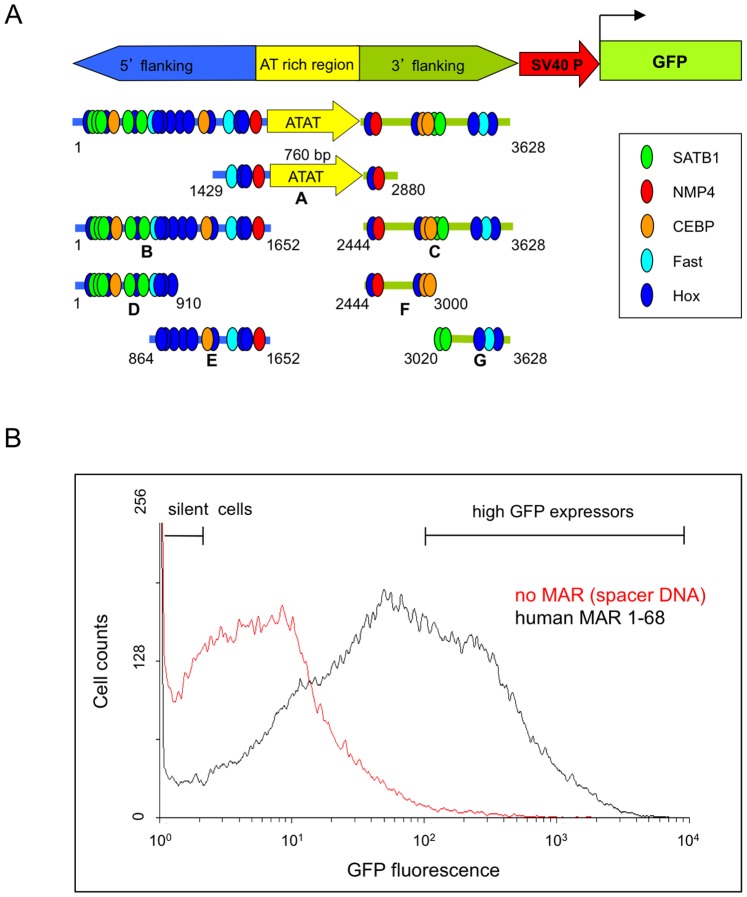
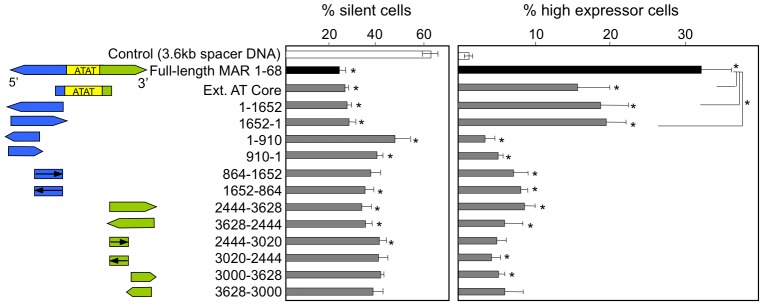
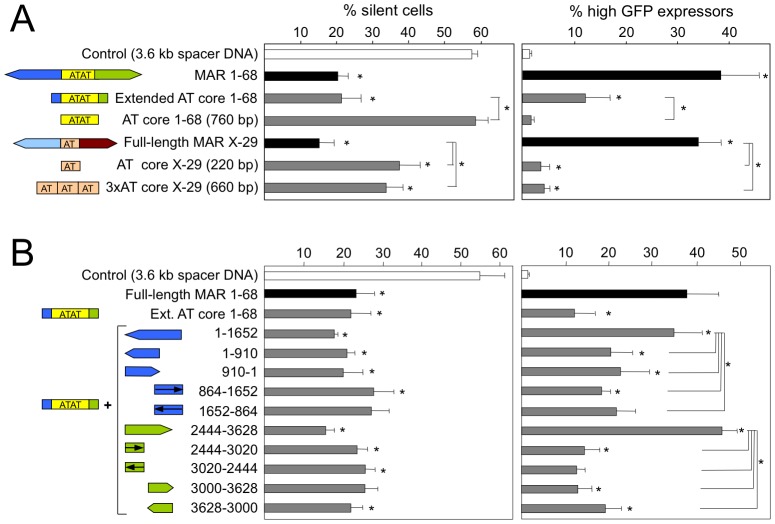
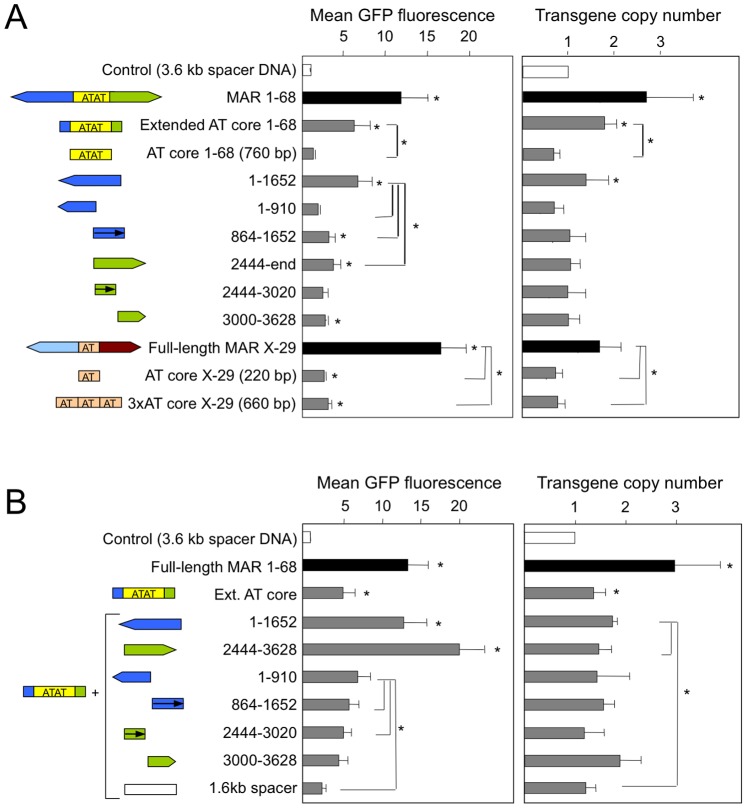
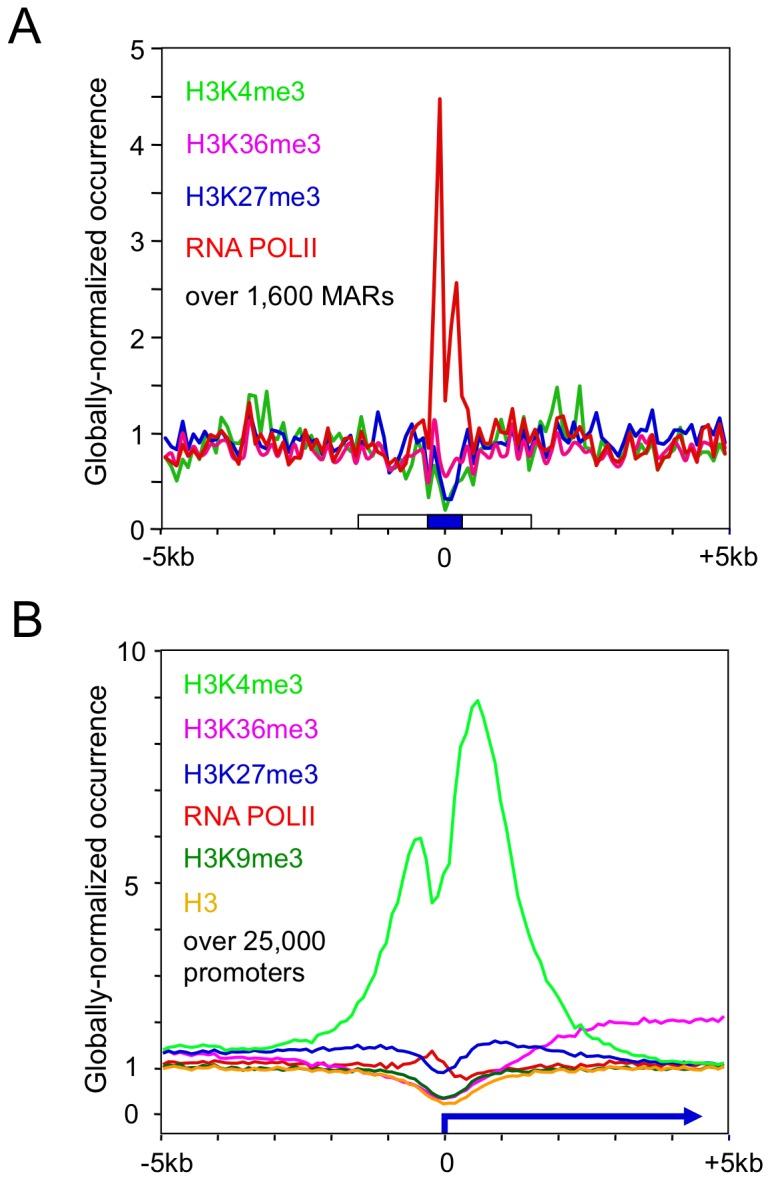
Matrix attachment regions (MAR) generally act as epigenetic regulatory sequences that increase gene expression, and they were proposed to partition chromosomes into loop-forming domains. However, their molecular mode of action remains poorly understood. Here, we assessed the possible contribution of the AT-rich core and adjacent transcription factor binding motifs to the transcription augmenting and anti-silencing effects of human MAR 1-68. Either flanking sequences together with the AT-rich core were required to obtain the full MAR effects. Shortened MAR derivatives retaining full MAR activity were constructed from combinations of the AT-rich sequence and multimerized transcription factor binding motifs, implying that both transcription factors and the AT-rich microsatellite sequence are required to mediate the MAR effect. Genomic analysis indicated that MAR AT-rich cores may be depleted of histones and enriched in RNA polymerase II, providing a molecular interpretation of their chromatin domain insulator and transcriptional augmentation activities.


Conflict of interest statement

Competing Interests: The authors have the following interests: NM is a co-founder and owns shares of Selexis SA, a company that uses proprietary technology to generate therapeutic-producing CHO cell lines. Selexis SA co-funded this study. This does not alter the authors adherence to all the PLOS ONE policies on sharing data and materials.

Figures

Figure 1
Figure 1. Schematic representation of MAR 1–68 subdomains and illustration of its anti-silencing and transcriptional effects.
(A) Schematic diagram representing the full-length human MAR 1–68 and its series of sub-fragments, cloned upstream of a minimal SV40 promoter and EGFP reporter gene. The 3.6 kb MAR 1–68 was subdivided into three regions: The MAR 1–68 “extended AT core” region encompassing the AT dinucleotide-rich sequence (yellow box, labelled A), its 5′ (blue, labelled B) and 3′ (green, labelled C) adjacent regions. Putative transcription factor binding sites for the SATB1, NMP4, CEBP, Fast and Hox transcription factors are illustrated by ellipses. The 5′ and 3′ flanking regions were further divided in portions comprising nt 1–910 (labelled D), nt 864–1652 (E), nt 2444–3000 (F) and nt 3020–3628 (G). (B) A typical flow cytometry profile of CHO DG44 cells stably co-transfected with the GFP expression vector containing full-length human MAR 1–68 (black line) or control spacer DNA (no MAR, red line) and with a neomycin resistance plasmid. 105 cells were subjected to flow cytometry analysis for GFP expression after 2 weeks of nemomycin selection. Cells displaying background fluorescence (silent cells) or high GFP expression levels are as indicated.
Figure 2
Figure 2. Identification of the portions of MAR 1–68 that contribute to the anti-silencing and transcriptional effects.
The AT core extended region of the MAR 1–68, as well as a series of sub-fragments of the 5′ and 3′ flanking regions, were cloned upstream of the EGFP reporter gene in both orientation and analyzed for their effects on GFP expression levels. Constructs containing the full-length MAR 1–68 or a control spacer DNA cloned upstream of the EGFP reporter gene were also transfected as controls. GFP fluorescence was measured by flow-cytometry on polyclonal cell pools obtained after 2 weeks of antibiotic selection following transfection, and the proportion of silent and of high expressor cells were scored as illustrated in Fig. 1B. Results illustrate the mean and standard deviation of 3 independent experiments. Significant differences relative to the corresponding control construct containing spacer DNA of the same size, as illustrated in Suppl. Fig. S3, are indicated by stars above each bar, whereas line-associated stars indicate significant differences with constructs containing the full length MAR 1–68 or its extended core (Student test, P<0.05).
Figure 3
Figure 3. Relative contribution of MAR AT-rich cores and flanking sequences to the anti-silencing and transcriptional effects.
The contribution of the AT rich DNA sequences of MAR 1–68 and X-29 alone (A), or combinations of the MAR 1–68 core with portions of its flanking sequences (B), were assessed for their anti-silencing and transcriptional augmentation activities as described in the legend to Fig. 2. An oligomeric form of the X-29 AT-rich region, consisting of three tandem repeats, was also analyzed. Results represent the mean±SD of 3 independent experiments and the statistical analysis are as for Fig. 2.
Figure 4
Figure 4. Effect of human MAR 1–68 and X-29 and derivatives on GFP expression and transgene copy number.
(A) The mean GFP fluorescence and transgene copy numbers were determined from polyclonal cell pools generated using the illustrated constructs as described in the legend to Fig. 2. The relative GFP transgene copy number was determined by quantitative PCR using total genomic DNA isolated from transfected cell pools, and values were normalized to those of the GAPDH cellular gene. GFP expression levels and transgene copy numbers are expressed as the fold change relative to those obtained from control cells transfected with construct containing 3.6 kb of spacer DNA instead of the MAR, which was set to 1. Results represent the mean±SD of 3 independent experiments. Significant differences relative to the corresponding control construct containing spacer DNA of the same size, as illustrated in Suppl. Fig. S5, are indicated by stars above each bar, whereas line-associated stars indicate significant differences between the indicated constructs (Student test, P<0.05).
Figure 5
Figure 5. Association of human MARs with a specific chromatin pattern.
A) 1683 predicted human MAR genomic locations were aligned using the central positions of their AT rich cores. ChiP-Seq profiles were calculated over the MAR collection for the histone modifications H3K4me3, H3K27me3, H3K36me3 and for RNA Polymerase II. (B) 25000 RefSeq promoters were aligned at their respective TSS positions and oriented according to the direction of transcription. ChiP-Seq profiles were calculated over the promoter collection for indicated histone modification, and for the RNA Pol II. Tag counts were normalized globally and they are expressed as a fold change over the non-precipitated input DNA profile.

References

    1. Heng HH, Goetze S, Ye CJ, Liu G, Stevens JB, et al. (2004) Chromatin loops are selectively anchored using scaffold/matrix-attachment regions. J Cell Sci 117: 999–1008. - PubMed
    1. Linnemann AK, Krawetz SA (2009) Silencing by nuclear matrix attachment distinguishes cell-type specificity: association with increased proliferation capacity. Nucleic Acids Res 37: 2779–2788. - PMC - PubMed
    1. Linnemann AK, Platts AE, Krawetz SA (2009) Differential nuclear scaffold/matrix attachment marks expressed genes. Hum Mol Genet 18: 645–654. - PMC - PubMed
    1. Dixon JR, Selvaraj S, Yue F, Kim A, Li Y, et al. (2012) Topological domains in mammalian genomes identified by analysis of chromatin interactions. Nature 485: 376–380. - PMC - PubMed
    1. Felsenfeld G, Burgess-Beusse B, Farrell C, Gaszner M, Ghirlando R, et al. (2004) Chromatin boundaries and chromatin domains. Cold Spring Harb Symp Quant Biol 69: 245–250. - PubMed

Publication types