

The effect of temperature on Anopheles mosquito population dynamics and the potential for malaria transmission
- PMID: 24244467
- PMCID: PMC3828393
- DOI: 10.1371/journal.pone.0079276
The effect of temperature on Anopheles mosquito population dynamics and the potential for malaria transmission
Abstract
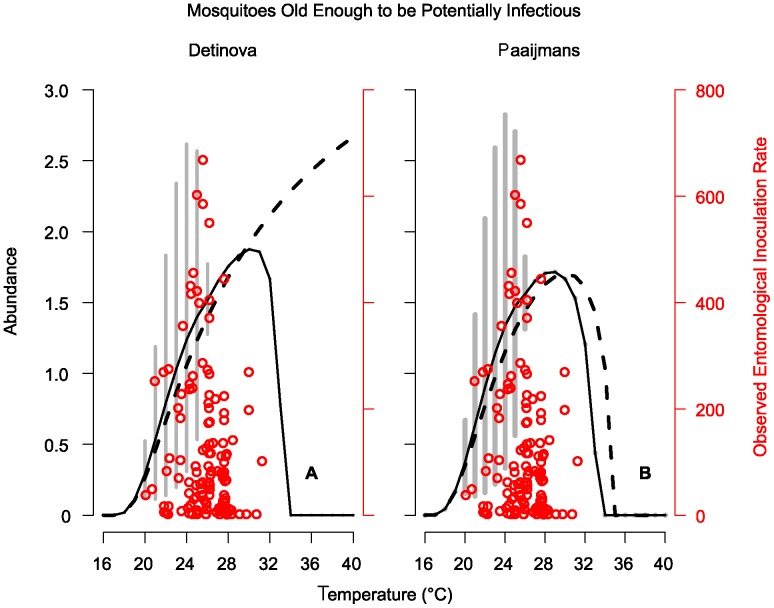
The parasites that cause malaria depend on Anopheles mosquitoes for transmission; because of this, mosquito population dynamics are a key determinant of malaria risk. Development and survival rates of both the Anopheles mosquitoes and the Plasmodium parasites that cause malaria depend on temperature, making this a potential driver of mosquito population dynamics and malaria transmission. We developed a temperature-dependent, stage-structured delayed differential equation model to better understand how climate determines risk. Including the full mosquito life cycle in the model reveals that the mosquito population abundance is more sensitive to temperature than previously thought because it is strongly influenced by the dynamics of the juvenile mosquito stages whose vital rates are also temperature-dependent. Additionally, the model predicts a peak in abundance of mosquitoes old enough to vector malaria at more accurate temperatures than previous models. Our results point to the importance of incorporating detailed vector biology into models for predicting the risk for vector borne diseases.
Conflict of interest statement
Figures
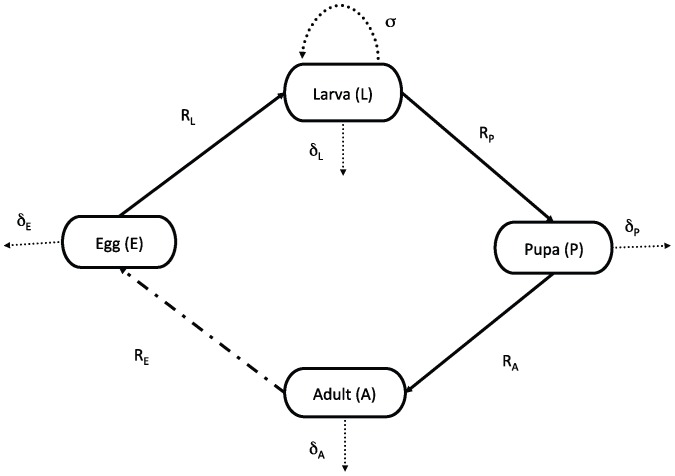
 (
( or
or  ). Recruitment into a stage
  at time
  is given by
  and is also dependent on temperature. Density-dependent mortality is only experienced in the larval stage,
  .
.
References
-
- Centers for Disease Control and Prevention (CDC) (2012). Malaria facts. Available: 416 http://www.cdc.gov/malaria/about/facts.html. Accessed 2013 October 11.
-
- Craig MH, Snow RW, le Sueur D (1999) A climate-based distribution model of malaria transmission in sub-Saharan Africa. Parasitol Today 15: 105–111. - PubMed
Publication types
MeSH terms
LinkOut - more resources
Full Text Sources
Other Literature Sources
Medical
