. 2013 Nov 11;8(11):e79425.
doi: 10.1371/journal.pone.0079425. eCollection 2013.

Comparative genome analysis between Agrostis stolonifera and members of the Pooideae subfamily, including Brachypodium distachyon

Affiliations

Comparative genome analysis between Agrostis stolonifera and members of the Pooideae subfamily, including Brachypodium distachyon

Loreto Araneda et al. PLoS One. .

Abstract

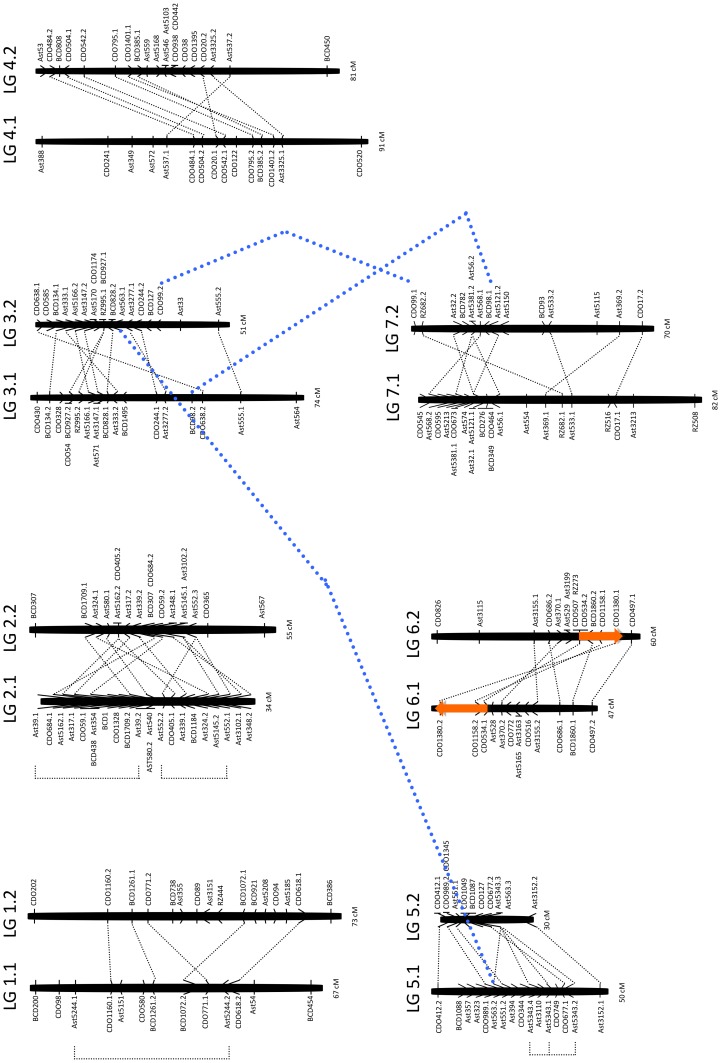
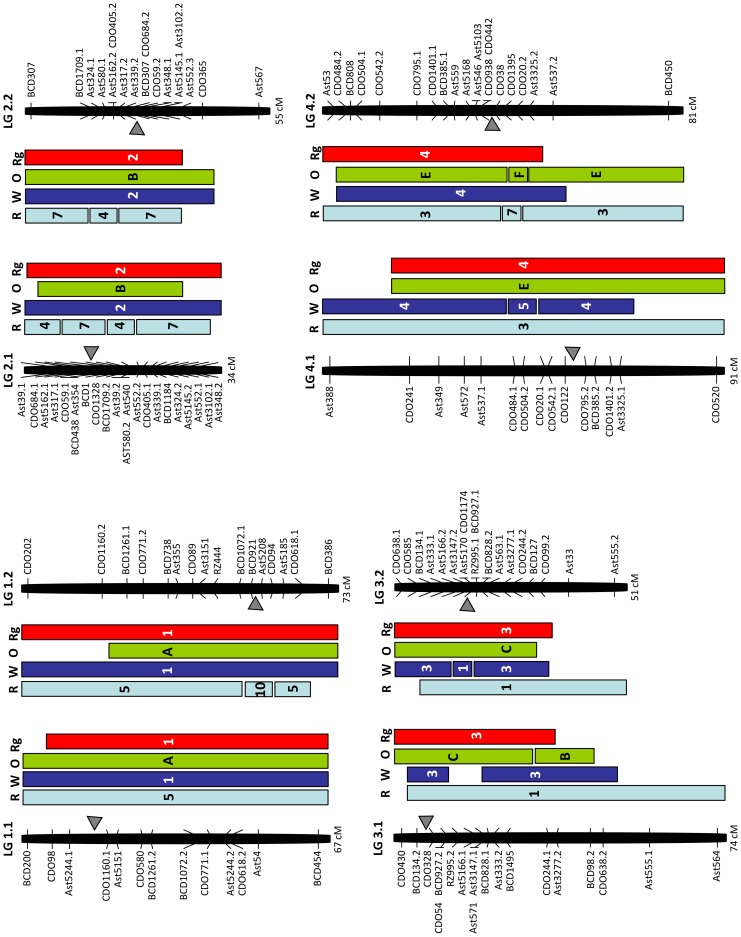
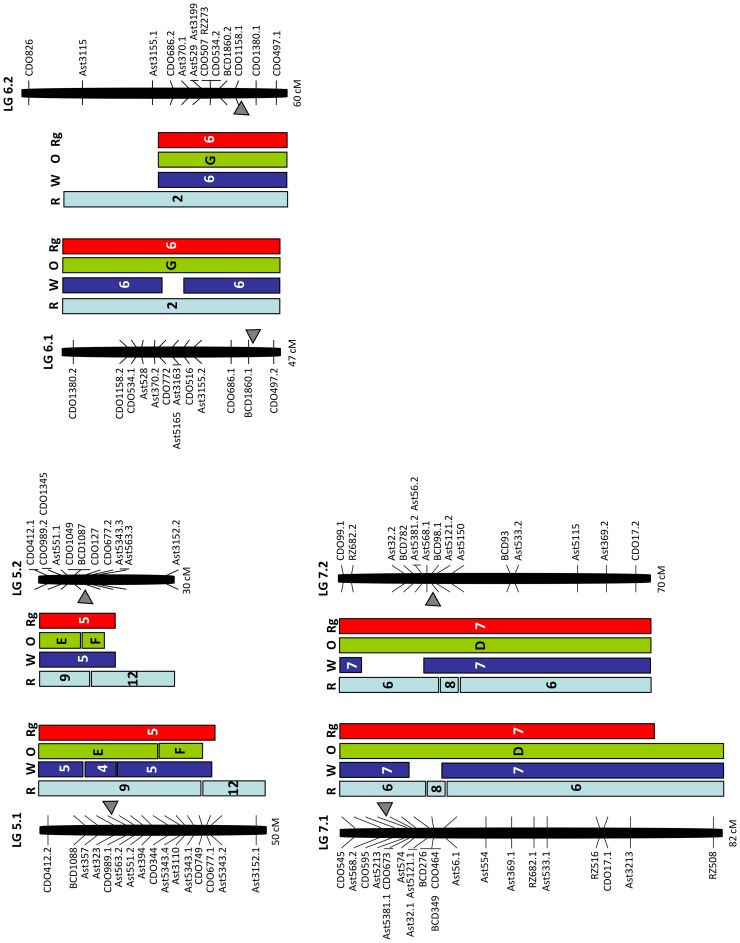
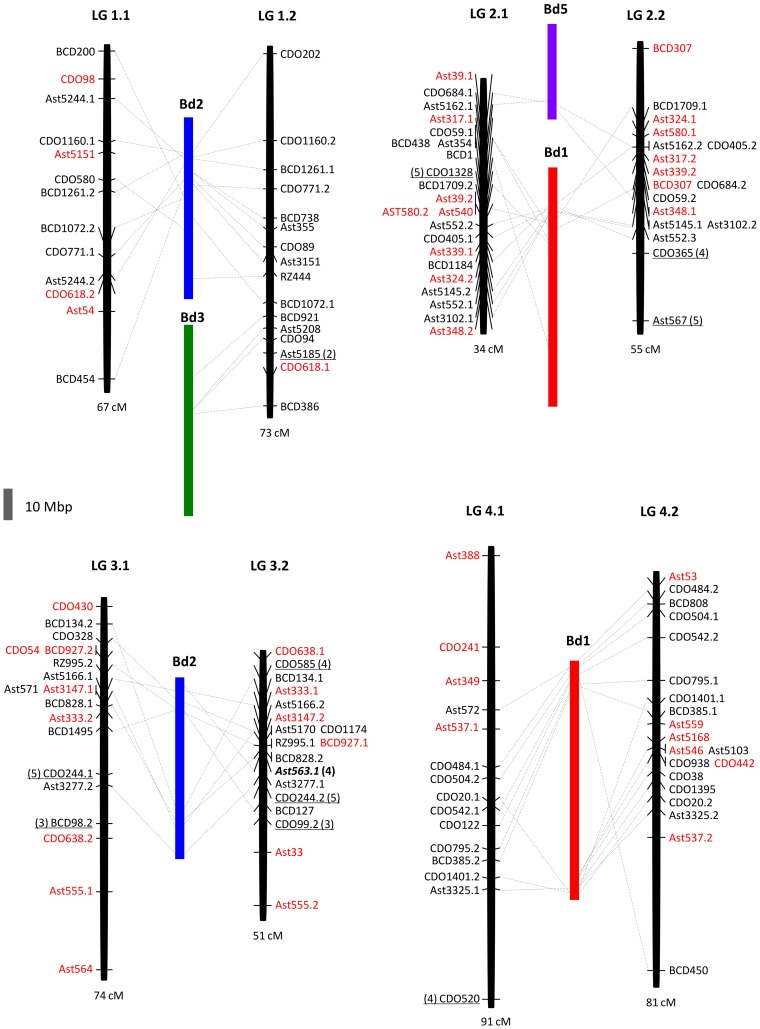
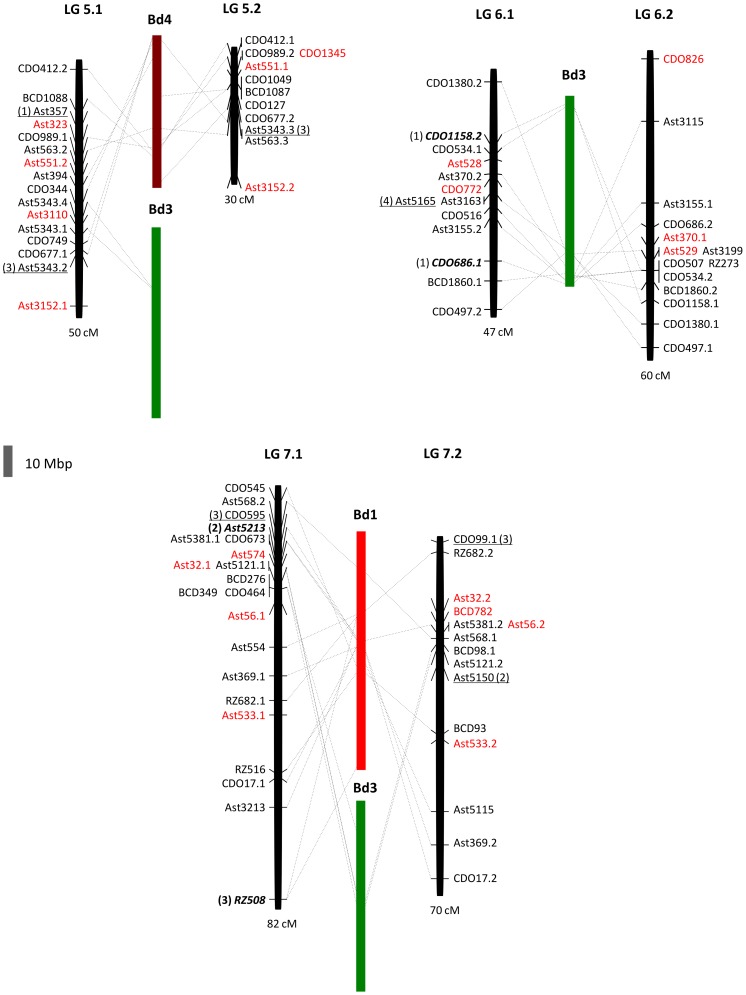
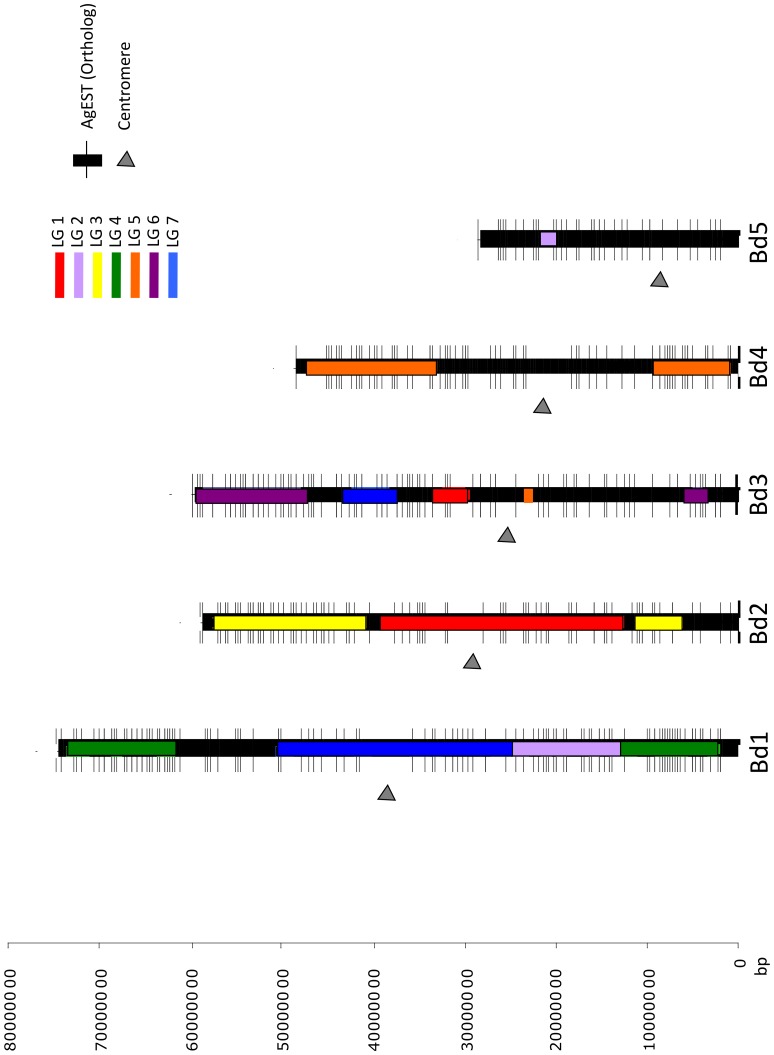
Creeping bentgrass (Agrostis stolonifera, allotetraploid 2n = 4x = 28) is one of the major cool-season turfgrasses. It is widely used on golf courses due to its tolerance to low mowing and aggressive growth habit. In this study, we investigated genome relationships of creeping bentgrass relative to the Triticeae (a consensus map of Triticum aestivum, T. tauschii, Hordeum vulgare, and H. spontaneum), oat, rice, and ryegrass maps using a common set of 229 EST-RFLP markers. The genome comparisons based on the RFLP markers revealed large-scale chromosomal rearrangements on different numbers of linkage groups (LGs) of creeping bentgrass relative to the Triticeae (3 LGs), oat (4 LGs), and rice (8 LGs). However, we detected no chromosomal rearrangement between creeping bentgrass and ryegrass, suggesting that these recently domesticated species might be closely related, despite their memberships to different Pooideae tribes. In addition, the genome of creeping bentgrass was compared with the complete genome sequence of Brachypodium distachyon in Pooideae subfamily using both sequences of the above-mentioned mapped EST-RFLP markers and sequences of 8,470 publicly available A. stolonifera ESTs (AgEST). We discovered large-scale chromosomal rearrangements on six LGs of creeping bentgrass relative to B. distachyon. Also, a total of 24 syntenic blocks based on 678 orthologus loci were identified between these two grass species. The EST orthologs can be utilized in further comparative mapping of Pooideae species. These results will be useful for genetic improvement of Agrostis species and will provide a better understanding of evolution within Pooideae species.


Conflict of interest statement

Competing Interests: NC and JC have competing interests as members of Syngenta Seeds, which is a commercial company. This does not alter the authors' adherence to all the PLOS ONE policies on sharing data and materials. There are no further products in development or marketed products or patents to declare.

Figures

Figure 1
Figure 1. EST-RFLP genetic linkage map of creeping bentgrass.
Two different creeping bentgrass diploid genomes are indicated by seven pairs of the homoeologous linkage groups (LGs) followed by “.1” or “.2”. The total map length in cM is shown on the bottom of each LG. The creeping bentgrass, barley, oat and rice cDNA probes used as RFLP markers are indicated as Ast, BCD, CDO and RZ, respectively followed by the probe number. The probe numbers plus ‘.1’, ‘.2’, ‘.3’ or ‘.4’ show duplicate loci detected by the same hybridization probe, which are connected by a dashed black line. Loci connected by a dashed bold blue line are detected between different LGs by the same hybridization probe. The segment on LGs 6.1 and 6.2, spanning three RFLP markers (CDO1380, CDO1158 and CDO534) superimposed by an orange arrow indicates an inversion and translocation between the two homoeologous LGs.
Figure 2
Figure 2. Comparative genome relationships on creeping bentgrass linkage groups 1–4 relative to rice, the Triticeae, oat, and ryegrass.
Comparative genome relationships between creeping bentgrass genetic linkage map and the genetic maps of rice (R), the Triticeae (W), oat (O), and ryegrass (Rg), respectively, represented by a colored box. The markers shown on the right or left side of each linkage group correspond to those mapped in the creeping bentgrass linkage map shown in Figure 1. The number or letter inside the color boxes represents the segments of chromosomes or linkage groups from each of the genomes (R, W, O, Rg) that are syntenic to the bentgrass linkage groups. The arrowheads indicate the deduced location of the centromere in bentgrass from the comparisons with Triticeae chromosomes. The total map distances (cM) are shown on the bottom of each linkage group.
Figure 3
Figure 3. Comparative genome relationships on creeping bentgrass linkage groups 5–7 relative to rice, the Triticeae, oat, and ryegrass.
Comparative genome relationships between creeping bentgrass genetic linkage map and the genetic maps of rice (R), the Triticeae (W), oat (O), and ryegrass (Rg), respectively, represented by a colored box. The markers shown on the right or left side of each linkage group correspond to those mapped in the creeping bentgrass linkage map shown in Figure 1. The number or letter inside the color boxes represents the segments of chromosomes or linkage groups from each of the genomes (R, W, O, Rg) that are syntenic to the bentgrass linkage groups. The arrowheads indicate the deduced location of the centromere in bentgrass from the comparisons with Triticeae chromosomes. The total map distances (cM) are shown on the bottom of each linkage group.
Figure 4
Figure 4. Comparative genome relationship on creeping bentgrass linkage groups 1–4 relative to Brachypodium distachyon.
Comparative genome relationship between creeping bentgrass genetic linkage map and chromosomes of B. distachyon by determining the chromosomal location of sequences of the EST-RFLP markers mapped on the creeping bentgrass linkage map. The black bar represents each of the bentgrass linkage groups (total length in cM, below the bar) as shown in Figure 1. The colored bars represent each of B. distachyon chromosomes (Bd). The collinearity is represented by a dashed black line that links the RFLP markers with the highly similar sequences located in B. distachyon chromosomes. Markers in red have no significant sequences similarity with B. distachyon genome. Underlined markers have significant sequences similarity with B. distachyon chromosomes indicated in parenthesis. Markers in bold and italics are duplicated between B. distachyon chromosomes indicated in parenthesis. The grey scale bar on the left bottom of the Figure is 10 Mbp of B. distachyon genome.
Figure 5
Figure 5. Comparative genome relationship on creeping bentgrass linkage groups 5–7 relative to Brachypodium distachyon.
Comparative genome relationship between creeping bentgrass genetic linkage map and chromosomes of B. distachyon by determining the chromosomal location of sequences of the EST-RFLP markers mapped on the creeping bentgrass linkage map. The black bar represents each of the bentgrass linkage groups (total length in cM, below the bar) as shown in Figure 1. The colored bars represent each of B. distachyon chromosomes (Bd). The collinearity is represented by a dashed black line that links the RFLP markers with the highly similar sequences located in B. distachyon chromosomes. Markers in red have no significant sequences similarity with B. distachyon genome. Underlined markers have significant sequences similarity with B. distachyon chromosomes indicated in parenthesis. Markers in bold and italics are duplicated between B. distachyon chromosomes indicated in parenthesis. The grey scale bar on the left bottom of the Figure is 10 Mbp of B. distachyon genome.
Figure 6
Figure 6. Creeping bentgrass ESTs orthologous to Brachypodium distachyon.
Creeping bentgrass ESTs (AgEST) orthologous to B. distachyon genome and their location in the physical map of B. distachyon (in base pairs). Bd1, Bd2, Bd3, Bd4 and Bd5 represent the B. distachyon chromosomes (1 to 5) and horizontal lines denote the position of the 678 AgEST orthologs. The segments of a seven-color code (LGs 1–7) indicate the creeping bentgrass linkage groups that have synteny with a specific region of B. distachyon chromosomes. The arrowheads indicate the centromeric region.

Similar articles

Cited by

References

    1. Tang H, Bowers JE, Wang X, Ming R, Alam M, et al. (2008) Synteny and collinearity in plant genomes. Science 320: 486–488. - PubMed
    1. Renvoize SA, Clayton WD (1992) Classification and evolution of the grasses. In G.P. Chapman [ed.]), 3–37. Grass evolution and domestication. Cambridge University Press, Cambridge, UK.
    1. Watson L, Dallwitz MJ (1992) The grass genera of the world. pp1038 CAB International, Wallingford.
    1. Ma J, Bennetzen JL (2004) Rapid recent growth and divergence of rice nuclear genomes. Proc Natl Acad Sci USA 101: 12404–12410. - PMC - PubMed
    1. Draper J, Mur LAJ, Jenkins G, Ghosh-Biswas GC, Bablak P, et al. (2001) Brachypodium distachyon. A new model system for functional genomics in grasses. Plant Physiol 127: 1539–1555. - PMC - PubMed

Publication types