. 2013 Nov 14;8(11):e79482.
doi: 10.1371/journal.pone.0079482. eCollection 2013.

Structural features of the regulatory ACT domain of phenylalanine hydroxylase

Affiliations

Structural features of the regulatory ACT domain of phenylalanine hydroxylase

Carla Carluccio et al. PLoS One. .

Abstract

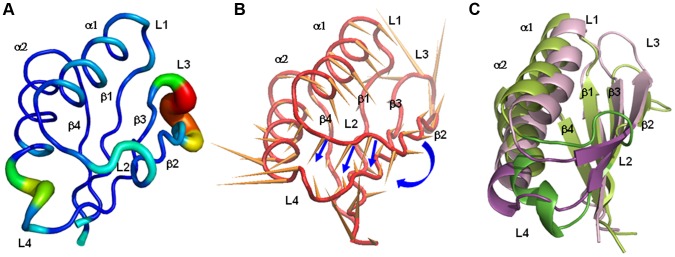
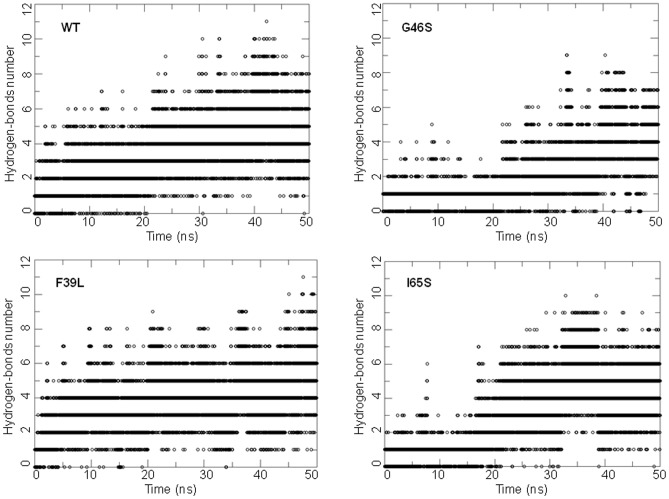
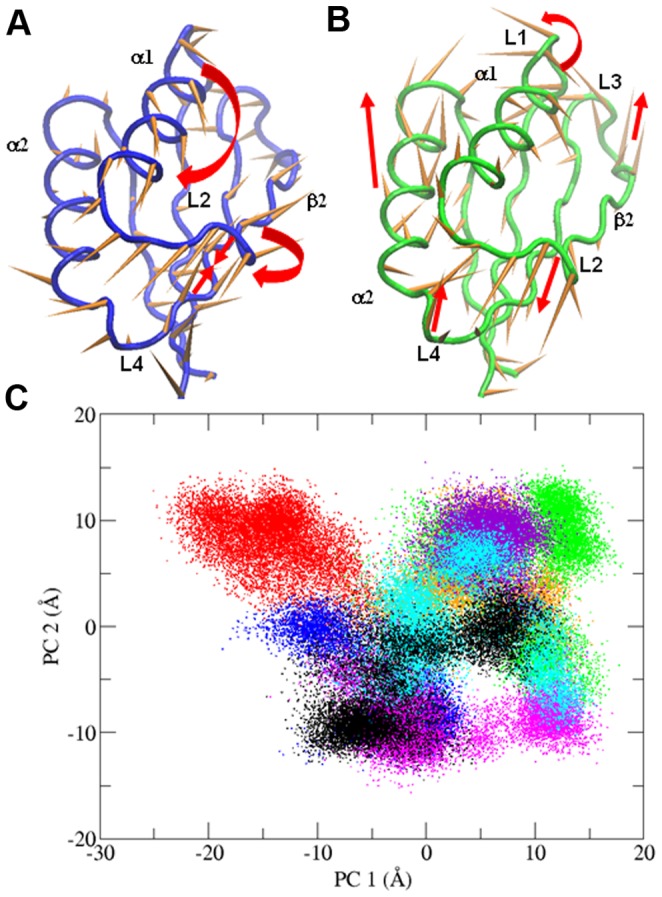
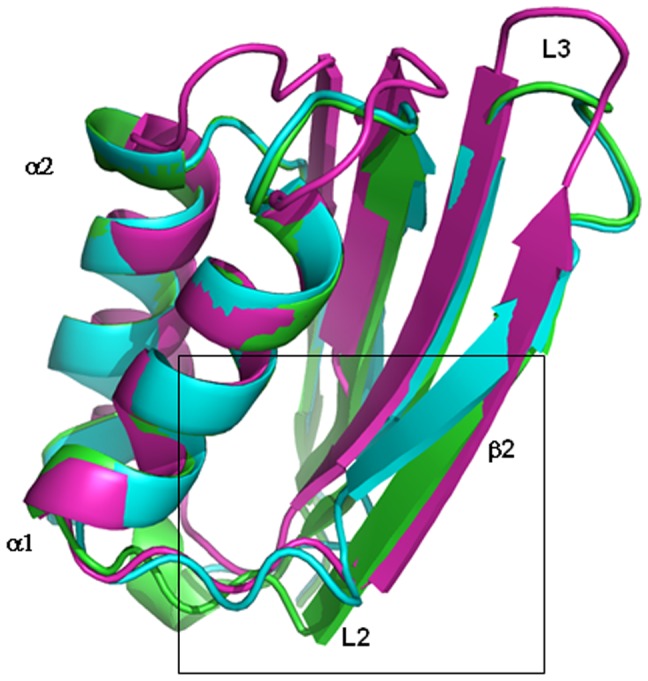
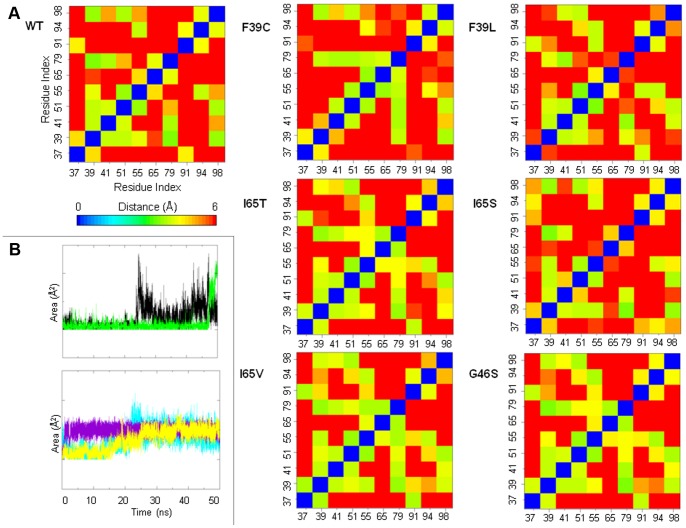
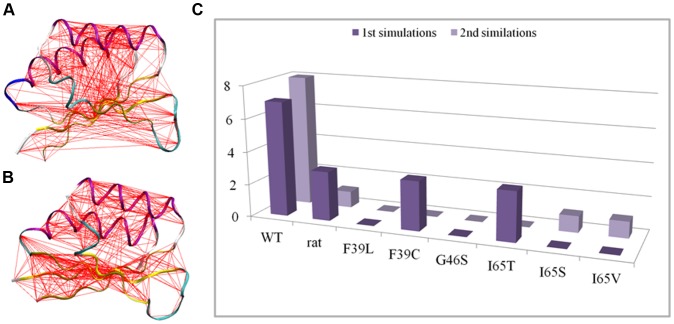
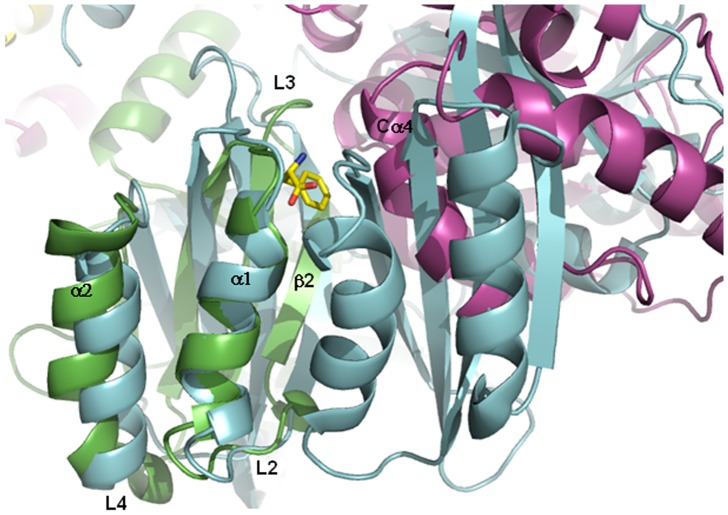
Phenylalanine hydroxylase (PAH) catalyzes the conversion of L-Phe to L-Tyr. Defects in PAH activity, caused by mutations in the human gene, result in the autosomal recessively inherited disease hyperphenylalaninemia. PAH activity is regulated by multiple factors, including phosphorylation and ligand binding. In particular, PAH displays positive cooperativity for L-Phe, which is proposed to bind the enzyme on an allosteric site in the N-terminal regulatory domain (RD), also classified as an ACT domain. This domain is found in several proteins and is able to bind amino acids. We used molecular dynamics simulations to obtain dynamical and structural insights into the isolated RD of PAH. Here we show that the principal motions involve conformational changes leading from an initial open to a final closed domain structure. The global intrinsic motions of the RD are correlated with exposure to solvent of a hydrophobic surface, which corresponds to the ligand binding-site of the ACT domain. Our results strongly suggest a relationship between the Phe-binding function and the overall dynamic behaviour of the enzyme. This relationship may be affected by structure-disturbing mutations. To elucidate the functional implications of the mutations, we investigated the structural effects on the dynamics of the human RD PAH induced by six missense hyperphenylalaninemia-causing mutations, namely p.G46S, p.F39C, p.F39L, p.I65S, p.I65T and p.I65V. These studies showed that the alterations in RD hydrophobic interactions induced by missense mutations could affect the functionality of the whole enzyme.


Conflict of interest statement

Competing Interests: The authors have declared that no competing interests exist.

Figures

Figure 1
Figure 1. Structure representation of the human PAH subunit and its RD.
A) Structural model of a full-length PAH subunit created by superimposing the catalytic domains of the dimeric rat crystal structure (1PHZ), which includes the RD (19–117), and of the tetrameric human crystal structure (2PAH), which includes the catalytic/tetramerization domain. RD is drawn in magenta, the catalytic domain in yellow and the tetramerization domain in blue. The iron is shown as a red sphere. B) Starting models of the ACT domain (33–111 residues) of wt-hPAH with the residues G46, F39 and I65 drawn as a yellow stick. In light magenta are the two highly conserved GAL and IERSP motifs. The mobile loop-containing regions L1 to L4 are drawn in different colors. C) Primary and secondary structure of the human RD represented in B. Loop-containing regions L1 to L4 are boxed in red.
Figure 2
Figure 2. Mobility and conformational change of loop-containing regions.
A) Sausage representation of the wt-PAH initial structure, in which the thickness of the sausage is proportional to the root mean square fluctuation of Cα atoms from their average positions. Average positions are calculated after least-squares fit superimposition of the trajectory structures onto the starting structure used as reference. B) Porcupine representation of the first PC (accounting for 78% of the overall fluctuation of Cα atoms) extracted from the simulation of the wt-hPAH. The orange cones, attached to the average positions of each Cα atom, point in the direction of motion described by PC1. Blue arrows highlight the motion corresponding to the transition of L2 to β-strand. C) Initial (light green) and final (light pink) wt-hPAH structures with the L2 and L4 regions drawn in green and magenta.
Figure 3
Figure 3. Time-evolution of H-bond number.
The panels show the number of H-bonds between the L2 and the L4 region residues (backbone and side chains atoms) versus time in the wt-hPAH and in the G46S, F39L, I65S mutants respectively. H-bonds were determined using a cut-off of 30 degrees on the Acceptor-Donor-Hydrogen angle and of 3.5 Å on the Acceptor-Donor distance.
Figure 4
Figure 4. Combined essential dynamics analysis.
A) Porcupine plots illustrating the conformational changes represented by the first and B) the second PCs from the combined ED analysis. Each Cα atom has a cone pointing in the direction of conformational change described by each PC. C) Projections of each trajectory along PC1 and PC2 from the combined ED. Color code: wt-hPAH in black, wt-rPAH in red, G46S in orange, F39C in blue, F39L in green, I65T in violet, I65S in magenta, I65V in cyan.
Figure 5
Figure 5. Superimposition of the ACT domains.
Superimposition of the ACT domains of D-3-phosphoglycerate dehydrogenase from Escherichia coli (magenta), crystallographic wt-rPAH (cyan) and in silico model of wt-rPAH (green). The L2 region discussed in the article is boxed.
Figure 6
Figure 6. Analysis of the hydrophobic surface between helix α1 and the β2-strand.
A) Water distribution in the wt-hPAH. The protein surface atoms are colored from yellow to blue according to the increasing hydration score Shydatom. The local maxima of the water density map used for the calculation of the score (hydration sites) are represented as spheres, colored from yellow to blue according to the increasing density value. Hydrophobic atoms (yellow surface) have low hydration scores and are poor in hydration sites. B) The hydrophobic residues that belong to the hydrophobic surface between helix α1 and the strand β2 are shown as sticks in the wt-hPAH. C) Variation of the solvent accessible surface area (SASA) of the residues (backbone and side chains) at the hydrophobic surface between helix α1 and the β2-strand in the wt-hPAH (black) and in the mutants (G46S in orange, F39C in blue, F39L in green, I65T in violet, I65S in magenta, I65V in cyan). D) Relative contribution of the first 20 PCs in the maximally correlated motion to the variance of the hydrophobic surface SASA in wt-hPAH. E) Plot of the Pearson correlation coefficients between the trajectory projection on the MCM and the SASA of the hydrophobic surface (C), for all the systems and replicas. F) Plot of the maximum %var per PC for each system and replicas. The PC that has the largest relative contribution is indicated for each replica.
Figure 7
Figure 7. Average distances between selected residues of the hydrophobic core in the wt-hPAH.
A) Distance matrices calculated on selected residues (Leu37, Phe39, Leu41, Val51, Phe55, Ile65, Phe79, Leu91, Ile94, Leu98) of the hydrophobic core in the wt-hPAH. Average distances calculated over the first (0–5 ns) and B) the last (45–50 ns) 5 ns of simulation are reported. Distances between pairs of residues are calculated as the minimum over all possible pairs of non-hydrogen atoms of the side chain. C) Superimposition of the structure at 0 (green) and 50 (magenta) ns of wt-hPAH with the hydrophobic core residues shown as sticks. Selected residues are labelled.
Figure 8
Figure 8. Analyses on the side-chains of the hydrophobic core residues in the wt-hPAH and in the mutants.
A) Distances between pairs of selected hydrophobic core residues (Leu37, Phe39, Leu41, Val51, Phe55, Ile65, Phe79, Leu91, Ile94, Leu98) were calculated as the minimum over all possible pairs of non-hydrogen atoms of the side chain. Average values calculated over the 50-ns simulation are reported. B) Time evolution of the solvent accessible surface area (SASA) of Phe55 (black) and Val60 (green) in the F39C mutant (left, top). Time evolution of the SASA of the residue in position 65 in the I65S (yellow), I65T (violet) and I65V (cyan) mutants (left, bottom).
Figure 9
Figure 9. Correlation webs and number of links between helix and β-sheet residues.
A and B) Correlation webs of wt-hPAH (A) and I65S (B) generated with Dynatraj. Cα atom pairs with a dynamic correlation higher than 0.3 are connected with a line. C) Total number of links connecting helix to β-strand residues in the correlation webs. Values from both replicas in each simulated system are reported.
Figure 10
Figure 10. Superimposition of the Phe-bound prephenate dehydratase (PDT) and the tetrameric model of the hPAH.
The Phe-bound PDT from Chlorobium tepidum TLS (PDB code 2QMX) is drawn in cyan. The RD of a subunit of hPAH is drawn in green, whereas the catalytic domain of the adjacent subunit is drawn in violet. The bound Phe ligand is shown as a yellow stick.

References

    1. Kaufman S (1993) The phenylalanine hydroxylating system. Adv Enzymol 70: 77–264. - PubMed
    1. Hufton S, Jennings I, Cotton R (1995) Structure and function of the aromatic amino acid hydroxylases. Biochem J 311: 353–366. - PMC - PubMed
    1. Erlandsen H, Stevens RC (1999) The structural basis of phenylketonuria. Mol Genet Metab 68: 103–125. - PubMed
    1. Okano Y, Wang T, Eisensmith RC, Longhi R, Riva E, et al. (1991) Phenylketonuria missense mutations in the Mediterranean. Genomics 9: 96–103. - PubMed
    1. Svensson E, Iselius L, Hagenfeldt L (1994) Severity of mutation in the phenylalanine hydroxylase gene influences phenylalanine metabolism in phenylketonuria and hyperphenylalaninaemia heterozygotes. J Inherit Metab Dis 17: 215–222. - PubMed

Publication types

Substances

LinkOut - more resources