. 2013 Nov 14;8(11):e80541.
doi: 10.1371/journal.pone.0080541. eCollection 2013.

Alterations in ethanol-induced behaviors and consumption in knock-in mice expressing ethanol-resistant NMDA receptors

Affiliations

Alterations in ethanol-induced behaviors and consumption in knock-in mice expressing ethanol-resistant NMDA receptors

Carolina R den Hartog et al. PLoS One. .

Abstract

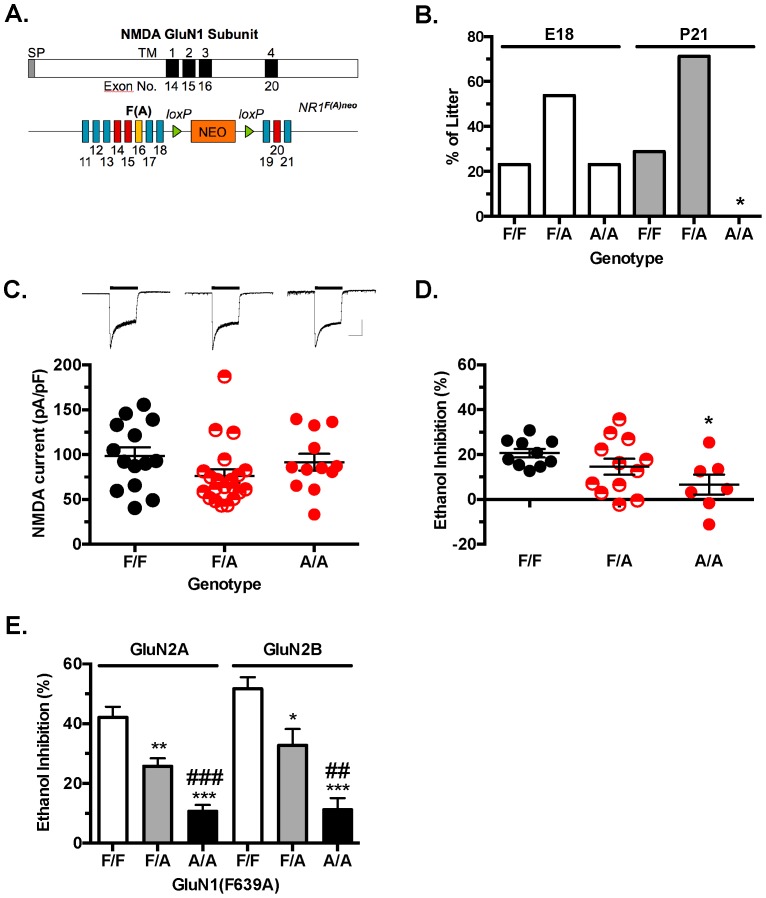
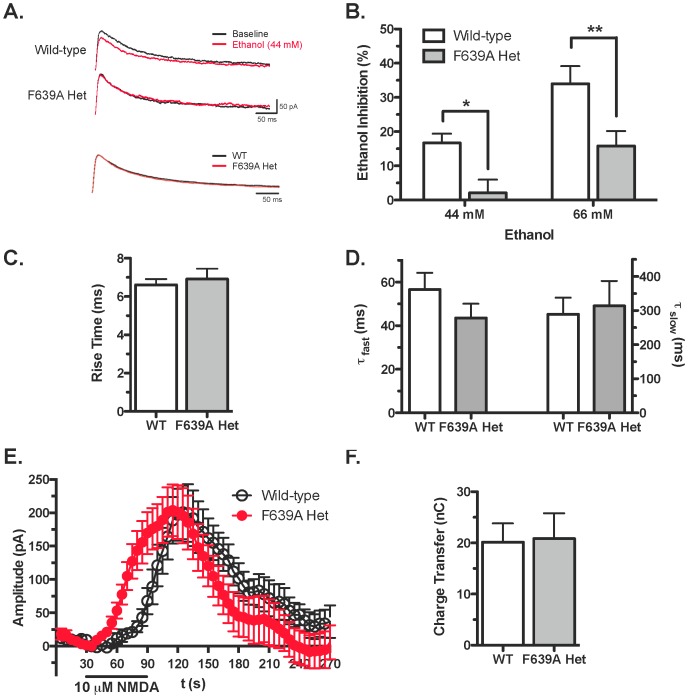
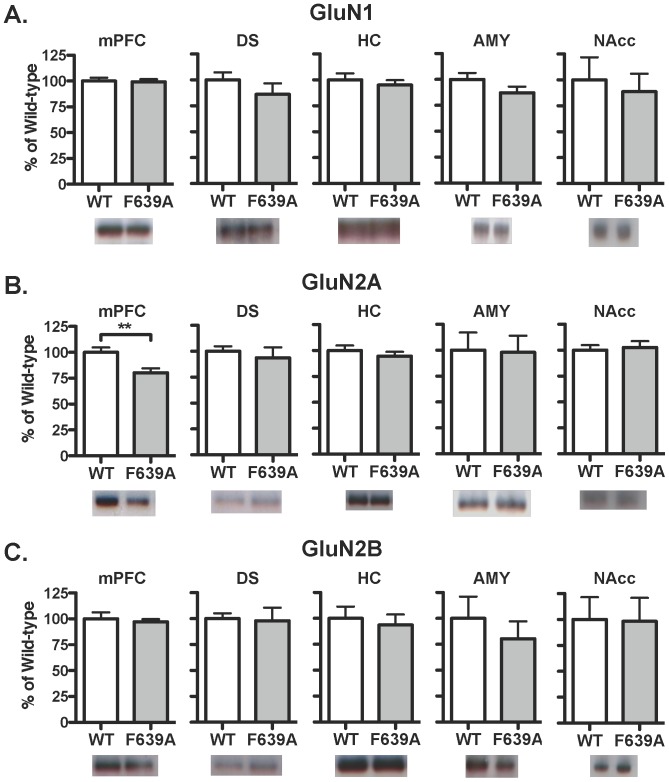
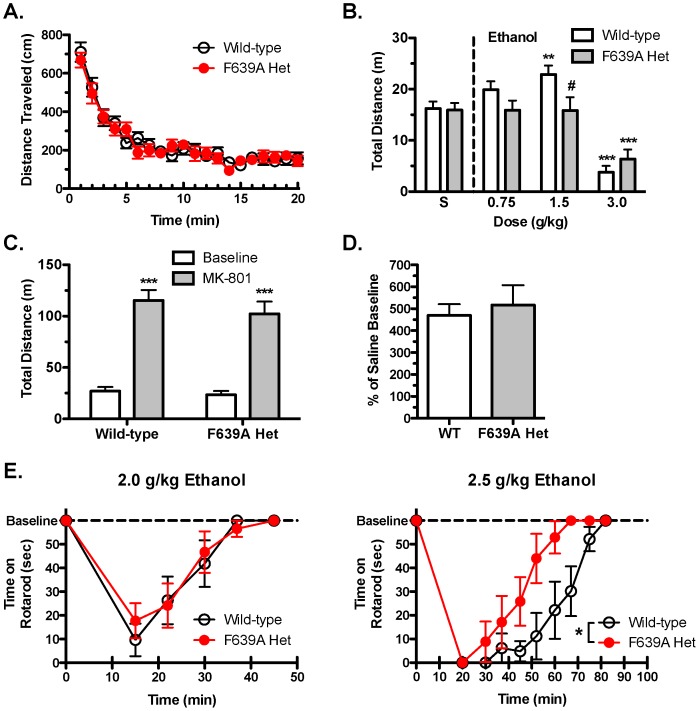
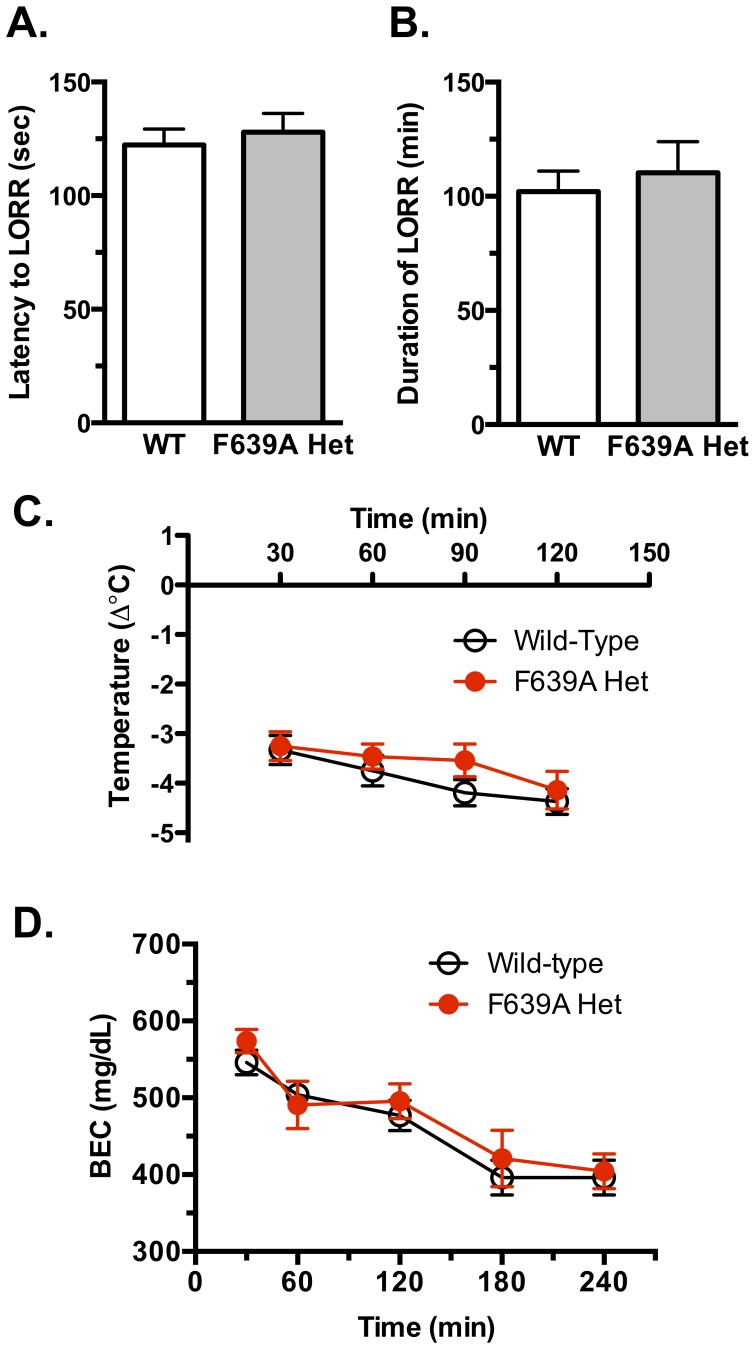
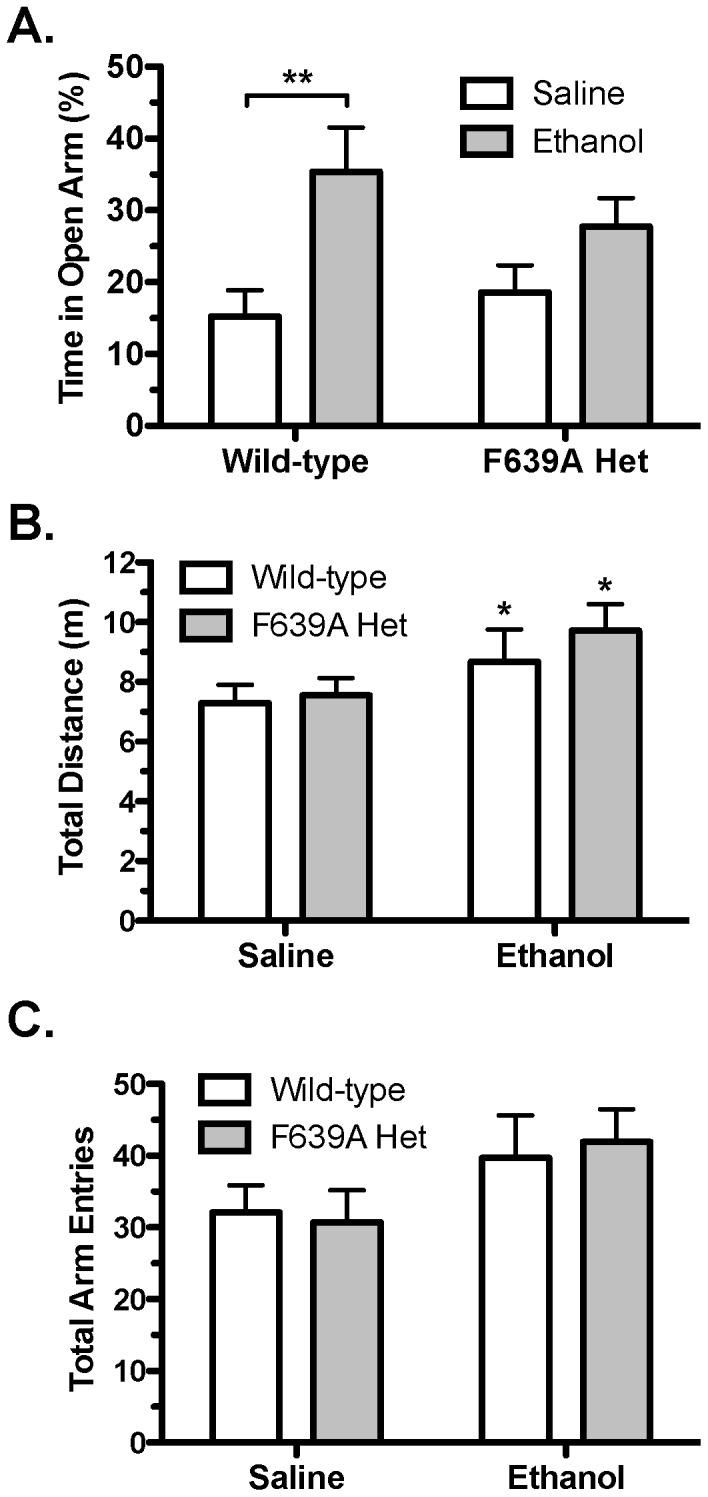
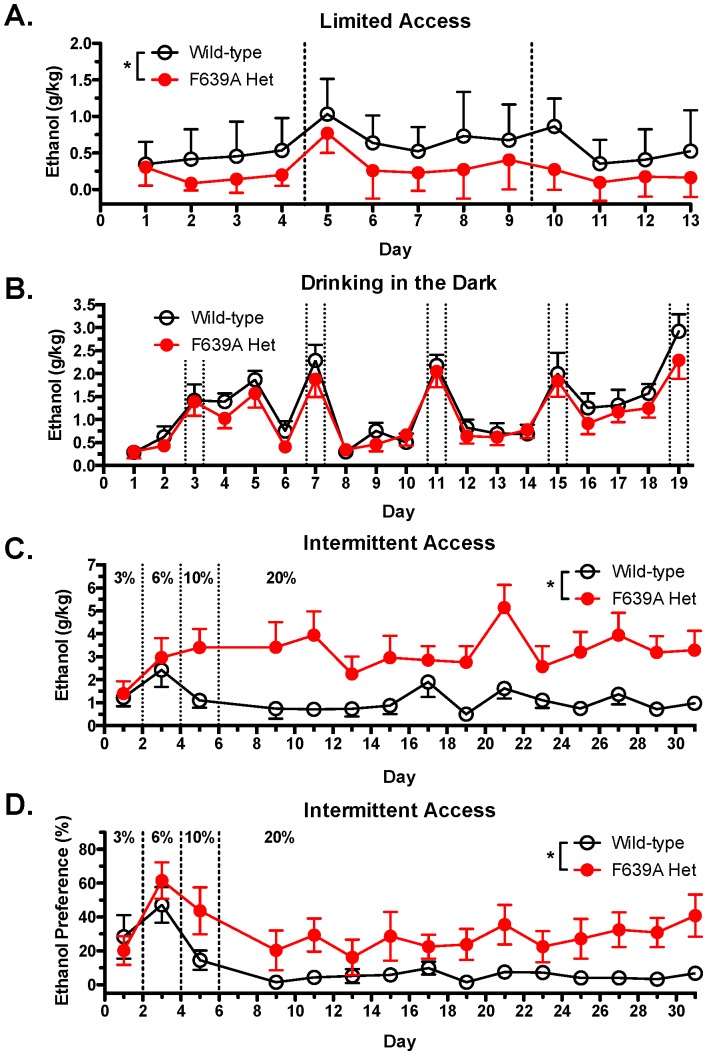
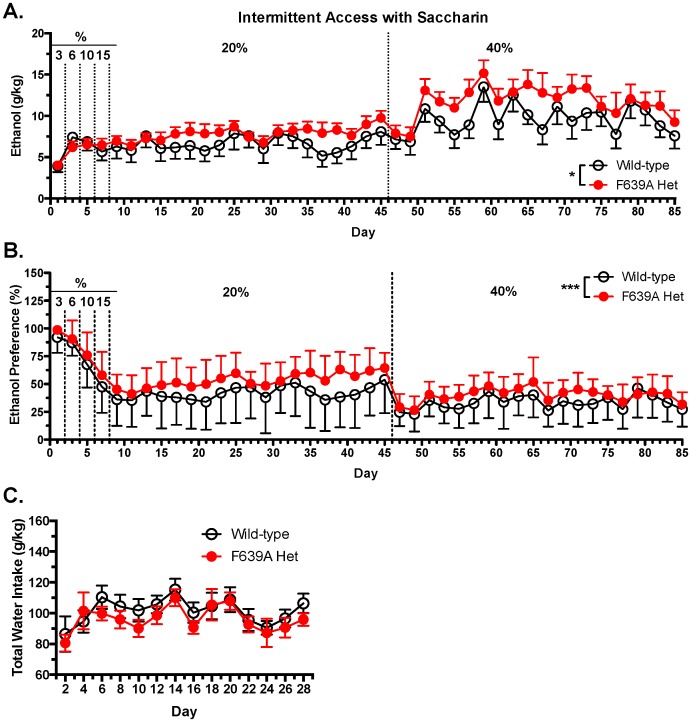
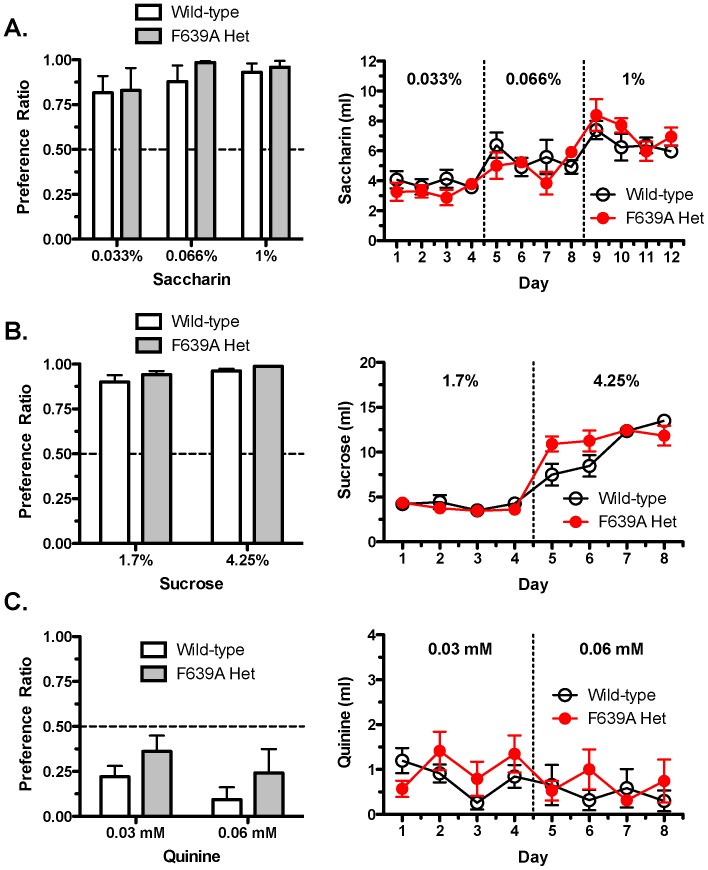
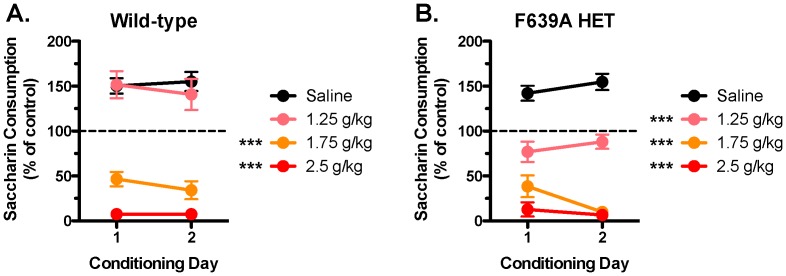
Ethanol's action on the brain likely reflects altered function of key ion channels such as glutamatergic N-methyl-D-aspartate receptors (NMDARs). In this study, we determined how expression of a mutant GluN1 subunit (F639A) that reduces ethanol inhibition of NMDARs affects ethanol-induced behaviors in mice. Mice homozygous for the F639A allele died prematurely while heterozygous knock-in mice grew and bred normally. Ethanol (44 mM; ∼0.2 g/dl) significantly inhibited NMDA-mediated EPSCs in wild-type mice but had little effect on responses in knock-in mice. Knock-in mice had normal expression of GluN1 and GluN2B protein across different brain regions and a small reduction in levels of GluN2A in medial prefrontal cortex. Ethanol (0.75-2.0 g/kg; i.p.) increased locomotor activity in wild-type mice but had no effect on knock-in mice while MK-801 enhanced activity to the same extent in both groups. Ethanol (2.0 g/kg) reduced rotarod performance equally in both groups but knock-in mice recovered faster following a higher dose (2.5 g/kg). In the elevated zero maze, knock-in mice had a blunted anxiolytic response to ethanol (1.25 g/kg) as compared to wild-type animals. No differences were noted between wild-type and knock-in mice for ethanol-induced loss of righting reflex, sleep time, hypothermia or ethanol metabolism. Knock-in mice consumed less ethanol than wild-type mice during daily limited-access sessions but drank more in an intermittent 24 h access paradigm with no change in taste reactivity or conditioned taste aversion. Overall, these data support the hypothesis that NMDA receptors are important in regulating a specific constellation of effects following exposure to ethanol.


Conflict of interest statement

Competing Interests: The authors have declared that no competing interests exist.

Figures

Figure 1
Figure 1. Targeted point mutation (F639A) in the GluN1 subunit decreases ethanol sensitivity of NMDA receptors.
(A), Top: Schematic of GluN1 protein with transmembrane domains (solid bars) and corresponding exons. Bottom: Gene construct used to generate the F639A mice. F(A) is site of mutation within exon 16. NEO cassette flanked by loxp sites is between exons 18 and 19. (B), Percent of wild-type (F/F), heterozygous (F/A), and homozygous (A/A) F639A mice alive at embryonic day 18 or post-natal day 21. Symbol: (*) no surviving mice. (C), Top panel: Sample traces from 14-day old primary hippocampal cultures during (black bar) application of 50 µM NMDA/10 µM glycine. Scale bars: y-axis, 2000 pA; x-axis, 2.5 ms. Bottom panel: Mean amplitude of NMDA evoked currents in cultures from wild-type (F/F, n = 14), heterozygous (F/A, n = 21) and homozygous (A/A, n = 12) F639A mice. (D), Ethanol inhibition from 14-day old primary hippocampal cultures. Percent inhibition of steady state current by 100 mM ethanol from wild-type (F/F, n = 10), heterozygous (F/A, n = 12) and homozygous (A/A, n = 7) F639A mice. Symbol (*): value significantly different from wild-type (* p<0.05; one-way ANOVA, Dunnett's post hoc test). (E), Ethanol inhibition of recombinant wild-type and mutant NMDA receptors expressed in HEK293 cells. Data represent percent inhibition by 100 mM ethanol in cells expressing GluN1 or GluN1(F639A) with either GluN2A (F/F, n = 5; F/A, n = 14; A/A, n = 10) or GluN2B subunits (F/F, n = 6; F/A, n = 8; A/A, n = 9). Symbols: (*) significantly different from wild-type (* p<0.05, ** p<0.01, *** p<0.001; one-way ANOVA, Bonferroni's post hoc test); (#) significantly different from F639A Het (## p<0.01, ### p<0.001; one-way ANOVA, Bonferroni's post hoc test).
Figure 2
Figure 2. GluN1(F639A) mutation alters ethanol inhibition of NMDA-mediated currents in adult mice.
(A), Top: Sample traces of electrically evoked NMDA EPSCs in mPFC neurons from wild-type and F639A Het mice at baseline (black) and during exposure to 44 mM ethanol (red). Bottom: Control NMDA EPSCs from wild-type and F639A Het mice normalized by amplitude. (B), Summary of ethanol inhibition of NMDA-mediated EPSCs in neurons from wild-type (44 mM, n = 10; 66 mM, n = 7) and F639A Het mice (44 mM, n = 9; 66 mM, n = 10). Data are percent of control (mean ±SEM). Symbol (*): value significantly different from wild-type (* p<0.05; ** p<0.01; two-way ANOVA, Bonferroni's post hoc test). (C), Rise time (mean ±SEM) of NMDA-mediated EPSCs in wild-type (n = 7) and F639A Het mice (n = 9). (D), Mean values (±SEM) for fast (left) and slow (right) decay time constants of NMDA-mediated EPSCs from wild-type (fast, n = 7; slow, n = 9) and F639A Hets (fast, n = 7; slow, n = 9). (E), Change in holding current of mPFC neurons from wild-type and F639A Het mice before, during, and after bath application of 5 µM NMDA (n = 7–8 for each group). Values are mean ±SEM. (F), Total charge transfer through NMDA receptors in wild-type and F639A Het mice (n = 7–8 for each group). Values are mean ±SEM.
Figure 3
Figure 3. Expression of NMDA receptor subunits in wild-type and F639A Het mice (n = 4–5 for each group).
Panels show immunoblot analysis of GluN1 (A), GluN2A (B), and GluN2B (C) from crude membrane fractions prepared from select brain regions. Data are percent of wild-type control (mean ±SEM). Abbreviations: mPFC, medial pre-frontal cortex; DS, dorsal striatum; HC, hippocampus; AMY, amygdala; and NAcc, nucleus accumbens. Symbol (*): value significantly different from control (** p<0.01, unpaired t-test).
Figure 4
Figure 4. Locomotor stimulating effects of ethanol are blunted in F639A Het mice.
(A), Baseline spontaneous locomotor activity in saline-treated wild-type and F639A Het mice (n = 15 for each group). Distance (mean ±SEM) traveled shown in 1 min-bins. (B), Summary plot showing total distance (mean ±SEM) traveled by mice during a 10 min period following injection of either saline or ethanol. Symbol (*): value significantly different from saline (** p<0.01, *** p<0.001, two-way RM ANOVA, Bonferroni's post hoc test); (#) value significantly different from wild-type (# p<0.05, two-way RM ANOVA, Bonferroni's post hoc test). (C), Total distance (mean ±SEM) traveled by wild-type and F639A Het mice during a 10 min test period after treatment with saline (baseline) or MK-801 (0.3 mg/kg) (n = 7 for each group). Symbol (*): value significantly different from saline (*** p<0.001, two-way RM ANOVA, Bonferroni's post hoc test). (D), Total distance (mean ±SEM) traveled under acute MK-801 treatment shown as percent of baseline (saline) treatment. (E), Time (mean ±SEM) spent on a fixed-speed rotarod following injection of 2.0 g/kg (n = 6–7 for each group) or 2.5 g/kg (n = 6–7 for each group) ethanol in wild-type and F639A Het mice. Symbol (*): value significantly different from wild-type (* p<0.05, two-way RM ANOVA, Bonferroni's post hoc test).
Figure 5
Figure 5. Hypnotic and hypothermic effects of high doses of ethanol.
Latency to lose righting reflex (LORR; A) and duration of LORR (B) following a 4.0 g/kg injection of ethanol in wild-type and F639A Het mice (n = 17–18 for each group). Values are mean ±SEM. (C), Change in body temperature following a 3.5 g/kg injection of ethanol in wild-type and F639A Het mice (n = 10 for each group). Values are mean ±SEM. (D), Rate of blood ethanol metabolism between wild-type and F639A Het mice. Blood ethanol concentration (mean ±SEM) measured over time following injection with 4.0 g/kg of ethanol (n = 7 for each group).
Figure 6
Figure 6. Anxiolytic response to ethanol is blunted in F639A Het mice.
(A), Percent of time (mean ±SEM) spent in the open arms of an elevated zero maze following injection of saline or 1.25 g/kg ethanol in F639A Het and wildtype mice (n = 10 for each group). Symbol (*): value significantly different from saline (** p<0.01, two-way ANOVA, Bonferroni's post hoc test). (B), Total distance traveled and (C), total number of arm entries on the elevated zero maze. Symbol (*): value significantly different from saline (* p<0.05, two-way ANOVA, Bonferroni's post hoc test). Values are mean ±SEM.
Figure 7
Figure 7. F639A Het mice show altered ethanol consumption than wild-type mice in short-access and long-access drinking paradigms.
(A), Ethanol intake (mean ±SEM) in wild-type and F639A Het mice during 2 h limited-access to 15% (v/v) ethanol or water (n = 8 for each group). Symbol (*): indicates main effect of genotype (* p<0.05, mixed ANOVA). (B), Ethanol intake (mean ±SEM) in a limited-access DID model in wild-type and F639A Het mice. Mice had access to one bottle containing 20% (v/v) ethanol 3 h into their dark cycle for 2 h and 4 h sessions (n = 11–12 for each group). Dotted lines indicate 4 h sessions. (C), Ethanol intake (mean ±SEM) in wild-type and F639A Het mice during intermittent 24 h access to ethanol or water (n = 10–11 for each group). Ethanol concentrations were ramped from 3, 6, 10% and maintained at 20% (v/v) ethanol. Symbol (*): indicates main effect of genotype (* p<0.05, mixed ANOVA). (D), Percent preference for ethanol solution over water-bottle choice in a subset of animals from intermittent access study (n = 6 from each group). Symbol (*): indicates main effect of genotype (* p<0.05, mixed ANOVA). Values are mean ±SEM.
Figure 8
Figure 8. F639A Het mice consume more of a sweetened ethanol solution than wild-type mice in long-access drinking paradigm.
(A), Ethanol intake (mean ±SEM) in wild-type and F639A Het mice with intermittent 24 h access to sweetened ethanol or water (n = 10–11 for each group). Ethanol concentrations were ramped from 3–20% (v/v) and all concentrations also contained 0.2% saccharin (w/v). Symbol (*): indicates main effect of genotype (* p<0.05, mixed ANOVA). (B), Percent preference for sweetened ethanol solution over water. Symbol (*): indicates main effect of genotype (*** p<0.001, mixed ANOVA). Values are mean ±SEM. (C), Total water intake (mean ±SEM) during ‘off’ drinking days in which mice received 2 bottles containing water.
Figure 9
Figure 9. F639A Het and wild-type mice do not differ in taste reactivity.
Consumption in wild-type and F639A Het mice was measured using a two-bottle choice test with 24 h continuous access to tastants (n = 7 for each group). Left panels show preference ratio for volume of tastant solution consumed over water measured on the 4th day of access for (A) saccharin, (B) sucrose, and (C) quinine. Right panels show corresponding volumes consumed across days for each tastant. Values are mean ±SEM.
Figure 10
Figure 10. F639A Het mice show altered conditioned taste aversion to a low dose of ethanol as compared to wild-type mice.
Graphs show percent of baseline saccharin solution consumed after repeated pairings with an injection of saline, 1.25/kg, 1.75 g/kg, or 2.5 g/kg of ethanol in (A) wild-type, and (B) F639A Het mice (n = 6–7 for each group). Symbol (*): value significantly different from saline (*** p<0.001, two-way RM ANOVA, Bonferroni's post hoc test). Values are mean ±SEM.

References

    1. Woodward JJ (1999) Ionotropic glutamate receptors as sites of action for ethanol in the brain. Neurochem Int 35: 107–113. - PubMed
    1. Vengeliene V, Bilbao A, Molander A, Spanagel R (2008) Neuropharmacology of alcohol addiction. Br J Pharmacol 154: 299–315 10.1038/bjp.2008.30 - DOI - PMC - PubMed
    1. Lovinger DM, White G, Weight FF (1989) Ethanol inhibits NMDA-activated ion current in hippocampal neurons. Science 243: 1721–1724. - PubMed
    1. Lovinger DM, Roberto M (2013) Synaptic effects induced by alcohol. Current topics in behavioral neurosciences 13: 31–86 10.1007/78542011143 - DOI - PMC - PubMed
    1. Furukawa H, Singh SK, Mancusso R, Gouaux E (2005) Subunit arrangement and function in NMDA receptors. Nature 438: 185–192 10.1038/nature04089 - DOI - PubMed

Publication types

LinkOut - more resources