. 2013 Nov 14;8(11):e80994.
doi: 10.1371/journal.pone.0080994. eCollection 2013.

Role of glucuronidation for hepatic detoxification and urinary elimination of toxic bile acids during biliary obstruction

Affiliations

Role of glucuronidation for hepatic detoxification and urinary elimination of toxic bile acids during biliary obstruction

Martin Perreault et al. PLoS One. .

Erratum in

  • PLoS One. 2014;9(1). doi:10.1371/annotation/ef13ed51-6848-419d-94d8-1bb62e7bcf52

Abstract

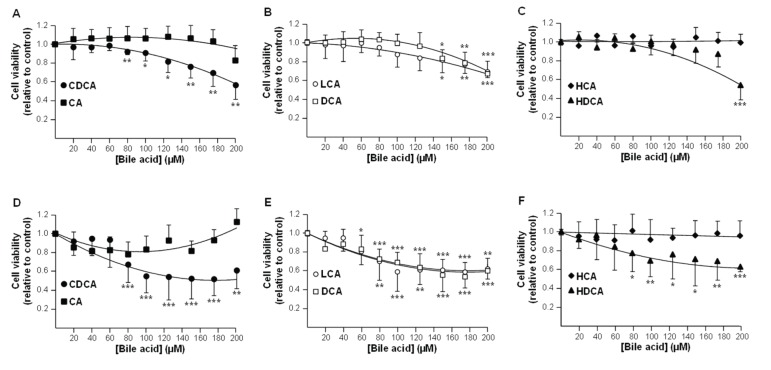
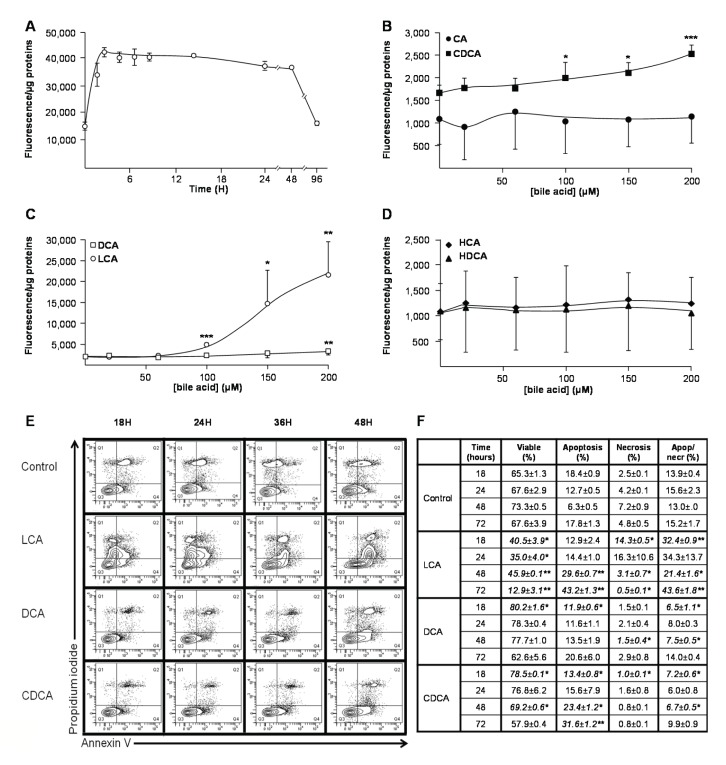
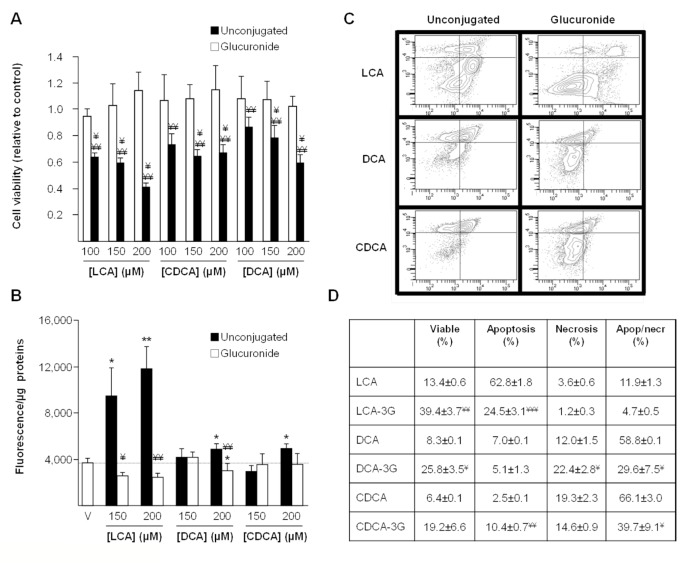
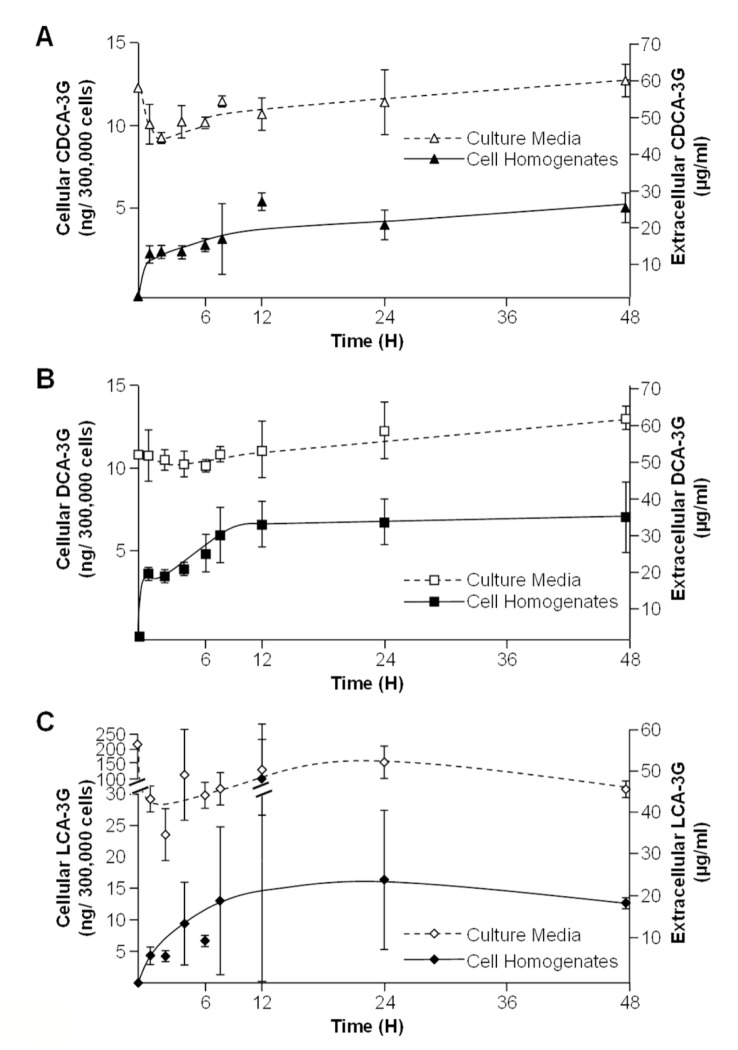
Biliary obstruction, a severe cholestatic condition, results in a huge accumulation of toxic bile acids (BA) in the liver. Glucuronidation, a conjugation reaction, is thought to protect the liver by both reducing hepatic BA toxicity and increasing their urinary elimination. The present study evaluates the contribution of each process in the overall BA detoxification by glucuronidation. Glucuronide (G), glycine, taurine conjugates, and unconjugated BAs were quantified in pre- and post-biliary stenting urine samples from 12 patients with biliary obstruction, using liquid chromatography-tandem mass spectrometry (LC-MS/MS). The same LC-MS/MS procedure was used to quantify intra- and extracellular BA-G in Hepatoma HepG2 cells. Bile acid-induced toxicity in HepG2 cells was evaluated using MTS reduction, caspase-3 and flow cytometry assays. When compared to post-treatment samples, pre-stenting urines were enriched in glucuronide-, taurine- and glycine-conjugated BAs. Biliary stenting increased the relative BA-G abundance in the urinary BA pool, and reduced the proportion of taurine- and glycine-conjugates. Lithocholic, deoxycholic and chenodeoxycholic acids were the most cytotoxic and pro-apoptotic/necrotic BAs for HepG2 cells. Other species, such as the cholic, hyocholic and hyodeoxycholic acids were nontoxic. All BA-G assayed were less toxic and displayed lower pro-apoptotic/necrotic effects than their unconjugated precursors, even if they were able to penetrate into HepG2 cells. Under severe cholestatic conditions, urinary excretion favors the elimination of amidated BAs, while glucuronidation allows the conversion of cytotoxic BAs into nontoxic derivatives.


Conflict of interest statement

Competing Interests: The authors have declared that no competing interests exist.

Figures

Figure 1
Figure 1. Chenodeoxycholic (A&D), lithocholic (B&E), deoxycholic (B&E) and hyodeoxycholic (C&F) acids reduce HepG2 cell viability.
HepG2 cells were exposed to vehicle (DMSO, control) or increasing concentrations of chenodeoxycholic (CDCA, A & D), cholic (CA, A & D), lithocholic (LCA, B & E), deoxycholic (DCA, B & E), hyodeoxycholic (HDCA, C & F) or hyocholic (HCA, C & F) acids for 48 (A-C) or 96H (D-F). (A-C) Cell viability was determined using the MTS reduction assay. (D-F) The protein content was determined using the Pierce® BCA assay kit. Results, expressed relatively to vehicle-treated (DMSO, control) cells, represent the mean±S.D of 2 independent experiments performed in quadruplicate. Statistically significant differences in vehicle versus treated cells were determined using the Student t test: *:p<0.05; ** p<0.01; *** p<0.001.
Figure 2
Figure 2. Lithocholic (A,C,E&F), deoxycholic (C,E&F) and chenodeoxycholic (B,E&F) acids promote HepG2 cell death.
HepG2 cells were exposed to vehicle (DMSO, control), lithocholic (LCA, A, C, E & F), chenodeoxycholic (CDCA, B, E & F), cholic (CA, B), deoxycholic (DCA, C, E & F), hyodeoxycholic (HDCA, D) or hyocholic (HCA, D) acids. (A) HepG2 cells were exposed to DMSO or 100µM LCA for up to 96H, and caspase-3 activity was assessed using the EnzChek Caspase-3 Assay Kit (Invitrogen). (B-D) HepG2 cells were cultured for 3H in the absence or presence of increasing concentrations (20 to 200µM) of CA (B), CDCA (B), LCA (C), DCA (C), HDCA (D) or HCA (D), and caspase-3 activity was assessed as described in the “Materials and Methods” section. (E and F) HepG2 cells were exposed to DMSO (Control), 100µM LCA, DCA or CDCA for 18 to 72H. Living, apoptotic and/or necrotic cells were then quantified through fluorescence-activated cell sorting (FACS) analyses using annexin V/propidium iodide-co-labeling, as represented on panel (E), and the relative abundance (expressed as percentage) of living (Live), apoptotic (Apop) and/or necrotic (Necr) cell populations were determined by dividing their quartiles by the total cell population (F). Statistically significant differences in vehicle versus treated cells were determined using the Student t test: *:p<0.05; ** p<0.01; *** p<0.001.
Figure 3
Figure 3. Ether-glucuronide conjugates of lithocholic, deoxycholic and chenodeoxycholic acids are not cytotoxic.
(A & B) HepG2 cells were exposed to vehicle (DMSO, control), or increasing doses (100, 150 and 200µM) of ether-glucuronides or unconjugated forms of lithocholic (LCA), deoxycholic (DCA), or chenodeoxycholic (CDCA) acids for 48 (A) or 3H. Cell viability (A) was determined using the MTS reduction assay and caspase-3 activity (B) was assessed as described in the “Materials and Methods” section. (C & D) HepG2 cells were exposed to vehicle (DMSO, control), or 200µM LCA, DCA, CDCA, LCA-3G, DCA-3G or CDCA-3G for 24 (LCA/LCA-3G) or 72H (DCA/DCA-3G and CDCA/CDCA-3G). Living, apoptotic and/or necrotic cells were then quantified through fluorescence-activated cell sorting analyses using annexin V/propidium iodide-co-labeling, as represented on panel (C), and the relative abundance (expressed as percentage) of living (Live), apoptotic (Apop) and/or necrotic (Necr) cell populations were determined by dividing their quartiles by the total cell population (D). Statistically significant differences in vehicle versus treated cells (*:p<0.05; ** p<0.01; *** p<0.001) or glucuronide- versus unconjugated-BA treated cells were determined using the Student t test: ¥ p<0.05; ¥¥:p<0.01; ¥¥¥:p<0.001.
Figure 4
Figure 4. Chenodeoxycholic (A), deoxycholic (B) and lithocholic acid-3glucuronide (C) conjugates are incorporated into HepG2 cells.
HepG2 cells were cultured in the presence of vehicle (DMSO, control) or 100µM chenodeoxycholic (CDCA, A), deoxycholic (DCA, B), or lithocholic (LCA, C)- acid 3-glucuronides (G) for 1, 2, 4, 6, 8,12, 24 or 48H. The content in glucuronide conjugates into cell homogenates and culture media was resolved using LC-MS/MS.

References

    1. Hylemon PB, Zhou H, Pandak WM, Ren S, Gil G et al. (2009) Bile acids as regulatory molecules. J Lipid Res 50: 1509-1520. doi:10.1194/jlr.R900007-JLR200. PubMed: 19346331. - DOI - PMC - PubMed
    1. Lefebvre P, Cariou B, Lien F, Kuipers F, Staels B (2009) Role of bile acids and bile acid receptors in metabolic regulation. Physiol Rev 89: 147-191. doi:10.1152/physrev.00010.2008. PubMed: 19126757. - DOI - PubMed
    1. Monte MJ, Marin JJ, Antelo A, Vazquez-Tato J (2009) Bile acids: chemistry, physiology, and pathophysiology. World J Gastroenterol 15: 804-816. doi:10.3748/wjg.15.804. PubMed: 19230041. - DOI - PMC - PubMed
    1. Hofmann AF (2004) Detoxification of lithocholic acid, a toxic bile acid: relevance to drug hepatotoxicity. Drug Metab Rev 36: 703-722. doi:10.1081/DMR-200033475. PubMed: 15554243. - DOI - PubMed
    1. Pauli-Magnus C, Stieger B, Meier Y, Kullak-Ublick GA, Meier PJ (2005) Enterohepatic transport of bile salts and genetics of cholestasis. J Hepatol 43: 342-357. doi:10.1016/j.jhep.2005.03.017. PubMed: 15975683. - DOI - PubMed

Publication types