. 2013 Jul;5(4):10.1002/wics.1260.
doi: 10.1002/wics.1260.

Identification of significant features in DNA microarray data

Affiliations

Identification of significant features in DNA microarray data

Eric Bair. Wiley Interdiscip Rev Comput Stat. 2013 Jul.

Abstract

DNA microarrays are a relatively new technology that can simultaneously measure the expression level of thousands of genes. They have become an important tool for a wide variety of biological experiments. One of the most common goals of DNA microarray experiments is to identify genes associated with biological processes of interest. Conventional statistical tests often produce poor results when applied to microarray data owing to small sample sizes, noisy data, and correlation among the expression levels of the genes. Thus, novel statistical methods are needed to identify significant genes in DNA microarray experiments. This article discusses the challenges inherent in DNA microarray analysis and describes a series of statistical techniques that can be used to overcome these challenges. The problem of multiple hypothesis testing and its relation to microarray studies are also considered, along with several possible solutions.

Keywords: feature selection; genetics; microarray; multiple testing.


Figures

FIGURE 1
FIGURE 1
Illustration of a typical microarray experiment (using cDNA technology). First, mRNA is extracted from two groups of cells, namely an experimental sample of interest and a control sample. Each sample is labeled with a different color of fluorescent dye. The samples are then combined and hybridized onto an array. The relative abundance of the mRNA corresponding to a particular gene can be measured by calculating the ratio of red dye to green dye at the appropriate spot on the array.
FIGURE 2
FIGURE 2
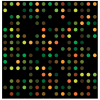
Image of a DNA microarray slide. One may measure the relative gene expression of each gene by comparing the ratio of the amount of red dye to the amount of green dye at each probe on the array.
FIGURE 3
FIGURE 3
Heat map of the leukemia microarray data of Bullinger et al. Each colored square on the map corresponds to the expression level of a given gene for a given patient. In the above figure, each row represents a gene and each column represents a patient. The brighter the color of a given square, the higher (or lower) the expression level of the corresponding gene. Usually hierarchical clustering is performed on the rows and columns of the data set prior to drawing the heat map.
FIGURE 4
FIGURE 4
Illustration of the bias-variance trade-off. The above figure shows a regression problem where the objective is to predict y given a value of x. The dotted line shows the true relationship between x and y. The linear regression estimator (shown in blue) has high bias and low variance, and the interpolation estimator (shown in orange) has low bias and high variance.
FIGURE 5
FIGURE 5
Illustration of the association between the complexity of a model and the bias/variance of the model. In general, as the complexity of a model increases, the variance of the model increases and the bias of the model decreases.
FIGURE 6
FIGURE 6
Illustration of the optimal discovery procedure (ODP). Suppose that the test statistic for the null hypothesis of no differential expression is t = −2 for one gene and t = 2 for a second gene. Suppose further that there are several other genes with similar expression patterns to the second gene for which t ≈ 2. Using traditional hypothesis testing procedures, one would be equally likely to reject the null hypothesis of no differential expression for both of the two genes. Using ODP, one would be more likely to reject the null hypothesis for the gene where t = 2, since the existence of several genes with similar expression patterns increases ones confidence that the result is not due to chance.

References

    1. International Human Genome Sequencing Consortium Finishing the euchromatic sequence of the human genome. Nature. 2004;431:931–945. - PubMed
    1. Lander ES, Linton LM, Birren B, Nusbaum C, Zody MC, Baldwin J, Devon K, Dewar K, Doyle M, FitzHugh W, et al. Initial sequencing and analysis of the human genome. Nature. 2001;409:860–921. - PubMed
    1. Dudoit S, Yang Y, Callow MJ, Speed TP. Statistical methods for identifying differentially expressed genes in replicated cDNA microarray experiments. Stat Sin. 2002;12:111–139.
    1. Lockhart DJ, Dong H, Byrne MC, Follettie MT, Gallo MV, Chee MS, Mittmann M, Wang C, Kobayashi M, Horton H, et al. Expression monitoring by hybridization to high-density oligonucleotide arrays. Nat Biotechnol. 1996;14:1675–1680. - PubMed
    1. DeRisi J, Penland L, Brown PO, Bittner ML, Meltzer PS, Ray M, Chen Y, Su YA, Trent JM. Use of a cDNA microarray to analyse gene expression patterns in human cancer. Nat Genet. 1996;14:457–460. - PubMed

LinkOut - more resources