

Evidence of microevolution of Salmonella Typhimurium during a series of egg-associated outbreaks linked to a single chicken farm
- PMID: 24245509
- PMCID: PMC3870983
- DOI: 10.1186/1471-2164-14-800
Evidence of microevolution of Salmonella Typhimurium during a series of egg-associated outbreaks linked to a single chicken farm
Abstract
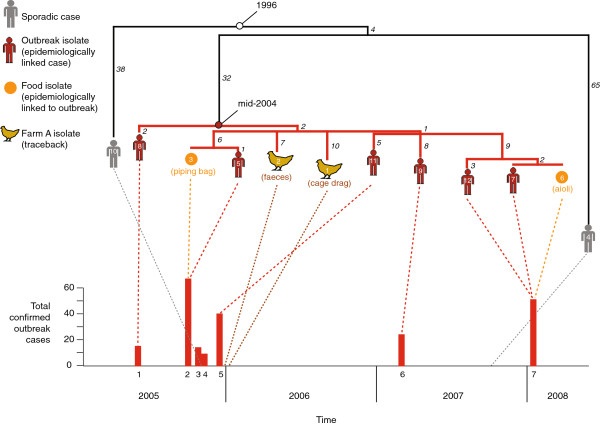
Background: The bacterium Salmonella enterica serovar Typhimurium (S. Typhimurium) is one of the most frequent causes of foodborne outbreaks of gastroenteritis. Between 2005-2008 a series of S. Typhimurium outbreaks occurred in Tasmania, Australia, that were all traced to eggs originating from a single chicken farm. We sequenced the genomes of 12 isolates linked to these outbreaks, in order to investigate the microevolution of a pathogenic S. Typhimurium clone in a natural, spatiotemporally restricted population.
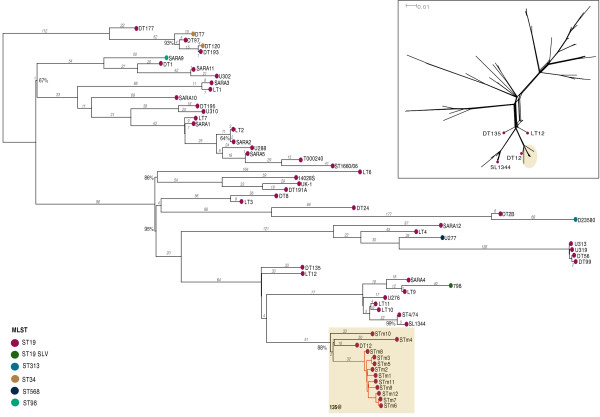
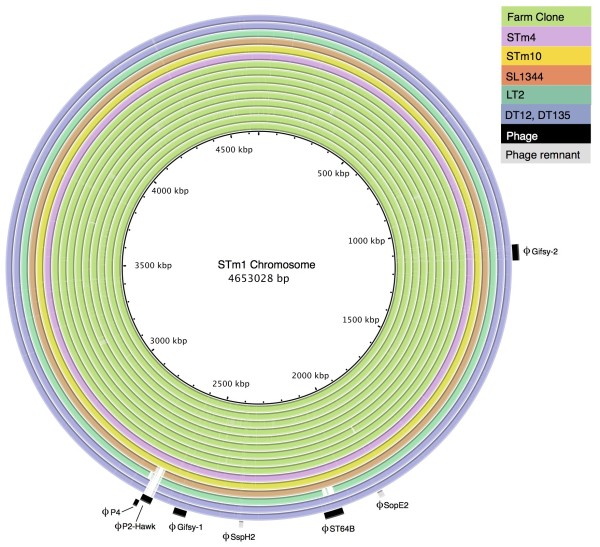
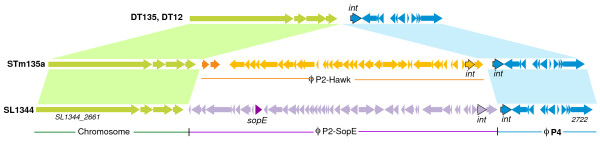
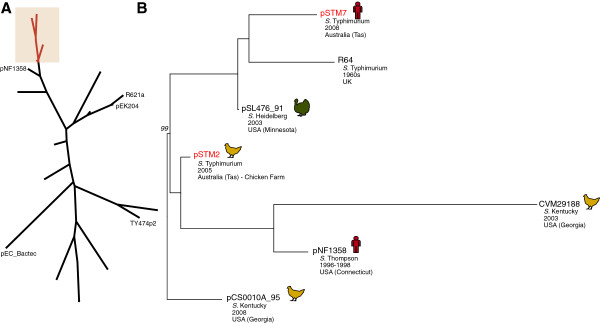
Results: The isolates, which shared a phage type similar to DT135 known locally as 135@ or 135a, formed a clade within the S. Typhimurium population with close similarity to the reference genome SL1334 (160 single nucleotide polymorphisms, or SNPs). Ten of the isolates belonged to a single clone (<23 SNPs between isolate pairs) which likely represents the population of S. Typhimurium circulating at the chicken farm; the other two were from sporadic cases and were genetically distinct from this clone. Divergence dating indicated that all 12 isolates diverged from a common ancestor in the mid 1990 s, and the clone began to diversify in 2003-2004. This clone spilled out into the human population several times between 2005-2008, during which time it continued to accumulate SNPs at a constant rate of 3-5 SNPs per year or 1x10⁻⁶ substitutions site-1 year-1, faster than the longer-term (~50 year) rates estimated previously for S. Typhimurium. Our data suggest that roughly half of non-synonymous substitutions are rapidly removed from the S. Typhimurium population, after which purifying selection is no longer important and the remaining substitutions become fixed in the population. The S. Typhimurium 135@ isolates were nearly identical to SL1344 in terms of gene content and virulence plasmids. Their phage contents were close to SL1344, except that they carried a different variant of Gifsy-1, lacked the P2 remnant found in SL1344 and carried a novel P2 phage, P2-Hawk, in place SL1344's P2 phage SopEϕ. DT135 lacks P2 prophage. Two additional plasmids were identified in the S. Typhimurium 135@ isolates, pSTM2 and pSTM7. Both plasmids were IncI1, but phylogenetic analysis of the plasmids and their bacterial hosts shows these plasmids are genetically distinct and result from independent plasmid acquisition events.
Conclusions: This study provides a high-resolution insight into short-term microevolution of the important human pathogen S. Typhimurium. It indicates that purifying selection occurs rapidly in this population (≤ 6 years) and then declines, and provides an estimate for the short-term substitution rate. The latter is likely to be more relevant for foodborne outbreak investigation than previous estimates based on longer time scales.
Figures
References
-
- Hendriksen RS, Vieira AR, Karlsmose S, Lo Fo Wong DM, Jensen AB, Wegener HC, Aarestrup FM. Global monitoring of Salmonella serovar distribution from the World Health Organization Global Foodborne Infections Network Country Data Bank: results of quality assured laboratories from 2001 to 2007. Foodborne Pathog Dis. 2011;8(8):887–900. doi: 10.1089/fpd.2010.0787. - DOI - PubMed
-
- Sintchenko V, Wang Q, Howard P, Ha CW, Kardamanidis K, Musto J, Gilbert GL. Improving resolution of public health surveillance for human Salmonella enterica serovar Typhimurium infection: 3 years of prospective multiple-locus variable-number tandem-repeat analysis (MLVA) BMC Infect Dis. 2012;12:78. doi: 10.1186/1471-2334-12-78. - DOI - PMC - PubMed
-
- OzFoodNet Working Group. Monitoring the incidence and causes of diseases potentially transmitted by food in Australia: annual report of the OzFoodNet Network, 2008. Commun Dis Intell. 2009;33(4):389–413. - PubMed
Publication types
MeSH terms
LinkOut - more resources
Full Text Sources
Other Literature Sources
Molecular Biology Databases
