. 2014 Jan;164(1):287-307.
doi: 10.1104/pp.113.228874. Epub 2013 Nov 18.

Do plants contain g protein-coupled receptors?

Affiliations

Do plants contain g protein-coupled receptors?

Bruck Taddese et al. Plant Physiol. 2014 Jan.

Abstract

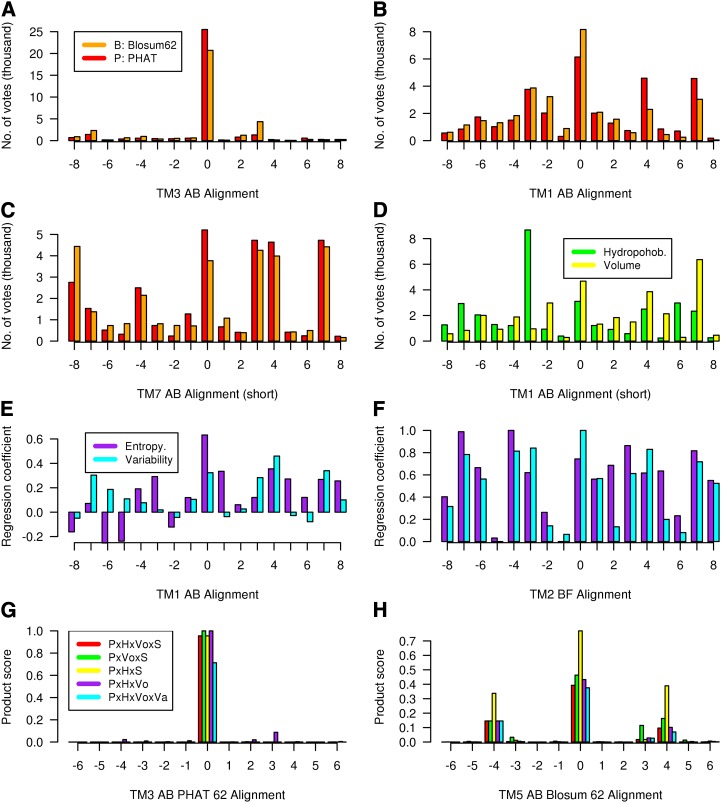
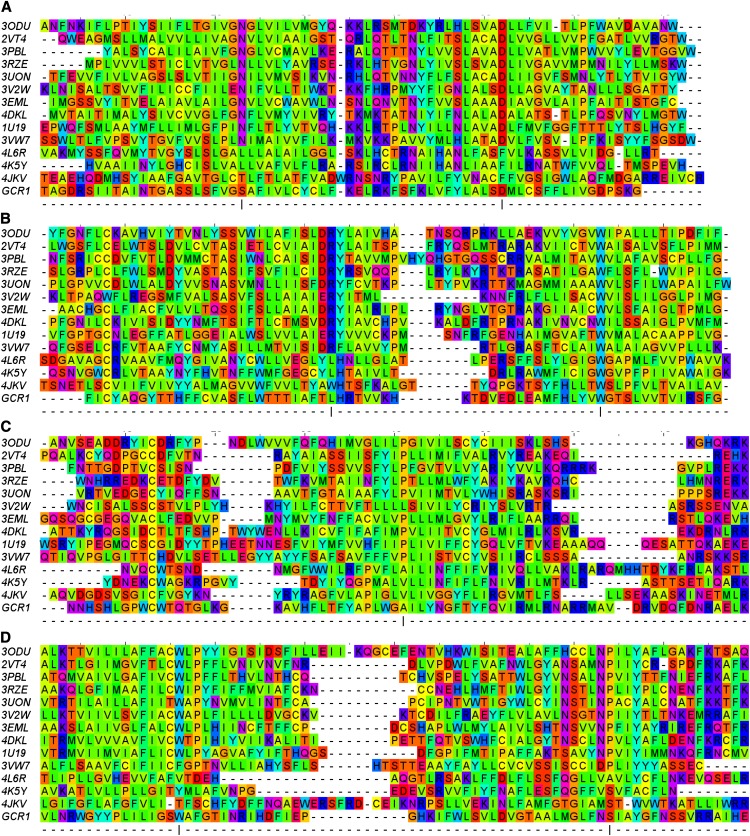
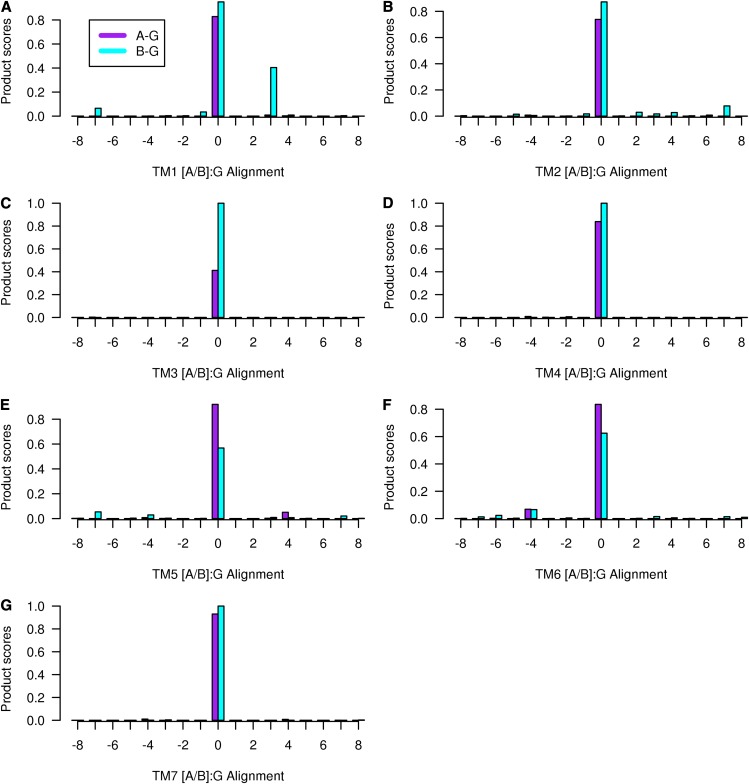
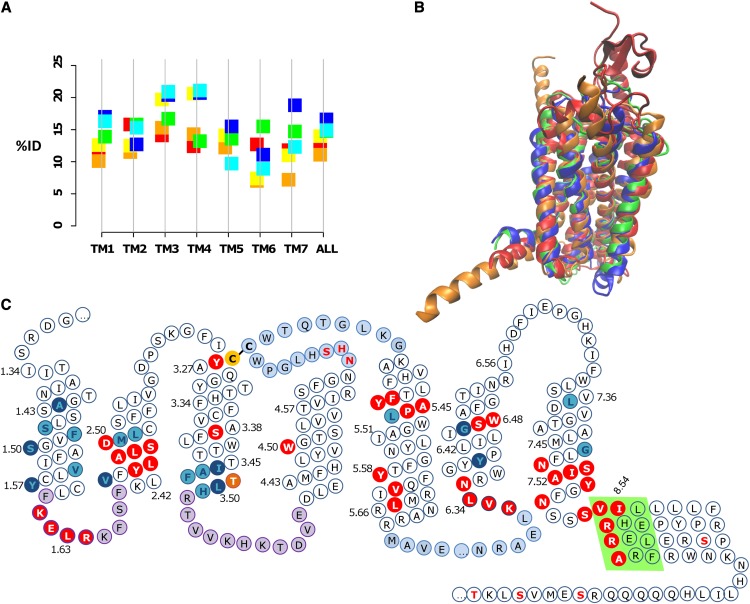
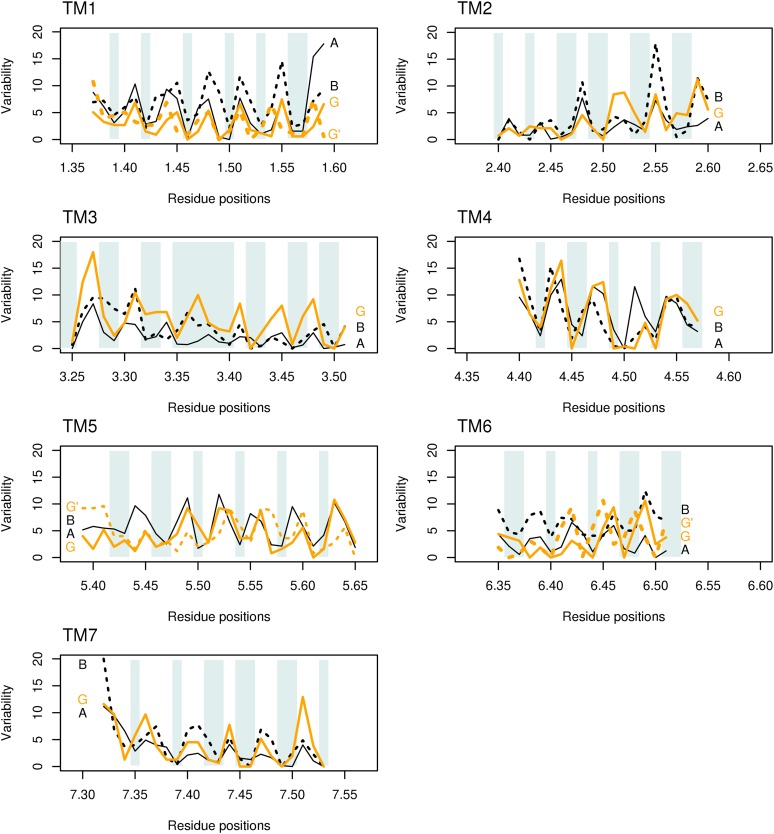
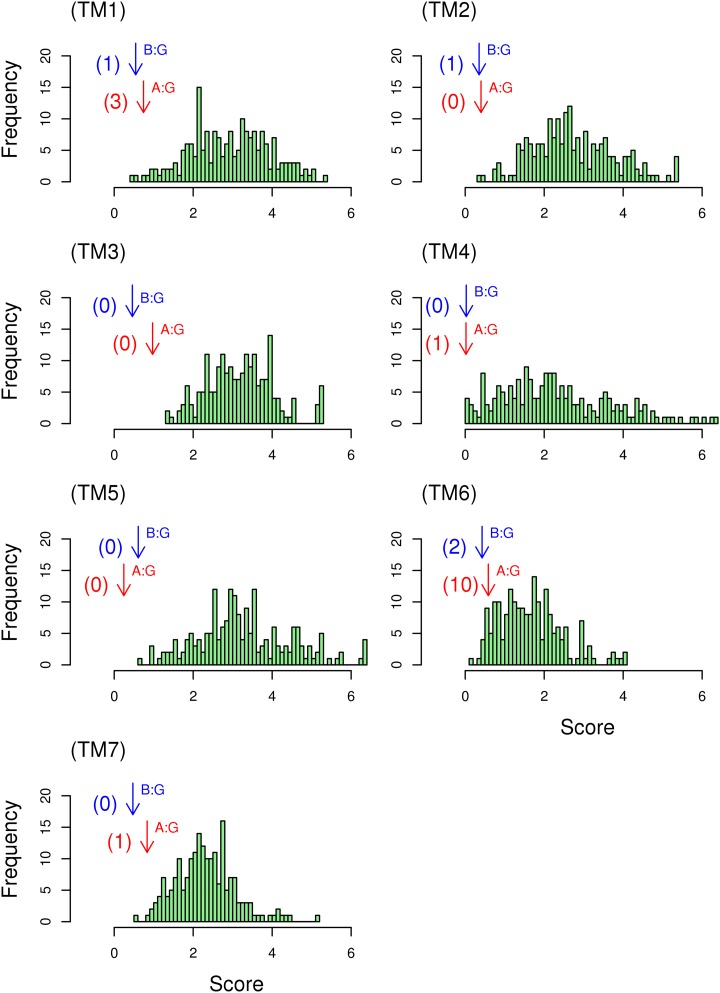
Whether G protein-coupled receptors (GPCRs) exist in plants is a fundamental biological question. Interest in deorphanizing new GPCRs arises because of their importance in signaling. Within plants, this is controversial, as genome analysis has identified 56 putative GPCRs, including G protein-coupled receptor1 (GCR1), which is reportedly a remote homolog to class A, B, and E GPCRs. Of these, GCR2 is not a GPCR; more recently, it has been proposed that none are, not even GCR1. We have addressed this disparity between genome analysis and biological evidence through a structural bioinformatics study, involving fold recognition methods, from which only GCR1 emerges as a strong candidate. To further probe GCR1, we have developed a novel helix-alignment method, which has been benchmarked against the class A-class B-class F GPCR alignments. In addition, we have presented a mutually consistent set of alignments of GCR1 homologs to class A, class B, and class F GPCRs and shown that GCR1 is closer to class A and/or class B GPCRs than class A, class B, or class F GPCRs are to each other. To further probe GCR1, we have aligned transmembrane helix 3 of GCR1 to each of the six GPCR classes. Variability comparisons provide additional evidence that GCR1 homologs have the GPCR fold. From the alignments and a GCR1 comparative model, we have identified motifs that are common to GCR1, class A, B, and E GPCRs. We discuss the possibilities that emerge from this controversial evidence that GCR1 has a GPCR fold.


Figures

Figure 1.
Figure 1.
Various alignment results to illustrate the method; each legend is valid until replaced by an alternative. A to C, Number of votes for each of the 17 alternative class A-class B pairwise alignments evaluated using the PHAT matrix (P, red, left) and the Blosum62 matrix (B, orange, right): TM3 (A), TM1 (B), and TM7 (C). D, Number of votes for the TM1 class A-class B pairwise alignments evaluated using hydrophobicity (H, green, left) and volume matrix (Vo, yellow, right). E, Maximum lagged correlation values for each alignment evaluated using entropy (S, purple, left) and variability (Va, cyan, right) for the class A-class B TM1 alignment. F, Correlation values of E scaled between 0 and 1.0 for the class B-class F TM2 alignment. G, Product scores for each of the TM3 class A-class B alignments. The product scores are as follows (left to right): P × H × Vo × S (red), P × Vo × S (green), P × H × S (yellow), P × H × Vo (white), and P × H × Vo × Va (purple). H, The product scores for each of the TM5 class A-class B alignments. The product scores are as follows: B × H × Vo × S (orange), B × Vo × S (green), B × H × S (yellow), B × H × Vo (white), and B × H × Vo × Va (purple). [See online article for color version of this figure.]
Figure 2.
Figure 2.
Sequence alignment between GCR1 and the class A, class B, and class F template sequences; the color reflects the biophysical properties. The most conserved positions within each helix in class A are marked by a vertical bar and correspond to position 50. The residues are color coded according to their properties as follows: blue, positive; red, negative or small polar; purple, polar; cyan, polar aromatic; green, large hydrophobic; yellow, small hydrophobic. This corresponds to the Taylor scheme, as implemented in Jalview (Clamp et al., 2004). For clarity, some ungapped sequence sections have been truncated.
Figure 3.
Figure 3.
The product of the four scaled scores (PHAT matrix score × hydrophobicity × volume × entropy) for the alignment between class A GCR1 homologs (left, purple) and class B GCR1 homologs (right, cyan). The alignment corresponding to the 0 alignment is given in Figure 2. The legend given for TM1 is valid for all plots. [See online article for color version of this figure.]
Figure 4.
Figure 4.
A, Mean percentage identity (%ID) between different GPCR families. The class A-class B, class A-class F, and class B-class F percentage identities are shown to the left of the vertical line in red, orange, and yellow, respectively; the percentage identities between class A, class B, and class F with the GCR1 homologs are shown to the right in green, blue, and cyan, respectively. The percentage identities for TM3 between GCR1 homologs and class C and class D GPCRs are 14.3% and 11.9%, respectively. B, Structural alignment (determined by modeler using all residues) between the inactive GCR1 (green), the class A dopamine D3 (blue), the class B glucagon (orange), and the class F smoothened (red) receptors looking toward TM1 to TM4. The root mean square deviation (RMSD) between minimized inactive GCR1 and the dopamine, glucagon, and smoothened receptors is 1.29, 2.07, and 3.33 Å, respectively. For comparison, the expected RMSDs between the α, β, χ, and δ class A GPCRs are 2.2 to 3.0 Å and that between class A and class B GPCRs is typically 2.7 to 3.3 Å (Hollenstein et al., 2013; Siu et al., 2013), so these RMSDs are of the expected magnitude. The RMSDs were calculated over the helical domain over the ranges 1.36 to 1.59, 2.40 to 2.58, 3.25 to 3.51, 4.45 to 4.62, 5.43 to 5.65, 6.33 to 6.43, and 7.43 to 7.53; shorter sections were used for TM6 and TM7 because of the known outward tilt in class B in this region. C, Snake diagram showing GCR1 features that characterize the GPCR fold. The Cys residues of the TM3-ECL2 disulfide bond are shown in yellow with black lettering. Motifs shared with class A and/or class B GPCRs are shown in red with white lettering. Group-conserved residues that have the same character in class A, class B, and GCR1 homologs are shown in cyan with dark blue lettering; other common group-conserved positions are shown in dark blue with cyan lettering. The TLH positional equivalent of the DRY motif is shown in orange (residues are only shown in one category). ICL1 and ICL2 are denoted in purple, as they are the same length as their class A and/or class B counterparts. ECL2 and ICL3 are shown in light blue, as they are the longest ECL and ICL, respectively. The ampipathic helix 8 is denoted by a light green background. Potential phosphorylation sites C terminal of the ampipathic helix are denoted by red lettering. The potential glycosylation site in ECL2 is also denoted by red lettering.
Figure 5.
Figure 5.
Variability for each of the seven transmembrane helices. The variability for class A GPCRs (A, solid lines) and class B GPCRs (B, dotted lines) is shown in black; the variability for GCR1 homologs is shown in orange (G). Shading indicates the internal or buried positions (which should have low variability). For TM1, TM5, and TM6, the variability for the alternative +3, +4, and −6 GCR1 alignments (G′) is shown with orange dashes. Position 7.34 is a restricted external position in many receptors, hence its low variability. The different helix lengths shown reflect both the natural helix length and the length over which a common conformation can be expected (Vohra et al., 2013). Although positions 3.35 to 3.40 in TM3 are nominally internal, they still show a maximum variability in line with the helix periodicity. [See online article for color version of this figure.]
Figure 6.
Figure 6.
A helix-by-helix quality assessment of the alignment of GCR1 homologs. The score from Equation 1 for the alignment between GCR1 homologs and class A and class B GPCRs is denoted by bottom (red) and top (blue) arrows denoted A:G and B:G, respectively. A histogram of the scores from Equation 1 between GCR1 homologs and the 198 comparator sequences is also given; the number of comparator scores that are higher than the class A or class B scores are shown in parentheses beside each arrow. [See online article for color version of this figure.]

References

    1. Attwood TK, Coletta A, Muirhead G, Pavlopoulou A, Philippou PB, Popov I, Romá-Mateo C, Theodosiou A, Mitchell AL. (2012) The PRINTS database: a fine-grained protein sequence annotation and analysis resource—its status in 2012. Database (Oxford) 2012: bas019. - PMC - PubMed
    1. Attwood TK, Findlay JB. (1994) Fingerprinting G-protein-coupled receptors. Protein Eng 7: 195–203 - PubMed
    1. Baldwin JM, Schertler GF, Unger VM. (1997) An alpha-carbon template for the transmembrane helices in the rhodopsin family of G-protein-coupled receptors. J Mol Biol 272: 144–164 - PubMed
    1. Ballesteros JA, Weinstein H. (1995) Integrated methods for the construction of three-dimensional models and computational probing of structure-function relationships in G-protein coupled receptors. Methods Neurosci 25: 366–428
    1. Bennett-Lovsey RM, Herbert AD, Sternberg MJ, Kelley LA. (2008) Exploring the extremes of sequence/structure space with ensemble fold recognition in the program Phyre. Proteins 70: 611–625 - PubMed

Publication types

MeSH terms

Substances

LinkOut - more resources