

The bigger picture of FTO: the first GWAS-identified obesity gene
- PMID: 24247219
- PMCID: PMC4188449
- DOI: 10.1038/nrendo.2013.227
The bigger picture of FTO: the first GWAS-identified obesity gene
Abstract
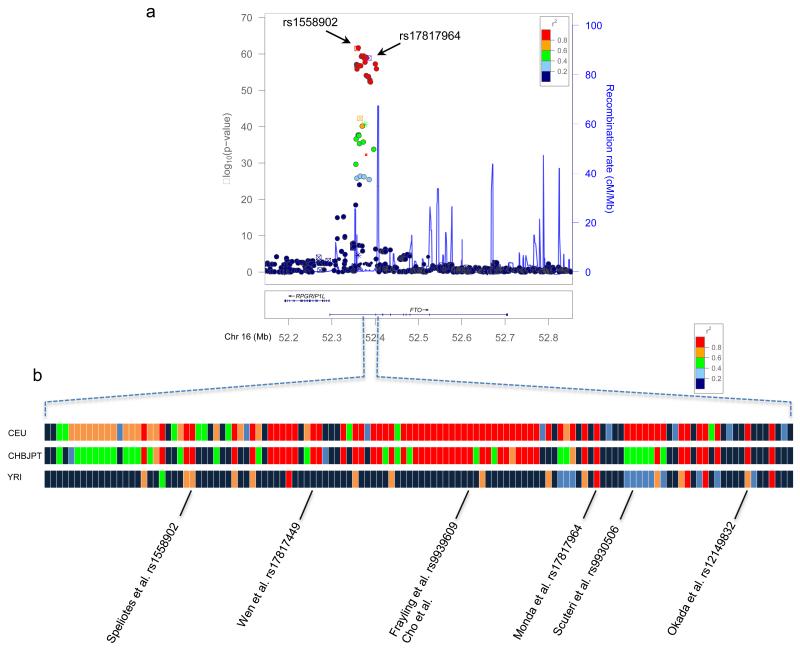
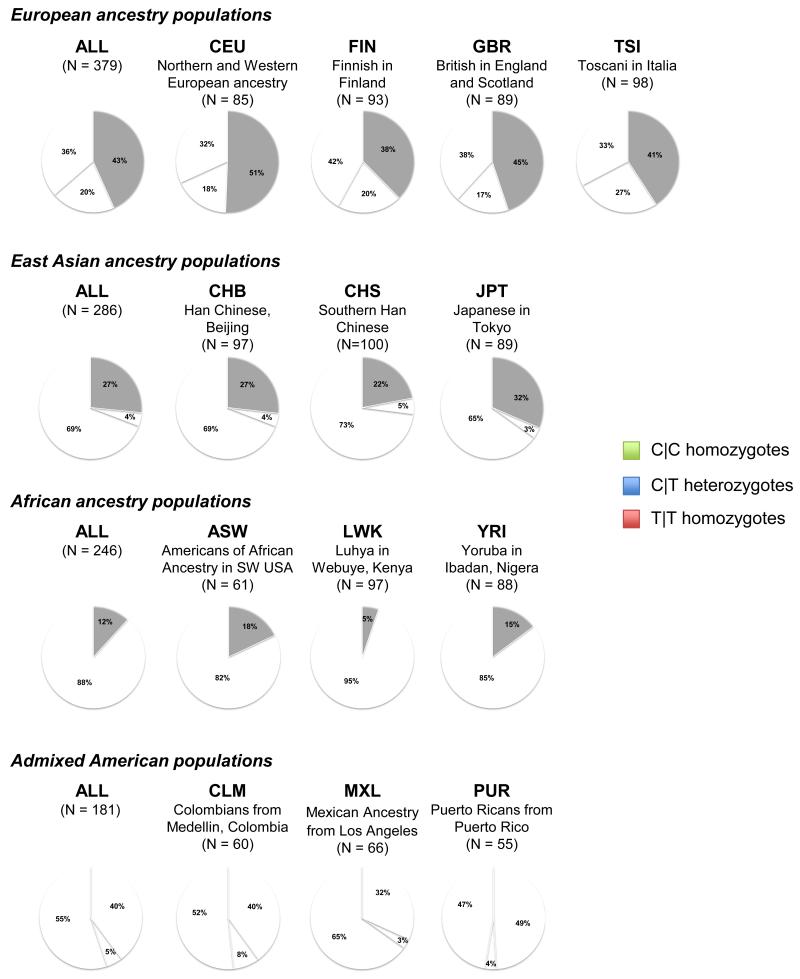
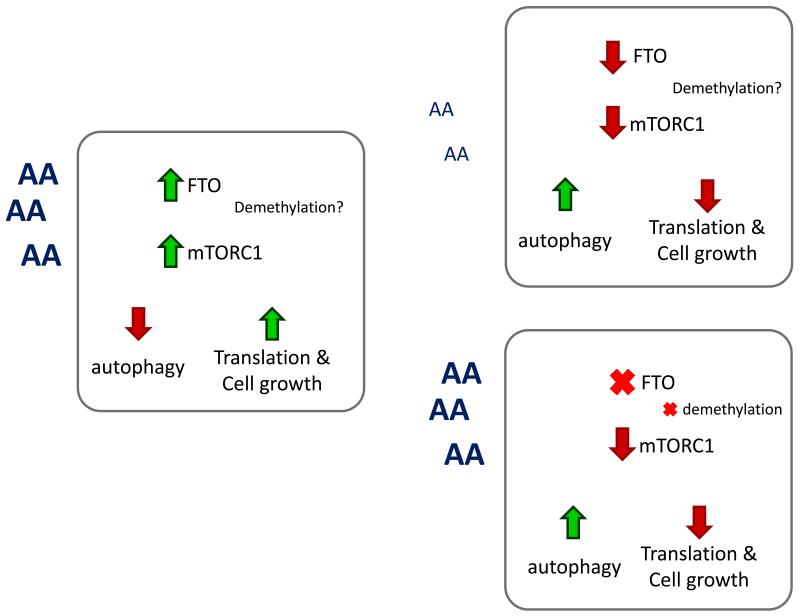
Single nucleotide polymorphisms (SNPs) that cluster in the first intron of fat mass and obesity associated (FTO) gene are associated obesity traits in genome-wide association studies. The minor allele increases BMI by 0.39 kg/m(2) (or 1,130 g in body weight) and risk of obesity by 1.20-fold. This association has been confirmed across age groups and populations of diverse ancestry; the largest effect is seen in young adulthood. The effect of FTO SNPs on obesity traits in populations of African and Asian ancestry is similar or somewhat smaller than in European ancestry populations. However, the BMI-increasing allele in FTO is substantially less prevalent in populations with non-European ancestry. FTO SNPs do not influence physical activity levels; yet, in physically active individuals, FTO's effect on obesity susceptibility is attenuated by approximately 30%. Evidence from epidemiological and functional studies suggests that FTO confers an increased risk of obesity by subtly changing food intake and preference. Moreover, emerging data suggest a role for FTO in nutrient sensing, regulation of mRNA translation and general growth. In this Review, we discuss the genetic epidemiology of FTO and discuss how its complex biology might link to the regulation of body weight.
Figures
References
-
- Maes HH, Neale MC, Eaves LJ. Genetic and environmental factors in relative body weight and human adiposity. Behav Genet. 1997;27:325–51. - PubMed
-
- Loos RJF. In: Adipose Tissue Biology. Symonds ME, editor. Springer; 2012. pp. 317–378.
-
- Hindorff LA, Junkins HA, Hall PN, Mehta JP, Manolio TA. 2013
Publication types
MeSH terms
Substances
Grants and funding
LinkOut - more resources
Full Text Sources
Other Literature Sources
Medical
