. 2014 Jan 3;289(1):403-12.
doi: 10.1074/jbc.M113.523498. Epub 2013 Nov 18.

Molecular basis of ADP inhibition of vacuolar (V)-type ATPase/synthase

Affiliations

Molecular basis of ADP inhibition of vacuolar (V)-type ATPase/synthase

Jun-ichi Kishikawa et al. J Biol Chem. .

Abstract

Reduction of ATP hydrolysis activity of vacuolar-type ATPase/synthase (V0V1) as a result of ADP inhibition occurs as part of the normal mechanism of V0V1 of Thermus thermophilus but not V0V1 of Enterococcus hirae or eukaryotes. To investigate the molecular basis for this difference, domain-swapped chimeric V1 consisting of both T. thermophilus and E. hirae enzymes were generated, and their function was analyzed. The data showed that the interaction between the nucleotide binding and C-terminal domains of the catalytic A subunit from E. hirae V1 is central to increasing binding affinity of the chimeric V1 for phosphate, resulting in reduction of the ADP inhibition. These findings together with a comparison of the crystal structures of T. thermophilus V1 with E. hirae V1 strongly suggest that the A subunit adopts a conformation in T. thermophilus V1 different from that in E. hirae V1. This key difference results in ADP inhibition of T. thermophilus V1 by abolishing the binding affinity for phosphate during ATP hydrolysis.

Keywords: ADP Inhibition; ATP Synthase; F1F0 ATPase; Membrane Proteins; Molecular Motors; Vacuolar ATPase.


Figures

FIGURE 1.
FIGURE 1.
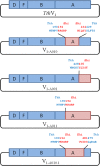
Construction of domain-chimeric V1. a, schematic representation of TthV0V1. Subunits in V1 and V0 are shown in white and gray, respectively. b, the structural model of chimeric V1-A010 based on the crystal structure of TthV1 (Protein Data Bank code 3W3A). The NB domain of the A subunit (colored blue) of TthV1 (residue numbers 190–428) was swapped by that of EhiV1 (residue numbers 194–434). Other domains and subunits (sub.) (B and DF) originate from TthV1 (colored red and oranges). c, representation of A subunits of all chimeric V1 constructs. The domains replaced by that of EhiV1 are colored blue (NB domain) and cyan (CT domain), respectively. V1-A001 contains the CT domain of EhiV1 (residue numbers 435–593). V1-A011 contains NB and CT domains of EhiV1. V1-A010.1 contains the NB domain and first and second helices of CT domain of EhiV1 (residue numbers 435–481). d, purified TthV0, TthV1, and chimeric V1 were analyzed by SDS-PAGE. Lane 1, TthV0; lane 2, TthV1; lane 3, V1-A010; lane 4, V1-A011; lane 5, V1-A001. e, alkyl ether sulfate-PAGE analysis of the reconstituted complexes. The isolated reconstituted complexes were subjected to alkyl ether sulfate-PAGE. The proteins were stained by Coomassie Brilliant Blue. Lane 1, TthV0V1; lane 2, TthV0; lane 3, TthV1; lane 4, the reconstituted V0-V1; lane 5, V1-A010, lane 6, the reconstituted V0-V1-A010; lane 7, V1-A011; lane 8, the reconstituted V0-V1-A011; lane 9, V1-A001; lane 10, the reconstituted V0-V1-A001.
FIGURE 2.
FIGURE 2.
Sequence alignment of the A subunits of T. thermophilus and E. hirae V0V1. The primary sequences of the A subunits of V0V1 were aligned. TthA and EhiA represent T. thermophilus (NCBI Gene ID Q72J72.1) and E. hirae (Q08636.1), respectively. NT, NB, and CT domains are shown in green, red, and blue, respectively. The P-loop (motifs A and B) is indicated by the rectangles. An arrow indicates the fusion point in V1-A010.1. An asterisk indicates same residues; a colon and period indicate high and low similarity residues, respectively.
FIGURE 3.
FIGURE 3.
Constructs for expression of chimeric V1. All expression plasmids were constructed based on the TthV1 expression plasmid (top). The genes from TthV1 and EhiV1 are colored blue and red, respectively. The numbers show the residue numbers of the fusion sites.
FIGURE 4.
FIGURE 4.
ATP hydrolysis activities by chimeric V1. The time course of ATP hydrolysis by chimeric V1 at 2 mm ATP is shown. ATP hydrolysis activity was measured by monitoring the absorbance decrease at 340 nm as described under “Experimental Procedures.” The reactions were initiated by addition of 20 μl of 1 μm enzymes without heat treatment to 2 ml of assay mixture (black lines). In addition, V1-A010 and V1-A001 were subjected to nucleotide removal treatment and then applied to the ATPase assay (red lines). mAU, milliarbitrary units.
FIGURE 5.
FIGURE 5.
Properties of chimeric V1. a, ATP hydrolysis rate catalyzed by chimeric V1 at various ATP concentrations. Kinetic values are summarized in Table 1. The red lines show fit with the Michaelis-Menten equation. b–d, ATP-driven rotation of V1-A011. Rotation was visualized under a microscope by attaching a magnetic bead to the D subunit. b, stepwise rotation of V1-A011 at 2 and 0.5 μm ATP recorded at 1,000 frames/s, respectively. Insets, centroids of the rotating bead. c and d, histogram of dwell times between successive steps at 2 μm ATP (n = 1,249; five molecules) and 0.5 μm ATP (n = 913; five molecules) fitted with a single exponential equation: kon = (3.5 ± 0.1) × 106 m−1 s−1 and kon = (5.1 ± 0.2) × 106 m−1 s−1 (mean ± S.E.). The patterns of histograms represent the data from different molecules.
FIGURE 6.
FIGURE 6.
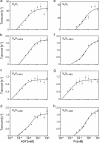
ATP synthesis by reconstituted chimeric V0V1 as a function of ADP and phosphate concentrations. The reconstitution of V0V1 and the ATP synthesis reaction were performed as described under “Experimental Procedures.” a–d, [S]-V plot of ATP synthesis rate catalyzed by reconstituted V0V1 (a), V0V1-A010 (b), V0V1-A011 (c), and V0V1-A001 (d) at various ADP concentrations in the presence of 10 mm sodium phosphate. The solid lines show fit with the Michaelis-Menten equation. e–h, [S]-V plot of ATP synthesis rate catalyzed by reconstituted V0V1 (e), V0V1-A010 (f), V0V1-A011 (g), and V0V1-A001 (h) at various phosphate concentrations in the presence of 1 mm ATP. The solid lines show fit with the Michaelis-Menten equation. The apparent kinetic values are summarized in Table 2. Error bars represent S.D.
FIGURE 7.
FIGURE 7.
Inhibition effects of phosphate on ATP hydrolysis of TthV1 and chimeric V1. ATP hydrolysis was assayed at various phosphate concentrations. TthV1 (black), V1-A010 (blue), V1-A011 (red), and V1-A001 (green) are shown. ATP hydrolysis activities are shown by relative values. Error bars represent S.E.
FIGURE 8.
FIGURE 8.
Rotation of V1-A011 carrying an 80-nm bead. a, time-averaged rotation rates of 80-nm beads at the indicated ATP concentrations. The rates of individual beads >50 (mostly >100) consecutive revolutions are shown in black and red (with 20 mm phosphate) circles. Open squares show the averaged rates. The solid line indicates the fit with the Michaelis-Menten equation: Vmax and Km are 28.3 ± 0.5 revolutions/s and 28.7 ± 2.8 μm, respectively. b, typical time courses of rotation in the presence (red lines) and absence (black lines) of 20 mm phosphate at 2 mm ATP using an 80-nm bead captured at 1000 frames/s. c and d, expanded time courses in b. The regions indicated by arrowheads at the black and red lines in b are enlarged in c and d, respectively. Histograms of angular positions and trajectories of the bead centroid, both for the indicated portion of the records, are shown in the upper and lower insets, respectively. deg, degrees. Error bars represent S.D.
FIGURE 9.
FIGURE 9.
Structure of the A subunits from TthV1 and EhiV1. a and b, superimposed structures at the N-terminal β-barrel (βb) of three structures of TthV1-A (Protein Data Bank code 3W3A) and EhiV1-A (Protein Data Bank code 3VR6) subunits, respectively. The N-terminal β-barrel and the first (H1) and second (H2) helices of CT domain are shown in the ribbon representation. c and d, these structures are superimposed at the P-loop of the A subunits. Residues of the A and B subunits are colored in yellow and green, respectively. c, AT (gray) and AD (color) of TthV1. d, AT1 (gray) and AT2 (color) of EhiV1. The dashed arrow indicates the direction of movement of the β-phosphate of ADP. e and f, schematic representation of the nucleotide-binding sites of AD and AT of TthV1. The distances (Å) between atoms in TthAD (e) and TthAT (f) are represented by the black dotted lines. The blue dotted lines indicate possible H-bonds.
FIGURE 10.
FIGURE 10.
Interaction between NB and CT domains in TthV1-A subunits. The structures of TthAT (gray) and TthAD (color) were superimposed at the NB domain of the A subunit (residues 190–428). NB and CT domains are colored yellow and pink, respectively. H1 and H2 indicate the first and second helix of CT domain, respectively. a, upper part of the CT domain in TthAT (gray) and TthAD (color). b, lower part of the CT domain of TthAT (gray) and TthAD (color). Cyan lines show possible H-bonds in TthAT and TthAD.

References

    1. Forgac M. (2007) Vacuolar ATPases: rotary proton pumps in physiology and pathophysiology. Nat. Rev. Mol. Cell Biol. 8, 917–929 - PubMed
    1. Muench S. P., Trinick J., Harrison M. A. (2011) Structural divergence of the rotary ATPases. Q. Rev. Biophys. 44, 311–356 - PubMed
    1. Yokoyama K., Imamura H. (2005) Rotation, structure, and classification of prokaryotic V-ATPase. J. Bioenerg. Biomembr. 37, 405–410 - PubMed
    1. Murata T., Igarashi K., Kakinuma Y., Yamato I. (2000) Na+ binding of V-type Na+-ATPase in Enterococcus hirae. J. Biol. Chem. 275, 13415–13419 - PubMed
    1. Imamura H., Nakano M., Noji H., Muneyuki E., Ohkuma S., Yoshida M., Yokoyama K. (2003) Evidence for rotation of V1-ATPase. Proc. Natl. Acad. Sci. U.S.A. 100, 2312–2315 - PMC - PubMed

Publication types

MeSH terms

LinkOut - more resources