. 2014 Jan 3;289(1):286-98.
doi: 10.1074/jbc.M113.518373. Epub 2013 Nov 18.

Chaperones GroEL/GroES accelerate the refolding of a multidomain protein through modulating on-pathway intermediates

Affiliations

Chaperones GroEL/GroES accelerate the refolding of a multidomain protein through modulating on-pathway intermediates

Vinay Dahiya et al. J Biol Chem. .

Abstract

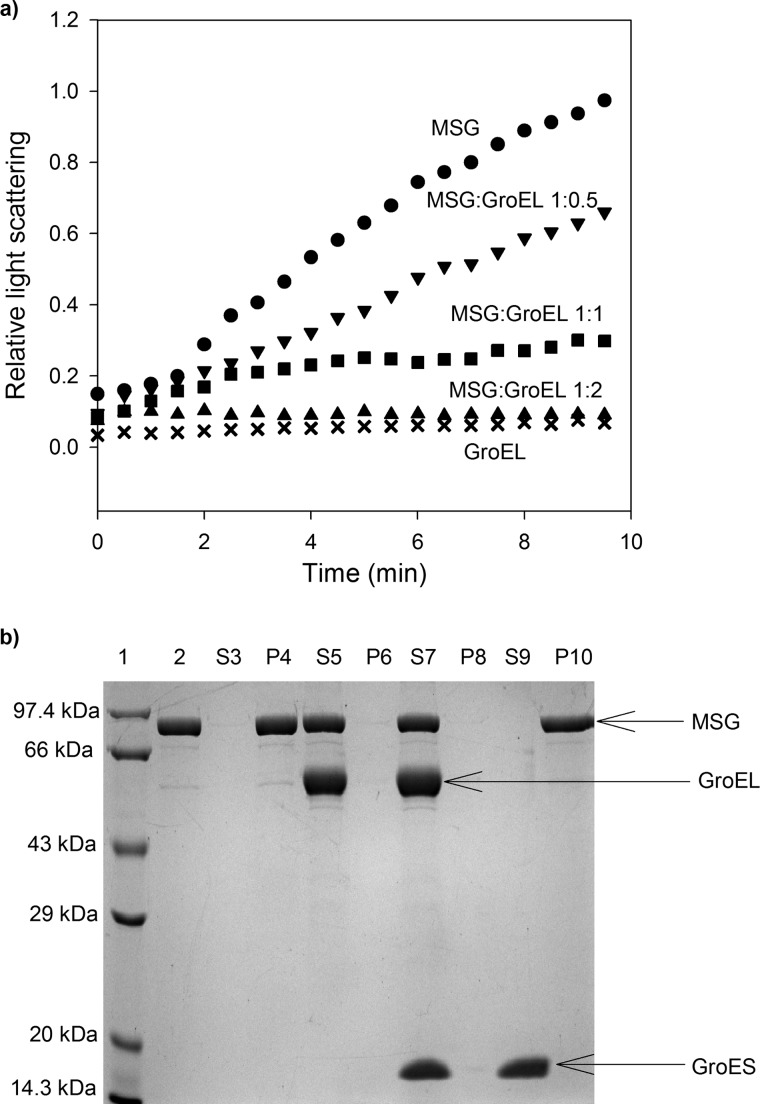
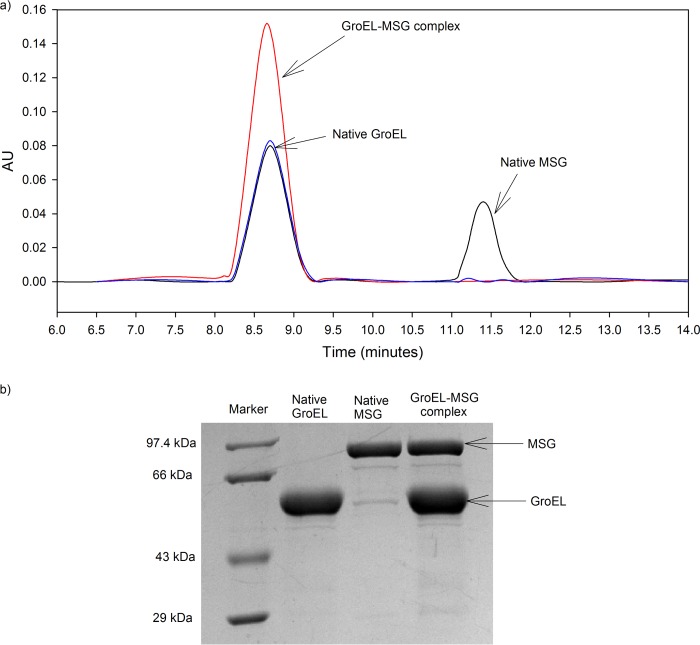
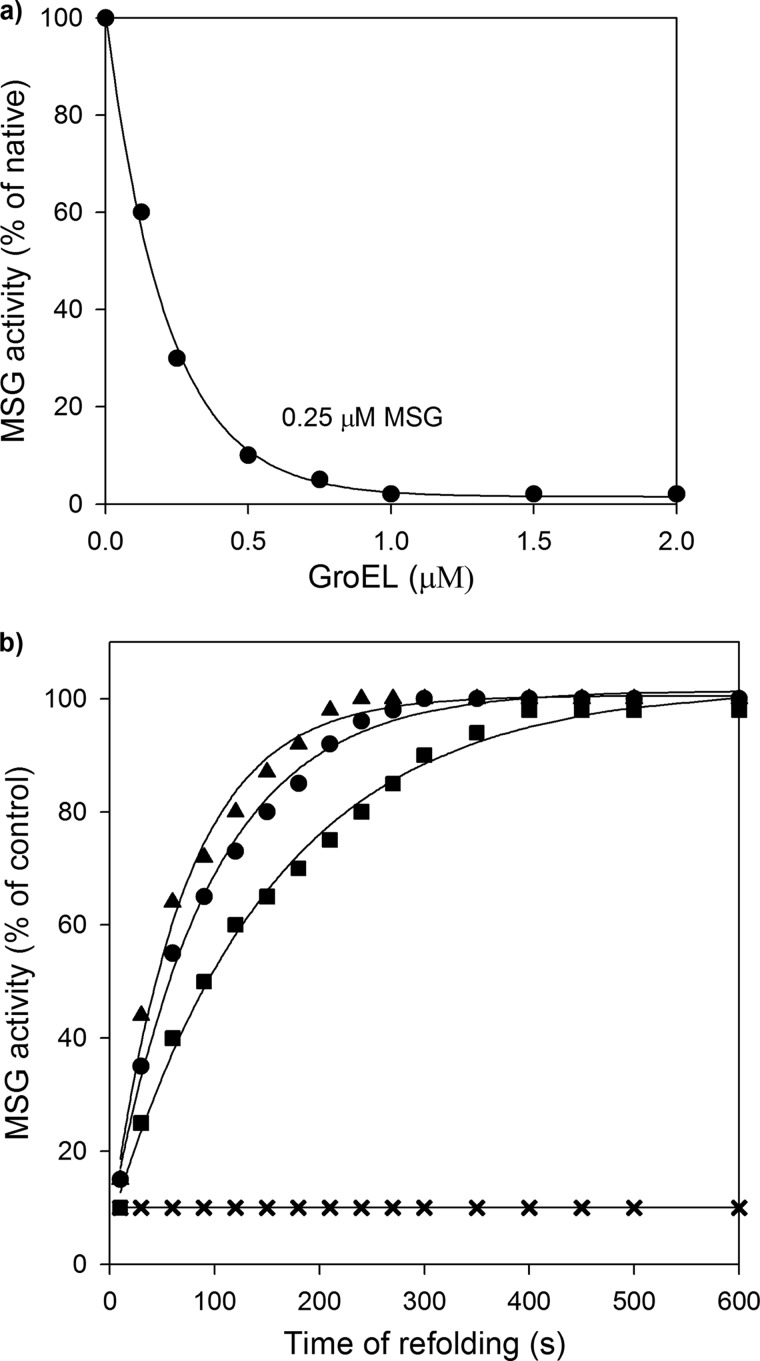
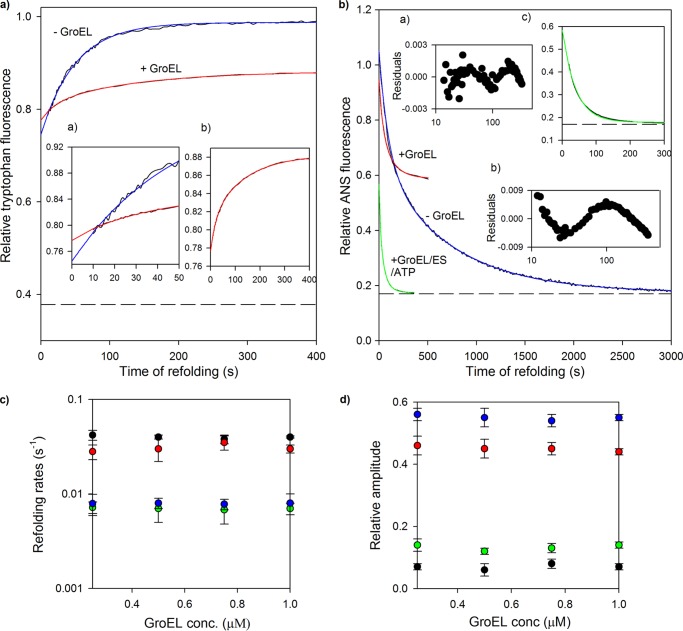
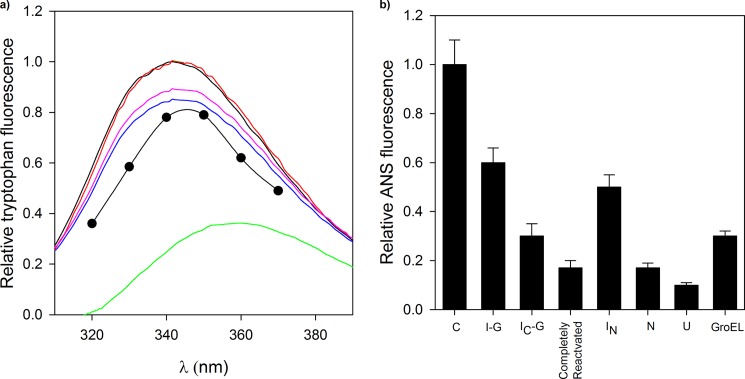
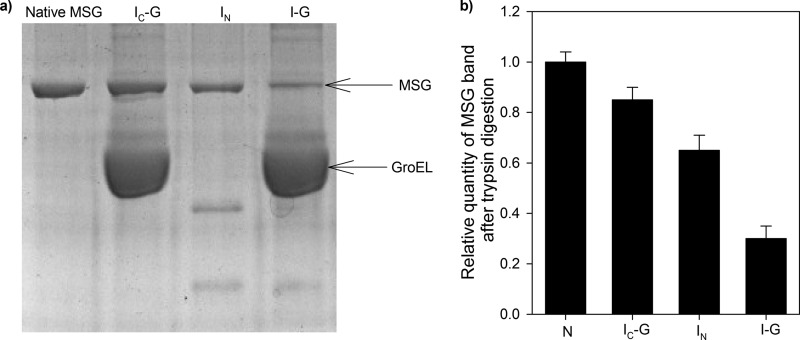
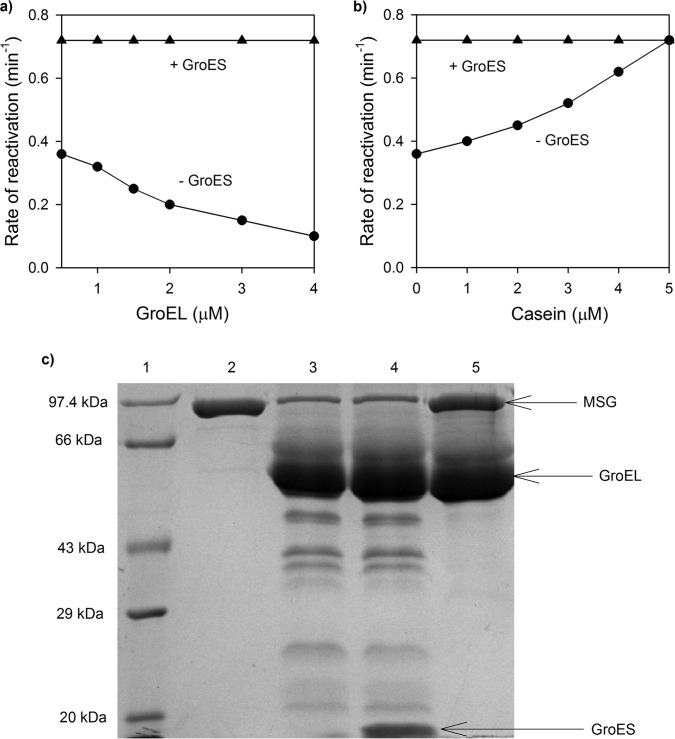
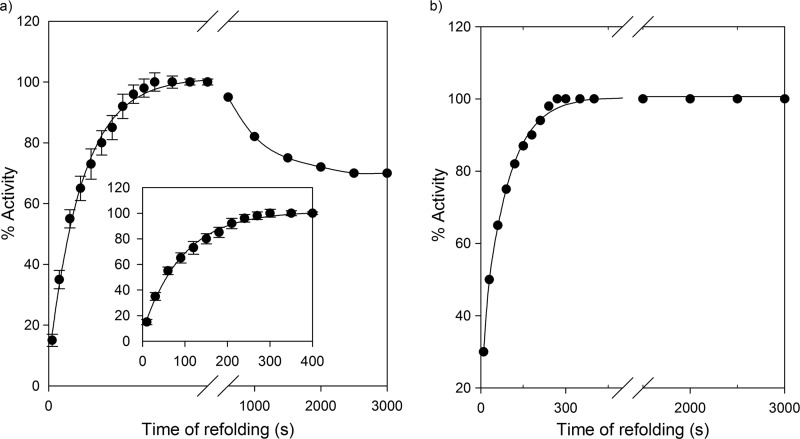
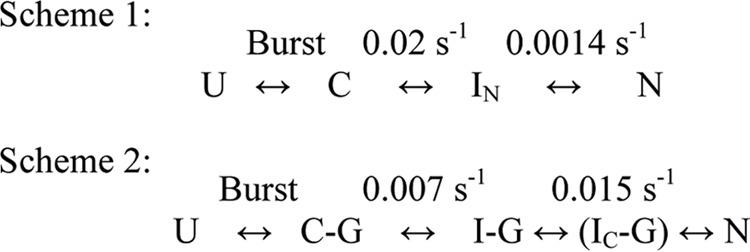
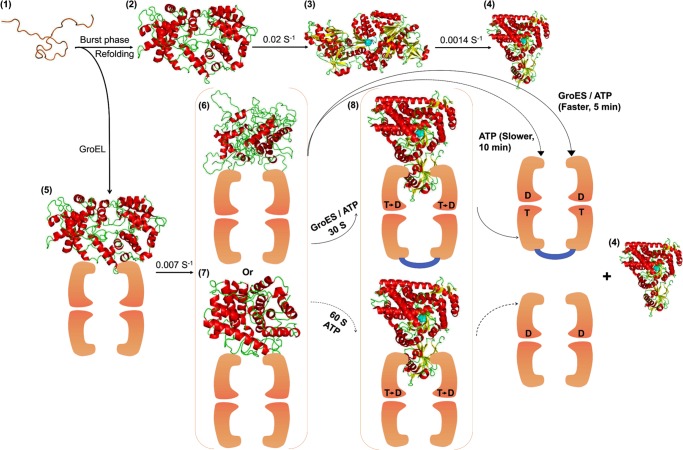
Despite a vast amount information on the interplay of GroEL, GroES, and ATP in chaperone-assisted folding, the molecular details on the conformational dynamics of folding polypeptide during its GroEL/GroES-assisted folding cycle is quite limited. Practically no such studies have been reported to date on large proteins, which often have difficulty folding in vitro. The effect of the GroEL/GroES chaperonin system on the folding pathway of an 82-kDa slow folding protein, malate synthase G (MSG), was investigated. GroEL bound to the burst phase intermediate of MSG and accelerated the slowest kinetic phase associated with the formation of native topology in the spontaneous folding pathway. GroEL slowly induced conformational changes on the bound burst phase intermediate, which was then transformed into a more folding-compatible form. Subsequent addition of ATP or GroES/ATP to the GroEL-MSG complex led to the formation of the native state via a compact intermediate with the rate several times faster than that of spontaneous refolding. The presence of GroES doubled the ATP-dependent reactivation rate of bound MSG by preventing multiple cycles of its GroEL binding and release. Because GroES bound to the trans side of GroEL-MSG complex, it may be anticipated that confinement of the substrate underneath the co-chaperone is not required for accelerating the rate in the assisted folding pathway. The potential role of GroEL/GroES in assisted folding is most likely to modulate the conformation of MSG intermediates that can fold faster and thereby eliminate the possibility of partial aggregation caused by the slow folding intermediates during its spontaneous refolding pathway.

Keywords: Aggregation; Folding Intermediates; GroEL; Large Protein Folding; Malate Synthase G; Molecular Chaperone; Protein Conformation; Protein Dynamics; Protein Folding; Refolding Kinetics.


Figures

FIGURE 1.
FIGURE 1.
Prevention of thermal aggregation of MSG by GroEL. Aggregation of MSG was monitored by light scattering and SDS-PAGE analysis of supernatant-pellet fractions. a, native MSG at a concentration of 1 μm was incubated in the absence (●) and in the presence of different molar ratios of GroEL in 20 mm Tris buffer, pH 7.8, 10 mm MgCl2, 10 mm KCl at 55 °C. ▾, 0.5:1 GroEL/MSG; ■, 1:1 GroEL/MSG; ▴, 2:1 GroEL/MSG; ×, GroEL only. Aggregation kinetics was monitored by light scattering at 500 nm and normalized with the highest value. b, SDS-PAGE showing supernatant (S)-pellet (P) fractions of heat-treated MSG with and without chaperones. MSG at a concentration of 1 μm was incubated with 2 μm GroEL at 55 °C for 10 min and centrifuged, and supernatant-pellet fractions were run on a 12% SDS gel after normalization. When present, GroES was added in a 2:1 molar ratio to GroEL. Lane 1, protein molecular mass marker; lane 2, native MSG; lane 3, supernatant fraction of heat-treated MSG in the absence of GroEL (S3); lane 4, pellet fraction of S3; lane 5, supernatant fraction of heat-treated MSG in the presence of GroEL (S5); lane 6, pellet fraction of S5; lane 7, supernatant fraction of heat-treated MSG in the presence of GroEL/ES (S7); lane 8, pellet fraction of S7; lane 9, supernatant fraction of heat-treated MSG in the presence of only GroES (S9); lane 10, pellet fraction of S9.
FIGURE 2.
FIGURE 2.
GroEL forms stable binary complex with MSG. A binary complex of MSG and GroEL was formed as described under “Experimental Procedures.” a, gel filtration profiles monitored by absorbance measurements at 280 nm. AU, absorbance units. Native GroEL and native MSG elution peaks (black), GroEL preheated at 55 °C for 10 min (blue peak), and GroEL-MSG complex (red peak) are shown. GroEL and MSG concentration used were 2 and 1 μm, respectively. b, SDS-PAGE analysis of complex formation. Lane 1, medium range protein molecular mass marker (14.3–97.4 kDa); lane 2, native GroEL fraction; lane 3, native MSG fraction; lane 4, GroEL peak fraction (red peak).
FIGURE 3.
FIGURE 3.
GroEL dependent reactivation of GdnHCl denatured MSG. MSG denatured in 3 m GdnHCl was diluted in refolding buffer containing 20 mm Tris, pH 7.9, 300 mm NaCl, 10 mm MgSO4, 10 mm KCl, 1 mm tris(2-carboxyethyl)phosphine hydrochloride, 10% glycerol in the presence and absence of GroEL such that the final GdnHCl concentration was 0.1 m. a, inhibition of spontaneous refolding by GroEL when MSG is refolded in the presence of different molar ratios of GroEL. b, time course of GroEL-, GroEL/GroES-, and GroEL/ATP-mediated refolding of MSG in vitro. MSG in 3 m GdnHCl was diluted in refolding buffer containing the indicated additions: GroEL (×), GroEL/ATP (■), GroEL/GroES/ATP (▴), and MSG only (●). At the indicated time intervals, aliquots from the refolding mixture were withdrawn and added into the activity assay mixture. Enzymatic activity was expressed as a percentage of what was obtained with an equivalent amount of native MSG in 0.1 m GdnHCl. Final MSG, GroEL, and GroES concentrations in the refolding buffer were 0.25, 0.5, and 1 μm, respectively. ATP was added at 2.5 mm. Refolding rate constants were calculated by fitting activity curves to the best fit equation. Enzymatic activity values shown are the average values from three separate experiments.
FIGURE 4.
FIGURE 4.
Folding kinetics of MSG in presence of GroEL. Refolding of MSG was monitored in the presence and absence of GroEL by intrinsic tryptophan and ANS fluorescence. MSG (0.25 μm) was refolded in the presence of 0 and 1 μm GroEL in the refolding buffer containing residual GdnHCl (0.1 m). a, refolding kinetic traces monitored by tryptophan fluorescence at 340 nm when protein was excited at 295 nm. Blue and red continuous lines represent single and double exponential fits of kinetic refolding traces of MSG in the absence and presence of GroEL, respectively. Inset a shows the first 50 s of refolding, and inset b shows the refolding kinetic trace of GroEL-bound MSG. The broken line represents fluorescence of unfolded MSG in 3 m GdnHCl. The fluorescence of the relevant concentration of GroEL was subtracted from the GroEL-containing trace, and all fluorescence values were then normalized to a value of 1 for the fluorescence of MSG at 400 s of refolding in the absence of GroEL after which no further change in tryptophan fluorescence of MSG takes place. b, ANS fluorescence-monitored refolding kinetics of MSG at 450 nm. Blue and red continuous lines represent double exponential fits of kinetic refolding traces of MSG in the absence and presence of GroEL, respectively. The blue curve was derived by diluting denatured MSG in buffer containing ANS, whereas for the red curve, ANS fluorescence was monitored with time after diluting denatured MSG in buffer containing both GroEL and ANS. The green curve depicts a double exponential fit of the reactivation of GroEL-bound MSG. Insets a and b show the residuals of the double and single exponential fits of the green curve. Reactivation kinetics of GroEL-bound MSG was followed by addition of GroES and ATP in GroEL- and ANS-containing buffer. Inset c shows the first 300 s of the reactivation kinetics of GroEL-bound MSG. The t = 0 value of the green trace represents the ANS fluorescence value of GroEL-bound MSG, which is the same as the final steady state value obtained from the red trace. The final ANS concentration was 50 μm. Fluorescence values were corrected for background fluorescence caused by ANS in reactions lacking MSG and normalized to a value of 1 for ANS fluorescence of MSG at t = 0 of refolding in the absence of GroEL. The dashed line represents ANS fluorescence of native MSG. Refolding was performed by manual mixing with a dead time of 10 s. Data for refolding of MSG in the absence of GroEL were reproduced from previous work (40) for comparison. c, tryptophan fluorescence-monitored refolding rate constants of fast phase (black circles) and slow phase (green circles) and ANS fluorescence-monitored refolding rate constants of fast phase (red circles) and slow phase (blue circles) of GroEL-assisted refolding of MSG obtained from the respective double exponential fits of refolding at different GroEL concentrations (conc.). d, effect of GroEL concentration on their corresponding relative amplitudes. Relative amplitudes of the fast and slow phases monitored by ANS fluorescence were calculated with respect to the total ANS fluorescence change observed for the red curve (i.e. relative to the sum of both fast and slow phases). For the tryptophan fluorescence change, relative amplitudes were plotted using the linearly extrapolated unfolding base line in a. Nearly 70% of the tryptophan fluorescence change occurs in the burst phase. In c and d, the error bars represent the spread of measurements made in three separate experiments.
FIGURE 5.
FIGURE 5.
Monitoring conformational changes of MSG during refolding. Different intermediates of MSG formed in the presence and absence of GroEL were characterized by recording their intrinsic tryptophan and ANS fluorescence. a, tryptophan fluorescence spectra of different conformations of MSG. Unfolded MSG (U; green curve), GroEL-bound MSG (I-G; blue curve), reactivated MSG 30 s after GroES and ATP addition (IC-G; red curve), IC-G incubated with 10 mm EDTA for 30 min at 30 °C (pink curve), and native MSG (N; black curve) are shown. The fluorescence spectra of the burst phase intermediate (C; ●) is reproduced from previous work (40). I-G represents the steady state complex of MSG with GroEL. Background fluorescence of chemically identical reactions lacking substrate proteins (due to minor impurities of GroE preparation) was subtracted. b, histogram showing ANS fluorescence of different conformations of MSG. C and IN refer to the burst phase and functional intermediates, respectively, of MSG formed in spontaneous refolding as described in the text. Completely reactivated MSG is formed 5 min after GroES and ATP addition. The rest of the conformations are described in a. ANS fluorescence values of transient intermediates of MSG (C, IN, and IC-G) are derived from the refolding kinetic curves in Fig. 4b as described in the text. ANS fluorescence of GroEL-bound MSG (I-G), native (N) and unfolded MSG (U), and completely reactivated MSG were recorded by incubating them with 50 μm ANS for 5 min at 25 °C. Error bars represent the spread of measurements from three separate experiments.
FIGURE 6.
FIGURE 6.
Trypsin digestion assay. Various conformations of MSG were tested by trypsin digestion assay. GroEL-MSG complex was prepared by diluting denatured MSG in GroEL-containing buffer in a 1:4 ratio to GroEL and incubating for 10 min at 25 °C and then dividing it into two parts. The first sample was treated with trypsin 60 s after ATP addition, and in the second sample, no ATP was added before trypsin addition. ATP-mediated reactivation of MSG was stopped after 60 s (IC-G) by addition of 10 mm EDTA following which trypsin was added. For sample without GroEL, trypsin was added 5 min after initiation of refolding (IN). Trypsin treatment was performed at 37 °C for 15 min using a 1:100 (w/w) ratio of trypsin to MSG. Native MSG was used as a control and was treated with trypsin in the same way. Trypsin digestion was stopped by boiling the samples in SDS loading dye for 5 min. a, 10% SDS-PAGE gel showing trypsin-digested mixtures. Lane 1, native MSG; lane 2, IC-G; lane 3, IN; lane 4, GroEL-bound MSG (I-G). b, histogram showing relative quantities of MSG band in each case. Band density was taken as a measure of proteolytic resistance of MSG. The same amount of MSG was loaded in all the lanes so its corresponding band intensities in each of the lanes can be directly compared with each other. Error bars represent the spread of measurements from three separate experiments.
FIGURE 7.
FIGURE 7.
Effect of GroES on reactivation rate of GroEL bound MSG. MSG reactivation was monitored by measuring regain of enzymatic activity by MSG upon GroES/ATP addition. a, influence of increasing GroEL concentration on the MSG reactivation rate in the presence and absence of GroES. GroEL-MSG complex was generated as described previously (GroEL/MSG, 0.5:0.25 μm). After 10 min, increasing amounts of GroEL (total concentrations of GroEL are indicated) were added in the presence (▴) or absence (●) of GroES. GroES was always added in a 2:1 molar ratio to GroEL. Reactivation was initiated by adding ATP. b, effect of casein on MSG reactivation rates. Casein (0–5 μm) was added 5 min after GroES addition (1 μm) in GroES-containing reactions. After further incubation for 5 min, ATP (2.5 mm) was added. Rates in each case were calculated from their corresponding activity curves just like rates in Fig. 3b. c, SDS-PAGE showing that GroES does not encapsulate GroEL-bound MSG. GroES was added in a 2-fold molar excess to GroEL-MSG complex (MSG/GroEL/GroES, 1:2:4 μm) in the presence of ADP followed by trypsin digestion after which samples were run on a 10% SDS-polyacrylamide gel. Trypsin treatment was performed in the same way as described previously. Lane 1, medium range protein molecular mass marker; lane 2, trypsin-treated native MSG used as control; lane 3, GroEL-MSG complex treated with trypsin; lane 4, GroEL-MSG-GroES and ADP treated with trypsin; lane 5, GroEL-MSG complex without trypsin.
FIGURE 8.
FIGURE 8.
GroEL/ES inhibit aggregation during refolding of GdnHCl denatured MSG. Refolding of MSG was carried out such that its final concentration was 1 μm in the presence and absence of 2 μm GroEL and monitored by enzymatic activity as described under “Experimental Procedures.” The final GdnHCl concentration in refolding buffer was kept at 0.1 m. The indicated time points correspond to the time after which aliquots from the refolding mixture were added to the activity assay mixture. a, spontaneous refolding of MSG. Data were reproduced from previous work (40) for comparison. Error bars represent measurements from three separate experiments. b, GroEL/ES-assisted refolding showing no loss in enzymatic activity with time. The black continuous line is the single exponential fit to data points.
FIGURE 9.
FIGURE 9.
Folding mechanisms of MSG in the absence (Scheme 1) and presence (Scheme 2) of GroEL. Scheme 1 represents the mechanism of refolding of 0.25 μm MSG in 0.1 m GdnHCl and 20 mm Tris, pH 7.9, 300 mm NaCl, 10 mm MgSO4, 10 mm KCl, 1 mm tris(2-carboxyethyl)phosphine hydrochloride, 10% glycerol and is reproduced from previous work (40). Scheme 2 represents the mechanism of refolding of 0.25 μm MSG in the same buffer in the presence of 1 μm GroEL. U, unfolded MSG; C, burst phase intermediate; C-G, burst phase intermediate of MSG bound to GroEL; IN, functional intermediate of MSG having the same enzymatic activity and tryptophan fluorescence as native protein formed in spontaneous refolding; I-G, steady state GroEL-bound MSG; IC-G, compact intermediate bound to GroEL formed 30 s after GroES/ATP addition and 60 s after ATP addition to GroEL-MSG complex (I-G); N, native MSG.
FIGURE 10.
FIGURE 10.
GroEL/GroES-assisted folding model of MSG. The burst phase intermediate of MSG, C (2), is captured by GroEL (orange colored) upon dilution from GdnHCl-denatured MSG (1) to form GroEL-MSG complex, C-G (5). This binding induces minor structural rearrangements in C-G at a slow rate to give rise to a more folding-compatible state, I-G (6 and 7); I-G could be more unfolded (6) or more folded (7) than C-G. Further addition of GroES/ATP or ATP releases the GroEL-bound form of MSG (I-G), which folds to the native state (4) via formation of a compact intermediate, IC-G (8), that is structurally quite close to the native MSG. GroES (shown in blue) binds in trans to the folding polypeptide and doubles the ATP-dependent reactivation rate. Spontaneous refolding (1–4) proceeds through the functional intermediate, IN (3), of which conversion to the native MSG (4) is the slowest step in the MSG refolding pathway. GroEL-mediated folding averts this slowest kinetic phase by channeling the burst phase intermediate of MSG, C (2), to a different folding route (5–8). T and D represent ATP and ADP, respectively. The active site is depicted in cyan. The intermediate IC-G (8) is the most compact of all the intermediates.

Similar articles

Cited by

References

    1. Fenton W. A., Horwich A. L. (1997) GroEL-mediated protein folding. Protein Sci. 6, 743–760 - PMC - PubMed
    1. Horwich A. L., Farr G. W., Fenton W. A. (2006) GroEL-GroES-mediated protein folding. Chem. Rev. 106, 1917–1930 - PubMed
    1. Lin Z., Rye H. S. (2006) GroEL-mediated protein folding: making the impossible, possible. Crit. Rev. Biochem. Mol. Biol. 41, 211–239 - PMC - PubMed
    1. Horwich A. L., Fenton W. A., Chapman E., Farr G. W. (2007) Two families of chaperonin: physiology and mechanism. Annu. Rev. Cell Dev. Biol. 23, 115–145 - PubMed
    1. Noivirt-Brik O., Unger R., Horovitz A. (2007) Low folding propensity and high translation efficiency distinguish in vivo substrates of GroEL from other Escherichia coli protein. Bioinformatics 23, 3276–3279 - PubMed

Publication types

MeSH terms

LinkOut - more resources