

Greenland ice sheet motion insensitive to exceptional meltwater forcing
- PMID: 24248343
- PMCID: PMC3856804
- DOI: 10.1073/pnas.1315843110
Greenland ice sheet motion insensitive to exceptional meltwater forcing
Abstract
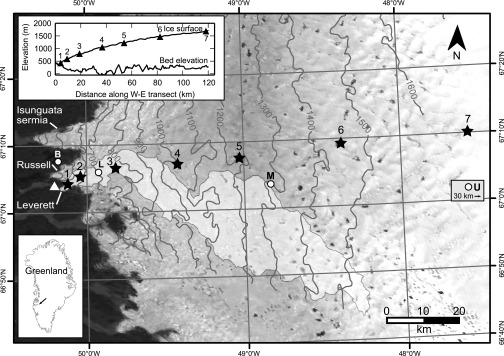
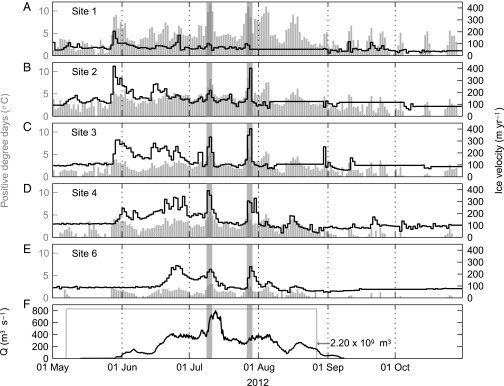
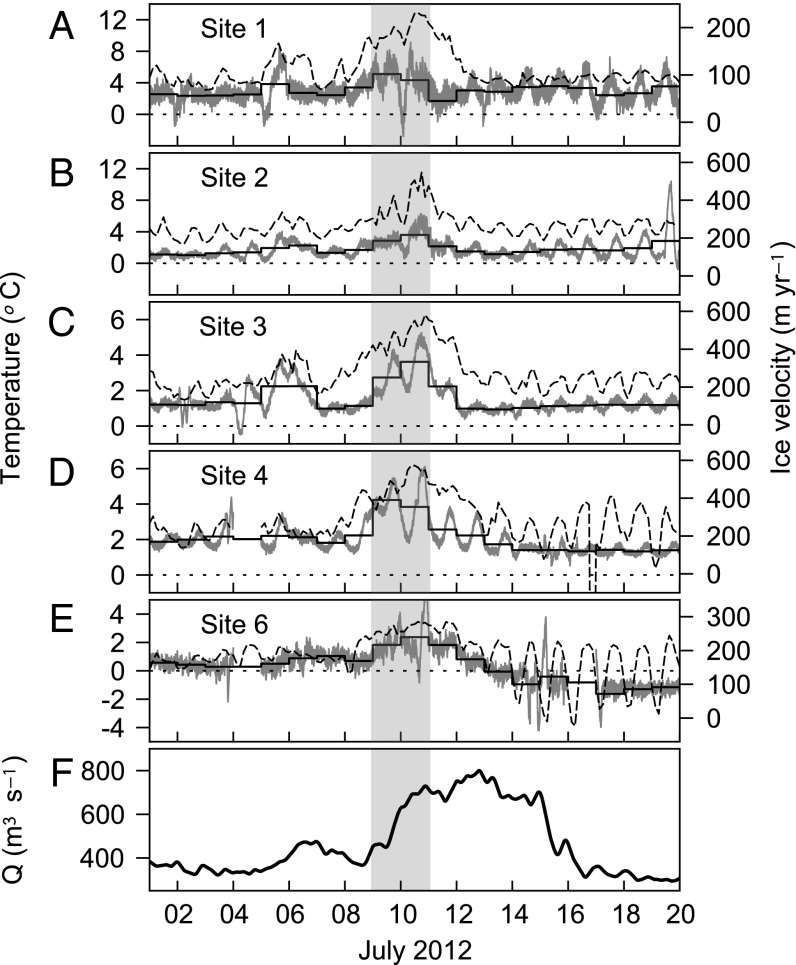
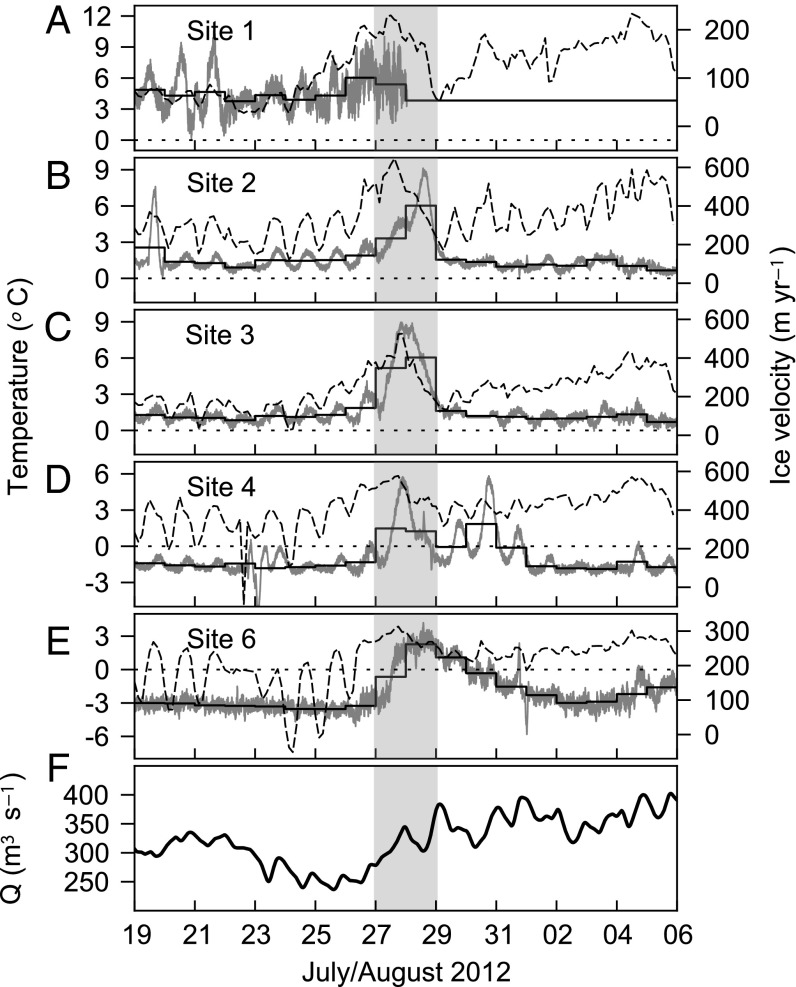
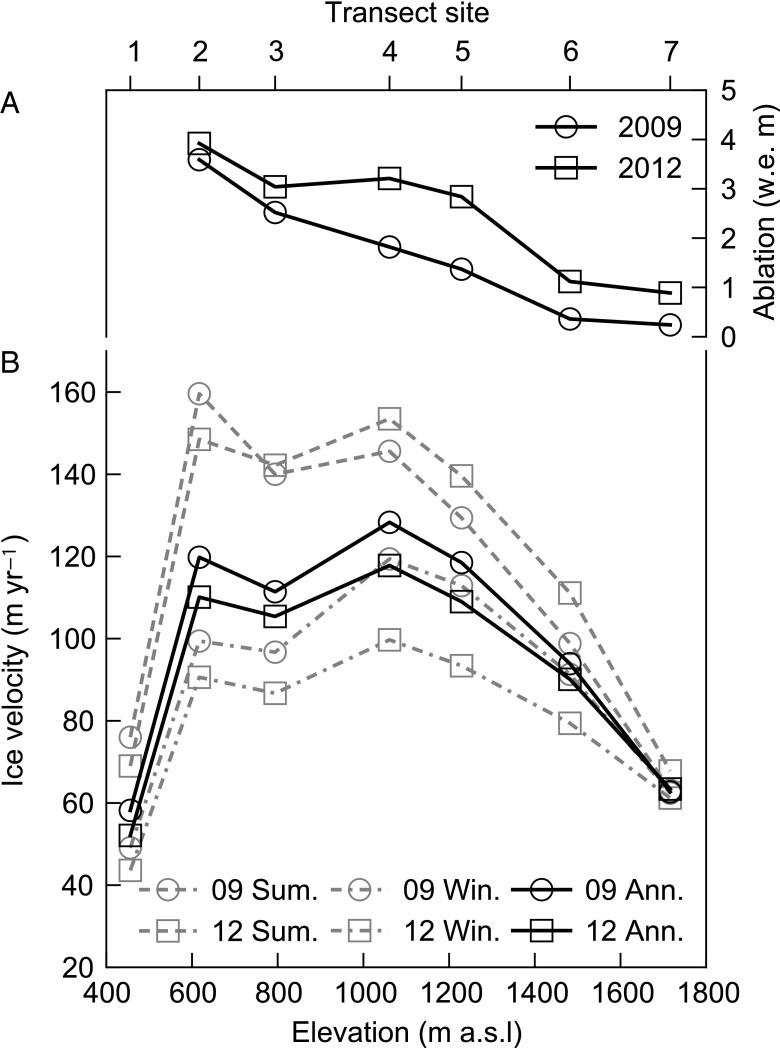
Changes to the dynamics of the Greenland ice sheet can be forced by various mechanisms including surface-melt-induced ice acceleration and oceanic forcing of marine-terminating glaciers. We use observations of ice motion to examine the surface melt-induced dynamic response of a land-terminating outlet glacier in southwest Greenland to the exceptional melting observed in 2012. During summer, meltwater generated on the Greenland ice sheet surface accesses the ice sheet bed, lubricating basal motion and resulting in periods of faster ice flow. However, the net impact of varying meltwater volumes upon seasonal and annual ice flow, and thus sea level rise, remains unclear. We show that two extreme melt events (98.6% of the Greenland ice sheet surface experienced melting on July 12, the most significant melt event since 1889, and 79.2% on July 29) and summer ice sheet runoff ~3.9 σ above the 1958-2011 mean resulted in enhanced summer ice motion relative to the average melt year of 2009. However, despite record summer melting, subsequent reduced winter ice motion resulted in 6% less net annual ice motion in 2012 than in 2009. Our findings suggest that surface melt-induced acceleration of land-terminating regions of the ice sheet will remain insignificant even under extreme melting scenarios.
Keywords: global positioning systems; ice sheet dynamics; ice sheet hydrology; ice sheet melt.
Conflict of interest statement
The authors declare no conflict of interest.
Figures
References
-
- Rignot E, Velicogna I, van den Broeke MR, Monaghan A, Lenaerts J. Acceleration of the contribution of the Greenland and Antarctic ice sheets to sea level rise. Geophys Res Lett. 2011;38:1–5.
-
- Shepherd A, et al. A reconciled estimate of ice-sheet mass balance. Science. 2012;338(6111):1183–1189. - PubMed
-
- Sasgen I, et al. Timing and origin of recent regional ice-mass loss in Greenland. Earth Planet Sci Lett. 2012;333:293–303.
-
- Hanna E, et al. Greenland ice sheet surface mass balance 1870 to 2010 based on twentieth century reanalysis, and links with global climate forcing. J Geophys Res. 2011;116:D24121.
-
- Hanna E, Mernild SH, Cappelen J, Steffen K. Recent warming in Greenland in a long-term instrumental (18812012) climatic context: I. Evaluation of surface air temperature records. Environ Res Lett. 2012;7:045404.
Publication types
MeSH terms
LinkOut - more resources
Full Text Sources
Other Literature Sources
