

Gas production in the Barnett Shale obeys a simple scaling theory
- PMID: 24248376
- PMCID: PMC3856843
- DOI: 10.1073/pnas.1313380110
Gas production in the Barnett Shale obeys a simple scaling theory
Abstract
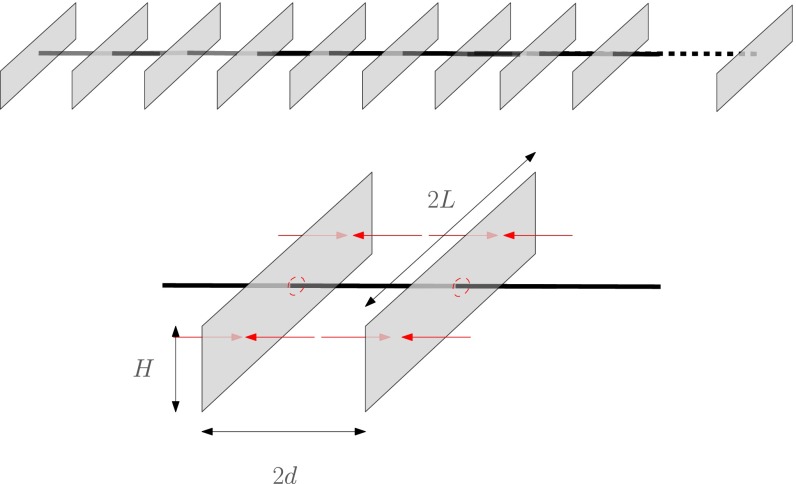
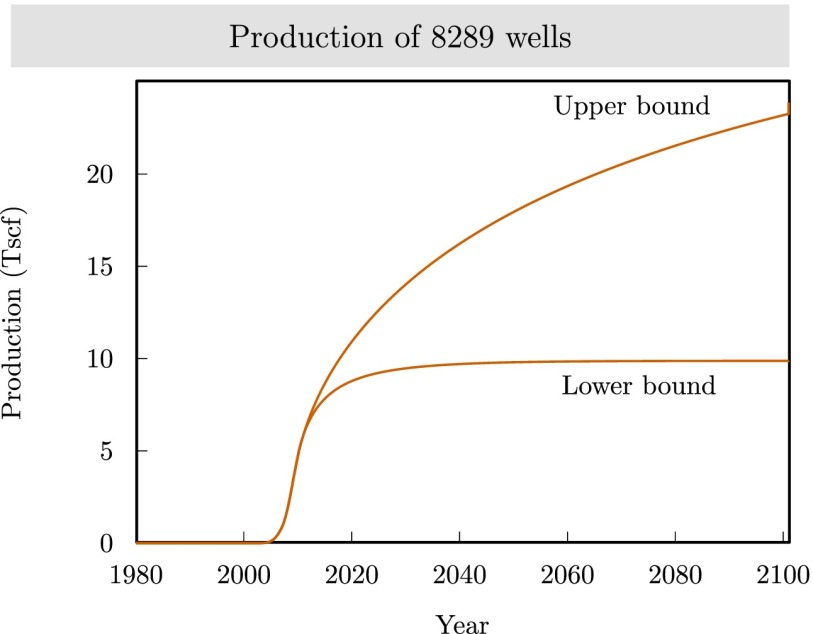
Natural gas from tight shale formations will provide the United States with a major source of energy over the next several decades. Estimates of gas production from these formations have mainly relied on formulas designed for wells with a different geometry. We consider the simplest model of gas production consistent with the basic physics and geometry of the extraction process. In principle, solutions of the model depend upon many parameters, but in practice and within a given gas field, all but two can be fixed at typical values, leading to a nonlinear diffusion problem we solve exactly with a scaling curve. The scaling curve production rate declines as 1 over the square root of time early on, and it later declines exponentially. This simple model provides a surprisingly accurate description of gas extraction from 8,294 wells in the United States' oldest shale play, the Barnett Shale. There is good agreement with the scaling theory for 2,057 horizontal wells in which production started to decline exponentially in less than 10 y. The remaining 6,237 horizontal wells in our analysis are too young for us to predict when exponential decline will set in, but the model can nevertheless be used to establish lower and upper bounds on well lifetime. Finally, we obtain upper and lower bounds on the gas that will be produced by the wells in our sample, individually and in total. The estimated ultimate recovery from our sample of 8,294 wells is between 10 and 20 trillion standard cubic feet.
Keywords: energy resources; fracking; hydrofracturing; scaling laws; shale gas.
Conflict of interest statement
The authors declare no conflict of interest.
Figures
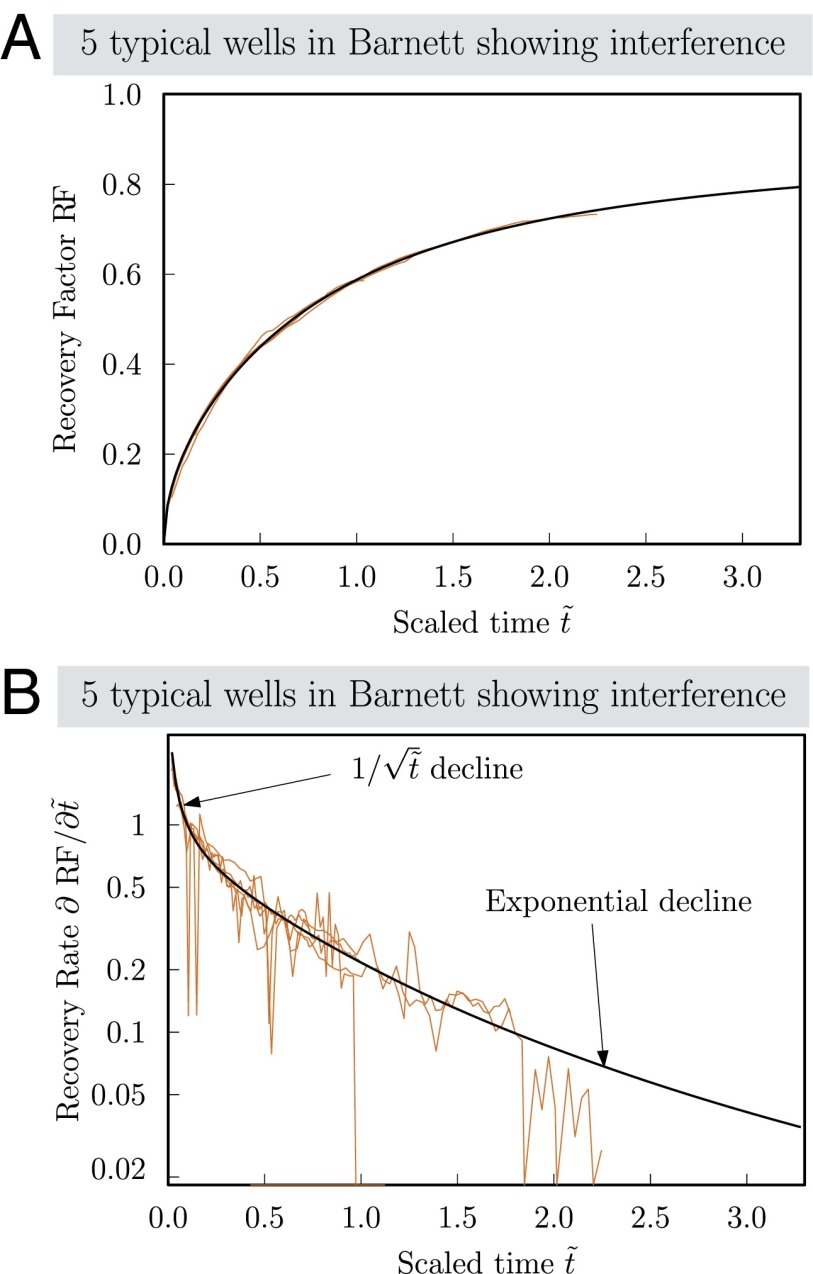
 vs. dimensionless time computed from the scaling solution (black) compared with five typical wells (burnt orange). The fracture pressure pf is 500 psi, and the initial reservoir pressure pi is 3,500 psi. (B) Dimensionless well production rate
  vs. dimensionless time (black) under the same conditions compared with the same five typical wells (burnt orange). Production rates of individual wells are noisy, although cumulative production matches the scaling function well. Because the production rate becomes linear on a semilog plot, production decline is exponential for
  .
.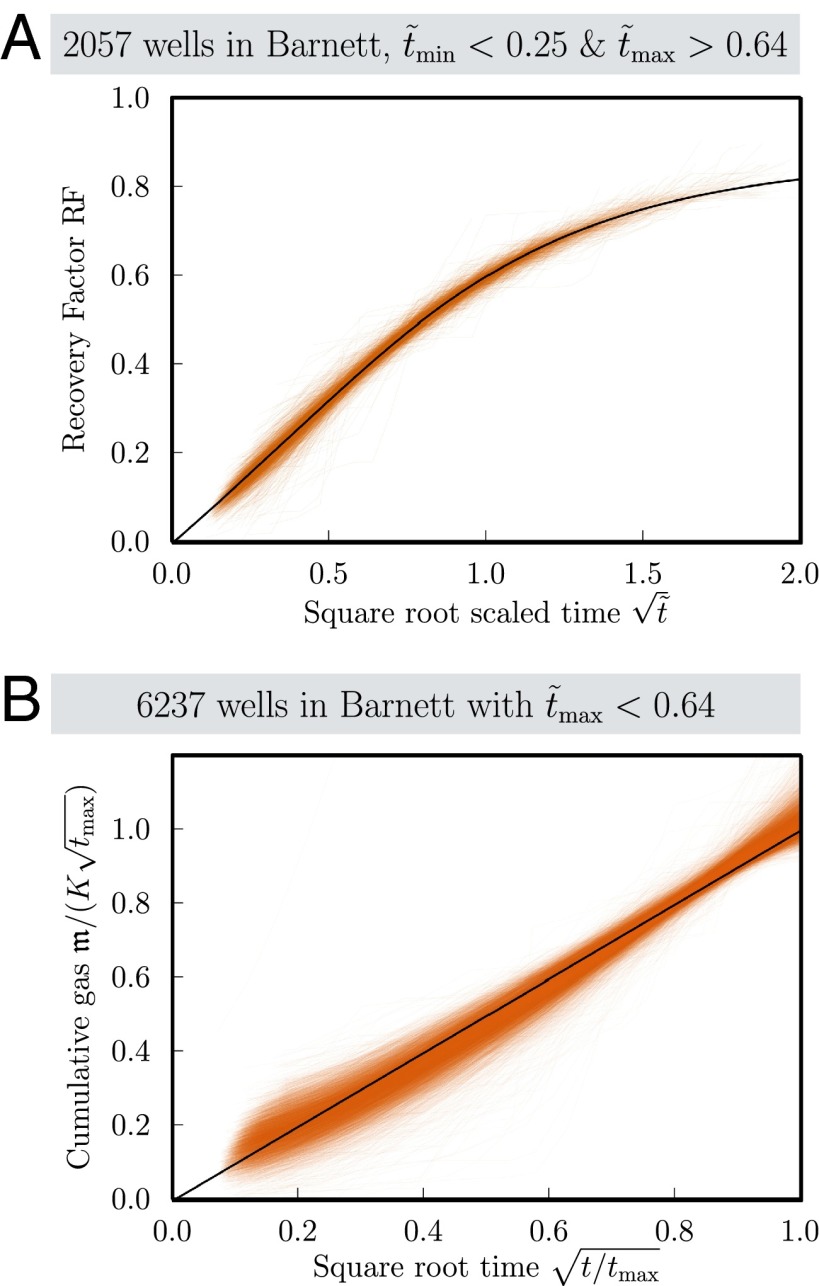
 starts below 0.25 and reaches 0.64 or more. The burnt orange curves give the scaled production of each well, and the black curve is the scaling function. Overall agreement is satisfactory. (B) Time history of 6,237 wells in the Barnett Shale for which the scaled maximum time comes out as
  (burnt orange). These wells are too young to trust our estimate of the interference time τ; therefore, we simply compare them with a square root function (black line). Time is scaled by the maximum time
  reached for each well, and production m is scaled by
  .
.
Comment in
-
Forecasting long-term gas production from shale.Proc Natl Acad Sci U S A. 2013 Dec 3;110(49):19660-1. doi: 10.1073/pnas.1319578110. Epub 2013 Nov 25. Proc Natl Acad Sci U S A. 2013. PMID: 24277849 Free PMC article. No abstract available.
References
-
- Birol F. Golden Rules for a Golden Age of Gas—World Energy Outlook Special Report on Unconventional Gas. Paris: IEA; 2012.
-
- Vidic RD, Brantley SL, Vandenbossche JM, Yoxtheimer D, Abad JD. Impact of shale gas development on regional water quality. Science. 2013;340(6134):1235009. - PubMed
-
- Hughes JD. Energy: A reality check on the shale revolution. Nature. 2013;494(7437):307–308. - PubMed
-
- Arps JJ. Analysis of decline curves. American Institute of Mining Engineers Petroleum Transactions. 1945;160:228–247.
Publication types
MeSH terms
Substances
LinkOut - more resources
Full Text Sources
Other Literature Sources
Molecular Biology Databases
