. 2015 May;25(5):1176-87.
doi: 10.1093/cercor/bht312. Epub 2013 Nov 17.

Consistent anterior-posterior segregation of the insula during the first 2 years of life

Affiliations

Consistent anterior-posterior segregation of the insula during the first 2 years of life

Sarael Alcauter et al. Cereb Cortex. 2015 May.

Abstract

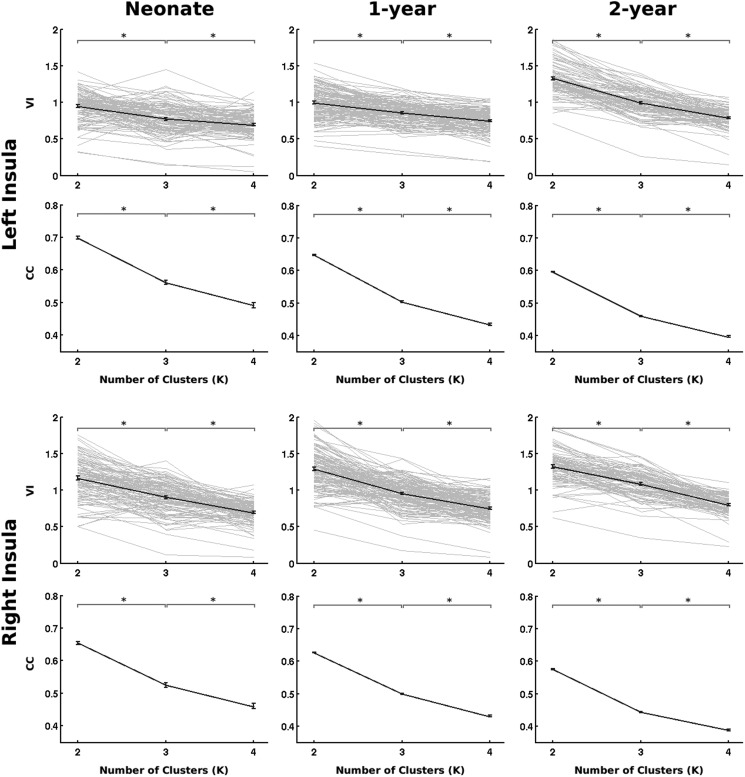
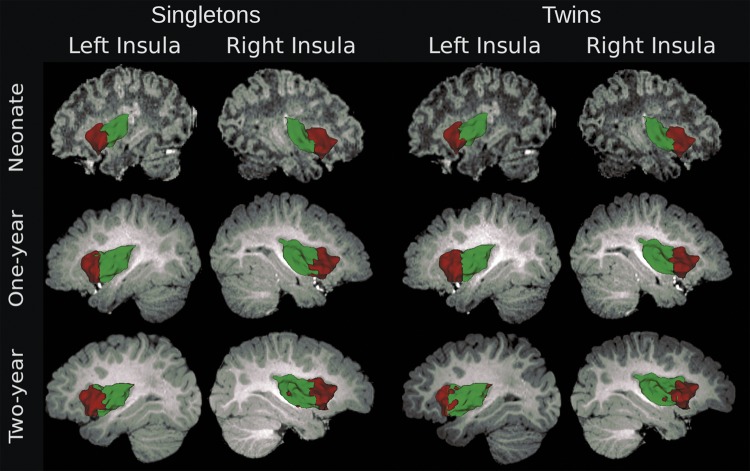
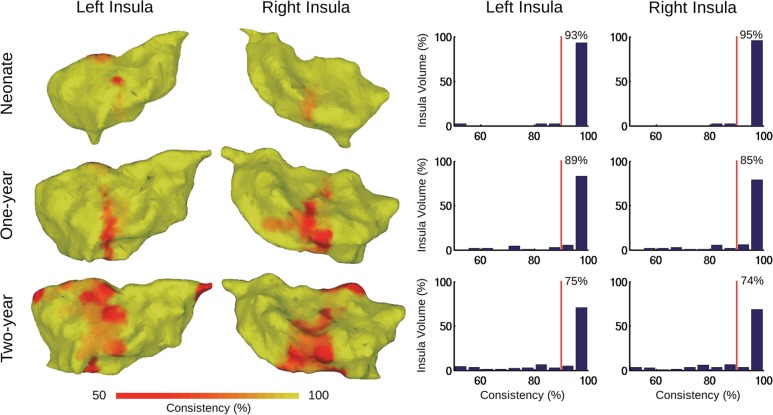
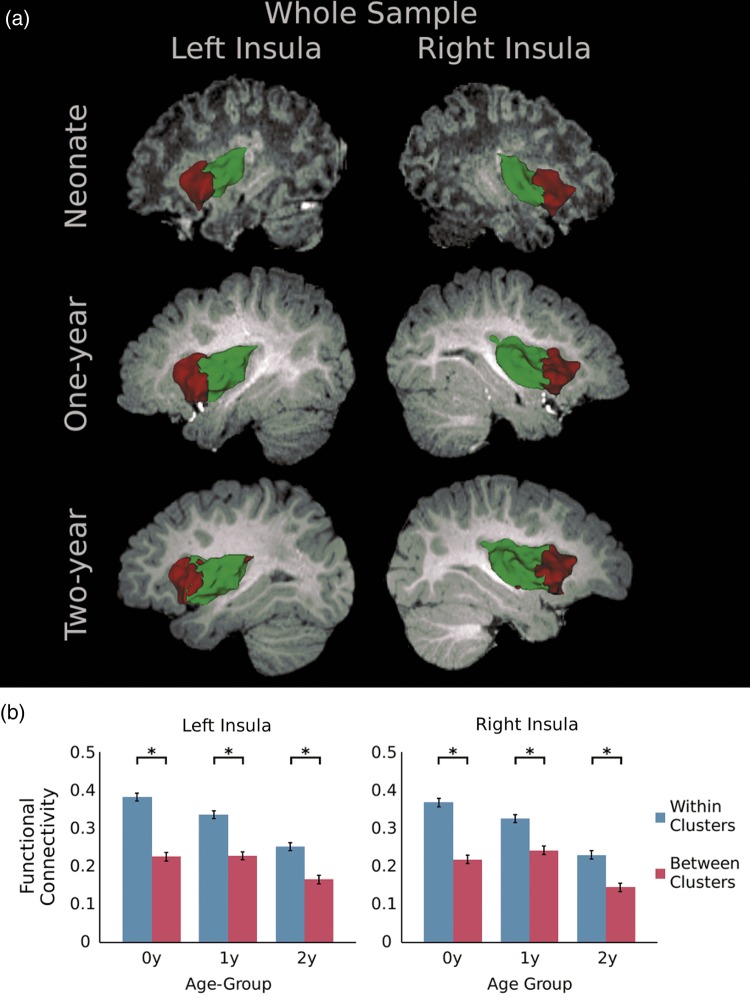
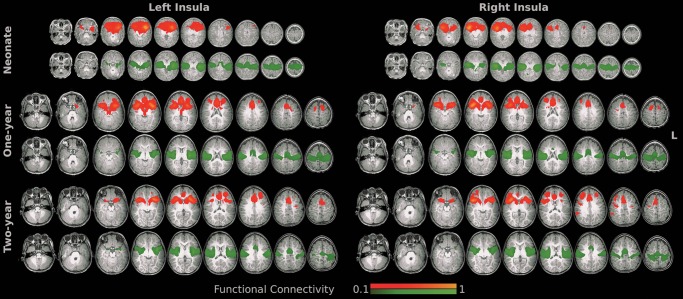
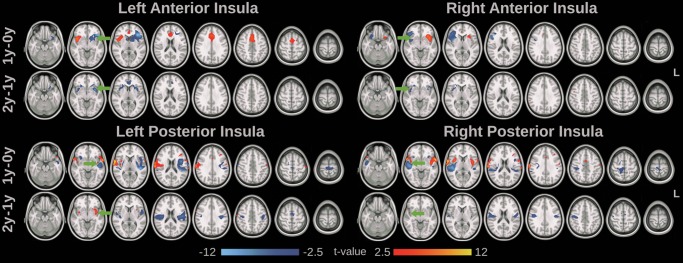
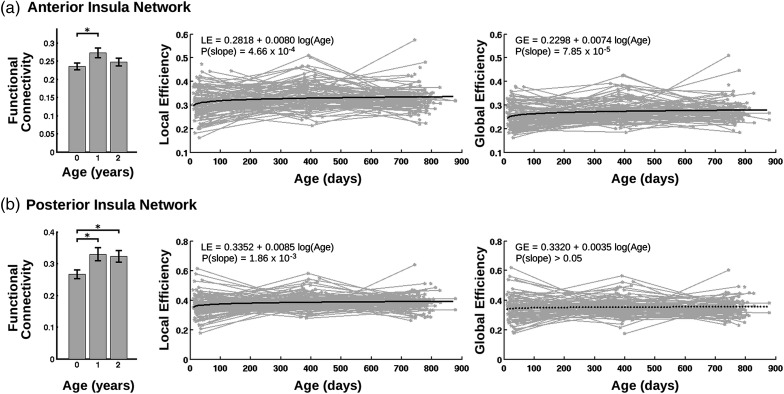
The human insula is a complex region characterized by heterogeneous cytoarchitecture, connectivity, and function. Subregional parcellation of the insula in adults has revealed an interesting anterior-posterior subdivision pattern that is highly consistent with its functional differentiation. However, the development of the insula's subregional segregation during the first 2 years of life remains unknown. The aim of this study was to test the hypothesis that similar segregation of the insula exists during this critical time period based on the resting-state functional magnetic resonance imaging study of a large cohort of infants (n = 143) with longitudinal scans. Our results confirmed a consistent anterior-posterior subdivision of the insula during the first 2 years of life with dissociable connectivity patterns associated with each cluster. Specifically, the anterior insula coupled more with frontal association areas, whereas the posterior insula integrated more with sensorimotor-related regions. More importantly, dramatic development of each subregion's functional network was observed, providing important neuronal correlates for the rapid advancement of its related functions during this time period.

Keywords: development; functional connectivity; insula; resting state.


Figures

Figure 1.
Figure 1.
The selection of optimal K for the whole sample. For each insula and age group, the VI (first row) and CC (second row) were plotted against the number of clusters (K = 2, 3, and 4). The individual VI curves are in light gray lines, while the bold line represents the group average. CC was measured in the group mean consensus matrix. Error bars denote the standard error of the mean. Asterisks denote significant difference (P < 0.05 after false discovery rate correction; paired t-tests for VI; 2-sample t-tests for CC).
Figure 2.
Figure 2.
Two-cluster parcellation of the insula for singletons and twins, separately, across the first 2 years of life.
Figure 3.
Figure 3.
Bootstrapping evaluation of clustering consistency for the whole sample (K = 2). Consistency values were visualized on 3D surfaces (left) and in histograms (right) for the insula in each hemisphere and age group. Red vertical lines in the histogram plots indicate 90% consistency level. The number shown in each plot indicates the percentage of voxels within the corresponding insula that shows a consistency level of >90%.
Figure 4.
Figure 4.
(a) Two-cluster parcellation of the insula for the whole sample; (b) comparisons of within- and between-cluster functional connectivity. Asterisks denote significant differences (P < 0.05 after false discovery rate correction; paired t-tests).
Figure 5.
Figure 5.
Group mean functional connectivity maps associated with the defined insula clusters (red: the anterior insula and green: the posterior insula). Axial slices in radiological convention (left in image is the right hemisphere) covering the whole brain were visualized.
Figure 6.
Figure 6.
Development of the insular cluster functional connectivity maps. Significant increase (red-yellow) and decrease (blue) of functional connectivity with age (paired t-test, P < 0.05, false discovery rate corrected) were visualized. Axial slices in radiological convention (left in image is the right hemisphere) were visualized. Green arrows indicate the location of the seed cluster.
Figure 7.
Figure 7.
Development of network functional connectivity measures associated with each insula cluster. (a) Anterior insula network and (b) posterior insula network. Mean functional connectivity strength within each network was compared across groups and shown in the left column of (a) and (b) (asterisks denote significant difference at P < 0.05 after false discovery rate (FDR) correction; 2-sample t-tests). For LE and GE plots, light gray lines denote individual growth trajectories, while bold black lines represent the LMER fit of the growth trends (solid lines indicate significant growth at P < 0.05 after FDR correction, while dashed lines indicate not significant growth).

References

    1. Afif A, Bouvier R, Buenerd A, Trouillas J, Mertens P. 2007. Development of the human fetal insular cortex: study of the gyration from 13 to 28 gestational weeks. Brain Struct Funct. 212:335–346. - PubMed
    1. Allman JM, Tetreault NA, Hakeem AY, Manaye KF, Semendeferi K, Erwin JM, Park S, Goubert V, Hof PR. 2011. The von Economo neurons in the frontoinsular and anterior cingulate cortex. Ann N Y Acad Sci. 1225:59–71. - PMC - PubMed
    1. Arichi T, Gordon-Williams R, Allievi A, Groves A, Burdet E, Edwards A. 2013. Computer-controlled stimulation for functional magnetic resonance imaging studies of the neonatal olfactory system. Acta Paediatr. 102:868–875. - PMC - PubMed
    1. Bartocci M, Bergqvist LL, Lagercrantz H, Anand KJ. 2006. Pain activates cortical areas in the preterm newborn brain. Pain. 122:109–117. - PubMed
    1. Bellec P, Rosa-Neto P, Lyttelton OC, Benali H, Evans AC. 2010. Multi-level bootstrap analysis of stable clusters in resting-state fMRI. Neuroimage. 51:1126–1139. - PubMed

Publication types