. 2014 Feb;39(4):602-13.
doi: 10.1111/ejn.12423. Epub 2013 Nov 19.

Noise-rearing disrupts the maturation of multisensory integration

Affiliations

Noise-rearing disrupts the maturation of multisensory integration

Jinghong Xu et al. Eur J Neurosci. 2014 Feb.

Abstract

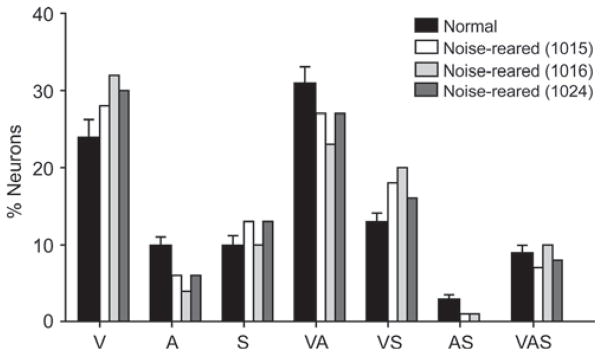
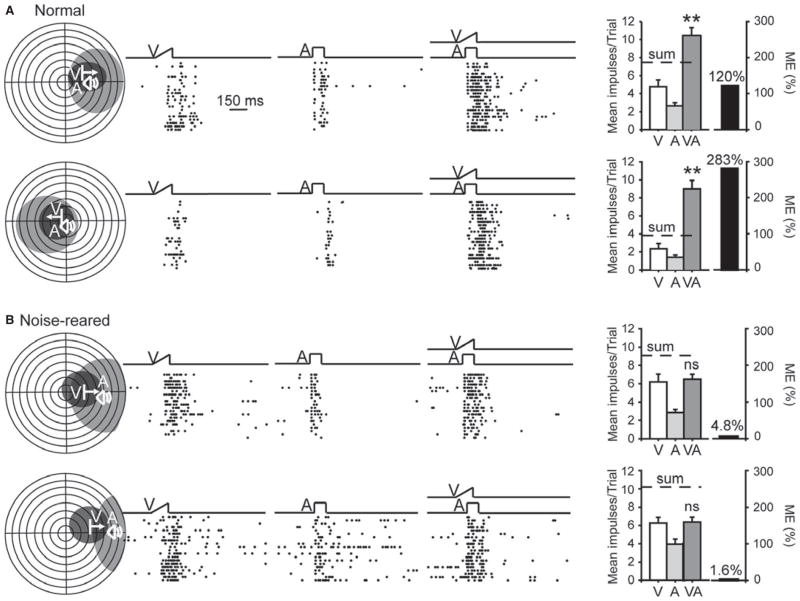
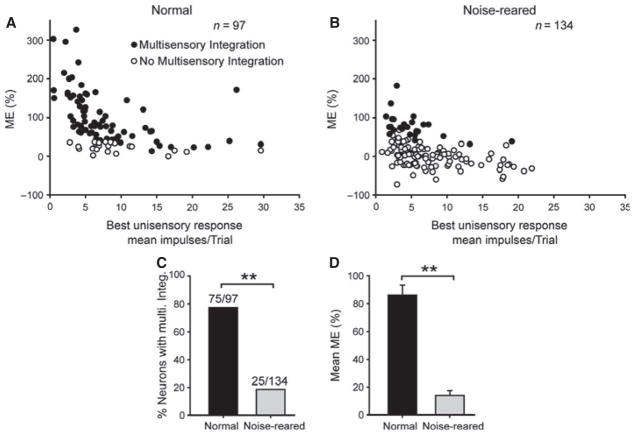
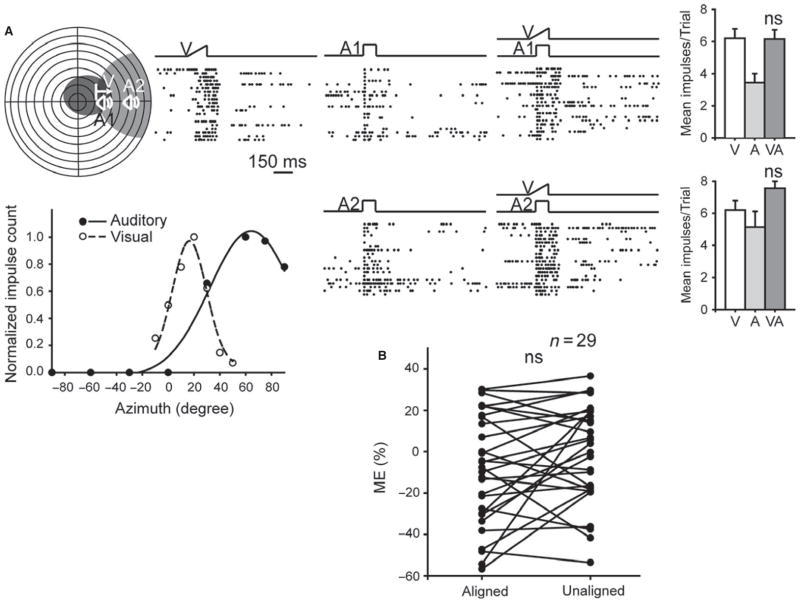
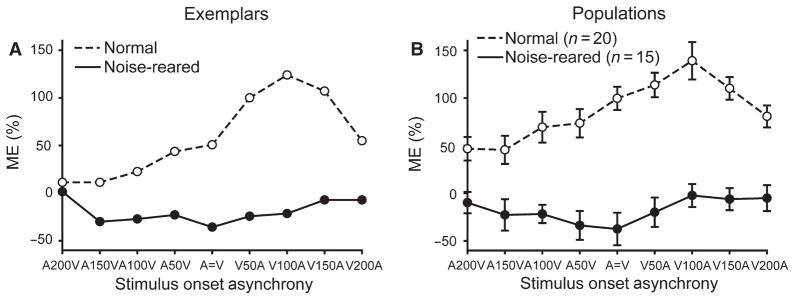
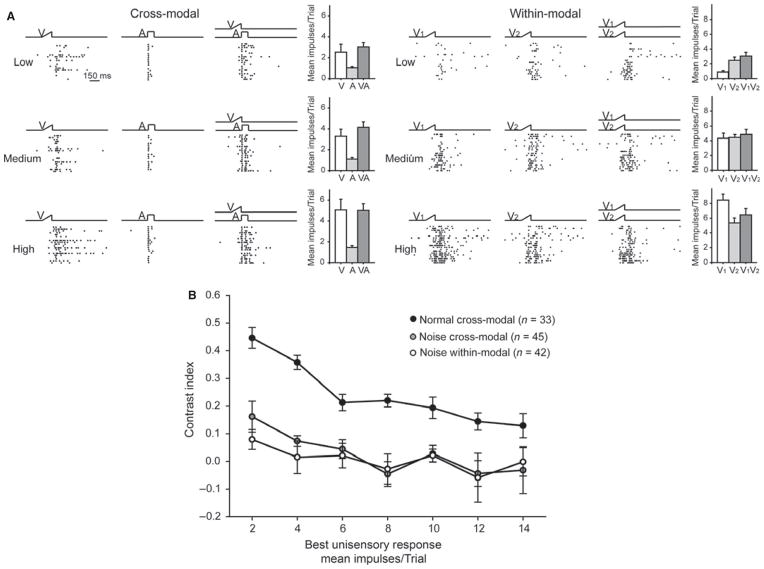
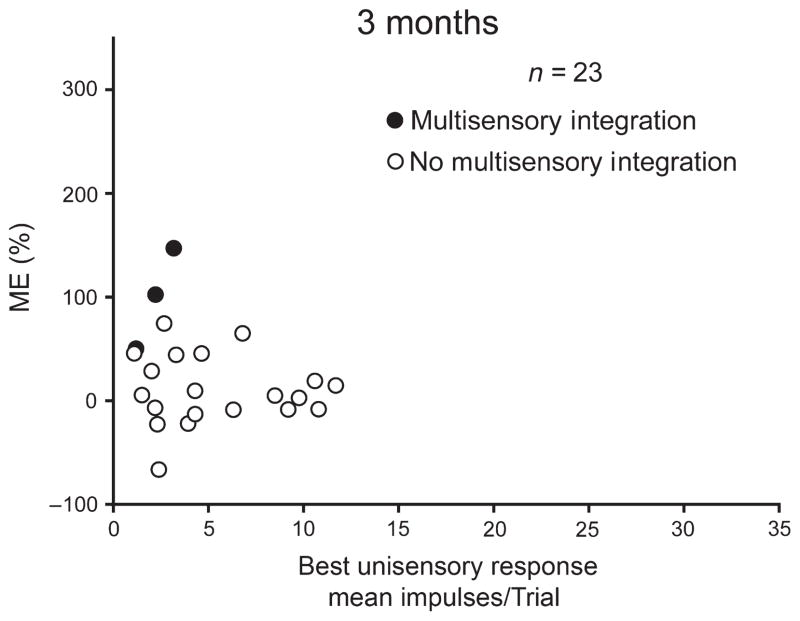
It is commonly believed that the ability to integrate information from different senses develops according to associative learning principles as neurons acquire experience with co-active cross-modal inputs. However, previous studies have not distinguished between requirements for co-activation versus co-variation. To determine whether cross-modal co-activation is sufficient for this purpose in visual-auditory superior colliculus (SC) neurons, animals were reared in constant omnidirectional noise. By masking most spatiotemporally discrete auditory experiences, the noise created a sensory landscape that decoupled stimulus co-activation and co-variance. Although a near-normal complement of visual-auditory SC neurons developed, the vast majority could not engage in multisensory integration, revealing that visual-auditory co-activation was insufficient for this purpose. That experience with co-varying stimuli is required for multisensory maturation is consistent with the role of the SC in detecting and locating biologically significant events, but it also seems likely that this is a general requirement for multisensory maturation throughout the brain.

Keywords: cat; cross-modal; hearing; vision.


Figures

Fig. 1
Fig. 1
The modality-convergence patterns in the SC were similar in noise-reared and normally reared animals. The histogram shows the similar distributions of subtypes of unisensory and multisensory neurons in the SC of normally reared and noise-reared animals. Black bars (plus SEM represented by vertical lines) indicate the average distribution in normal animals, white and gray bars indicate the distribution in each of the noise-reared animals (1015; 1016; 1024). V, visual; A, auditory; S, somatosensory; VA, visual– auditory; VS, visual–somatosensory; AS, auditory–somatosensory; VAS, visual–auditory–somatosensory. The patterns were not significantly different in noise-reared and normally reared animals.
Fig. 2
Fig. 2
Visual responses in an omnidirectional noise-reared animal were depressed by background noise. (A) The visual responses of a visual–auditory neuron at three visual stimulus intensities (high, 3.47 cd/m2; medium, 1.44 cd/m2; low, 0.93 cd/m2) in the presence and absence of background noise equivalent to that in the rearing condition. Note the response depression at all three levels of stimulus effectiveness. (B) Comparison of the responses of a population of neurons to a visual stimulus in the noise background versus the same stimulus in quiet. Visual responses were significantly depressed by the background noise and most fell below the diagonal line of equality (Wilcoxon signed rank test, P ≤0.001, n = 48). (C) The percentage difference in each neuron between its visual response in noise and in quiet. (D) Comparison of the spontaneous activity recorded from each neuron in the presence of the background noise or in quiet. Spontaneous activity was slightly, albeit not significantly, depressed by the omnidirectional background noise stimulus (paired t-test, P = 0.194, n = 16). (E) The percentage difference between the spontaneous rates of each neuron in noise and in quiet.
Fig. 3
Fig. 3
Auditory response magnitudes were not altered by noise-rearing. Shown are the mean numbers of impulses per trial for each of the three acoustic intensities tested in normal and noise-reared animals. Error bars, SEM; ns, non-significant (P > 0.05).
Fig. 4
Fig. 4
Auditory receptive fields and visual–auditory spatial register were abnormal in noise-reared animals. (A) An illustrative example of a visual–auditory neuron from a normal animal. At the top are shown the neuron’s visual (V) and auditory (A) receptive fields plotted on a schematic of visual–auditory space. In this flattened depiction of space, the horizontal and vertical lines depict meridians, and each concentric circle represents 10° of sensory space. The neuron’s response profile to a visual (dashed line) and auditory (solid line) stimulus at different azimuths is shown below. Responses were normalized to give the proportion of the maximum response at each location, ranging from 0 (locations yielding no impulses) to 1 (locations yielding the maximum number of impulses). Note the overlapping receptive fields and parallel visual–auditory spatial response profiles of this neuron. (B,C) Two neurons from a noise-reared animal. The example on the left (B) reflects the majority of the population, showing poor visual–auditory register and a lack of parallelism in the visual and auditory response profiles. The example on the right (C) illustrates a significant minority of neurons with very large (i.e. omnidirectional) and broadly tuned auditory receptive fields. (D) A plot of the auditory–visual center displacements in normal and noise-reared animals. The solid diagonal line represents the line of unity. There is little overlap among the normally reared and noise-reared populations due to the peripheral shift of nearly all the auditory receptive fields in noise-reared animals. (E) Histograms showing the rightward shift in receptive field alignment t scores (see text) in noise-reared animals relative to normal animals, reflecting lower spatial correspondence in their visual–auditory spatial tuning profiles.
Fig. 5
Fig. 5
Most visual–auditory neurons in noise-reared animals failed to develop multisensory integration capability. (A) At the left are the receptive fields of representative multisensory neurons from normally eared controls. In the middle are the raster displays illustrating responses to visual (V), auditory (A), and cross-modal (VA) stimuli. Each dot in a raster represents a single impulse and each row (ordered bottom-to-top) a single trial. Note the increase in the discharges to the cross-modal stimulus, which exceeds each component response. At the right are summary bar graphs that illustrate the mean number of impulses elicited in each stimulus condition, and the magnitude of multisensory response enhancement (ME). In these cases the multisensory response exceeded the sum of impulses in the two unisensory responses. (B) The same conventions are used here in neurons from noise-reared animals. Note the absence of multisensory integration in the two neurons (ns, not significant, P > 0.05). This was typical of 81.3% of the neurons tested. **P < 0.001.
Fig. 6
Fig. 6
Multisensory integration was rare and yielded less response enhancement in noise-reared versus normally reared animals. (A,B) ME is plotted for each neuron as a function of the best (largest) unisensory response. Although the typically high proportion of neurons (n, number of neurons) in normally reared animals exhibited multisensory integration capabilities, few neurons in the noise-reared animals did. (C,D) These group differences are also evident in summary bar graphs which compare the incidences of multisensory integration, and the mean ME magnitudes (normally reared control, black bar; noise-reared, gray bar). These group differences characterized each of the animals studied. Conventions are the same as in previous figures.
Fig. 7
Fig. 7
Manipulating cross-modal spatial relationships did not reveal multisensory integration in noise-reared animals. (A) Although some excitability differences were noted with cross-modal pairings at different receptive field positions in this representative example (i.e. aligned in space, or aligned by comparable receptive field positions), all tests failed to generate multisensory integration. (B) This was the case in the population of neurons studied, as shown by the absence of a statistical difference (ns) between the MEs in the two alignment conditions. Conventions are the same as in previous figures.
Fig. 8
Fig. 8
Manipulating cross-modal temporal relationships did not reveal multisensory integration in SC neurons of noise-reared animals. (A) Data from one exemplar neuron in each condition. (B) Population data. In both graphs ME was plotted as a function of SOA. Note that high MEs were apparent in the normal exemplar neuron and in the normal population, with both showing the presence of a ‘best’ SOA (V 100 ms before A). In contrast, neurons in noise-reared animals had MEs at or below 0, and had no clear best SOA.
Fig. 9
Fig. 9
Responses of multisensory neurons to pairs of cross-modal and within-modal stimuli were similar in noise-reared animals. (A) On the left are shown unisensory and multisensory responses of a neuron from a noise-reared animal that were elicited by visual stimuli of low, medium and high effectiveness (the auditory response was insensitive to stimulus intensity, see text). Note the absence of response enhancement to the cross-modal stimulus pair at any level of stimulus effectiveness. This is typical of responses to pairs of within-modal stimuli as shown by the example on the right. (B) Population data of responses to these stimulus configurations are displayed using the contrast index (+ 1 and −1 indicate responses greater or less than those to the most effective component stimulus – the best unisensory response). Noise, neurons from noise-reared animals; normal, neurons from normally reared animals. Other conventions are the same as in previous figures. Note that in the noise-reared condition responses to cross-modal stimuli overlapped those from within-modal stimuli, and were far lower than expected based on the function from the normally reared condition.
Fig. 10
Fig. 10
The failure to develop multisensory integration capabilities was evident at 3 months of age. Conventions are the same as in previous figures.

Similar articles

Cited by

References

    1. Alvarado JC, Stanford TR, Vaughan JW, Stein BE. Cortex mediates multisensory but not unisensory integration in superior colliculus. J Neurosci. 2007a;27:12775–12786. - PMC - PubMed
    1. Alvarado JC, Vaughan JW, Stanford TR, Stein BE. Multi-sensory versus unisensory integration: contrasting modes in the superior colliculus. J Neurophysiol. 2007b;97:3193–3205. - PubMed
    1. Alvarado JC, Stanford TR, Rowland BA, Vaughan JW, Stein BE. Multisensory integration in the superior colliculus requires synergy among corticocollicular inputs. J Neurosci. 2009;29:6580–6592. - PMC - PubMed
    1. Butts DA, Kanold PO. The applicability of spike time dependent plasticity to development. Front Synaptic Neurosci. 2010;2:30. - PMC - PubMed
    1. Carrasco MM, Razak KA, Pallas SL. Visual experience is necessary for maintenance but not development of receptive fields in superior colliculus. J Neurophysiol. 2005;94:1962–1970. - PubMed

Publication types