. 2014 Feb;171(4):1007-18.
doi: 10.1111/bph.12520.

A quantitative model of amphetamine action on the 5-HT transporter

Affiliations

A quantitative model of amphetamine action on the 5-HT transporter

Walter Sandtner et al. Br J Pharmacol. 2014 Feb.

Abstract

Background and purpose: Amphetamines bind to the plasmalemmal transporters for the monoamines dopamine (DAT), noradrenaline (NET) and 5-HT (SERT); influx of amphetamine leads to efflux of substrates. Various models have been proposed to account for this amphetamine-induced reverse transport in mechanistic terms. A most notable example is the molecular stent hypothesis, which posits a special amphetamine-induced conformation that is not likely in alternative access models of transport. The current study was designed to evaluate the explanatory power of these models and the molecular stent hypothesis.

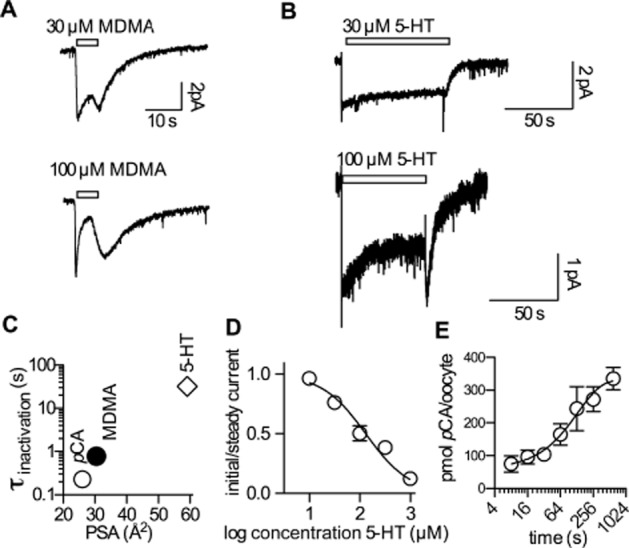
Experimental approach: Xenopus laevis oocytes and HEK293 cells expressing human (h) SERT were voltage-clamped and exposed to 5-HT, p-chloroamphetamine (pCA) or methylenedioxyamphetamine (MDMA).

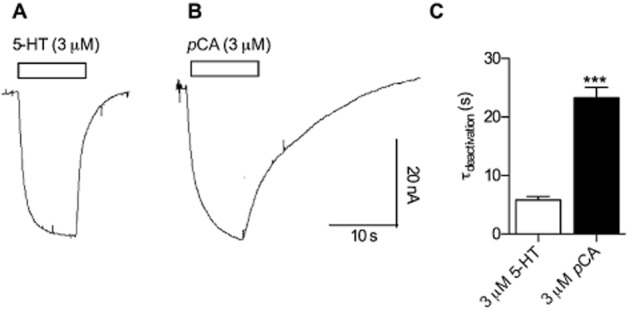
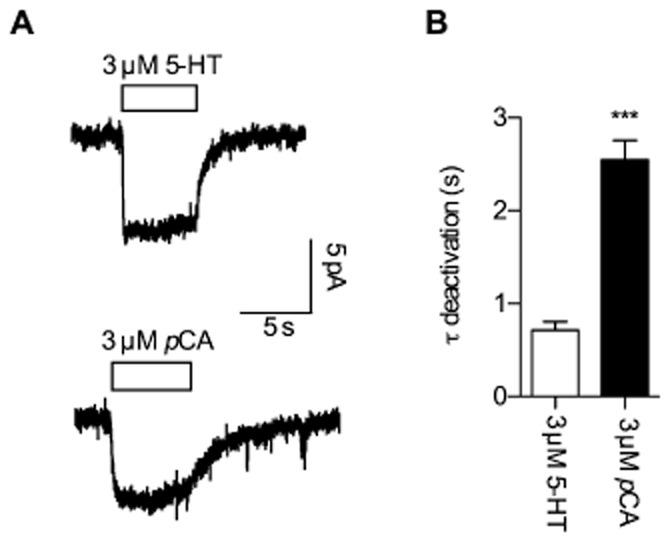
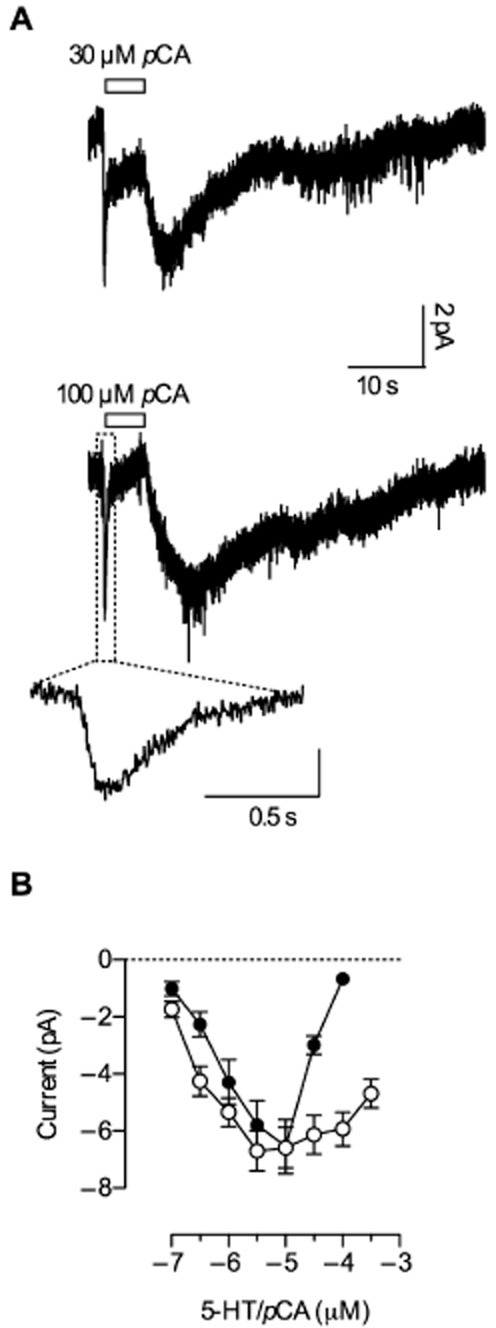
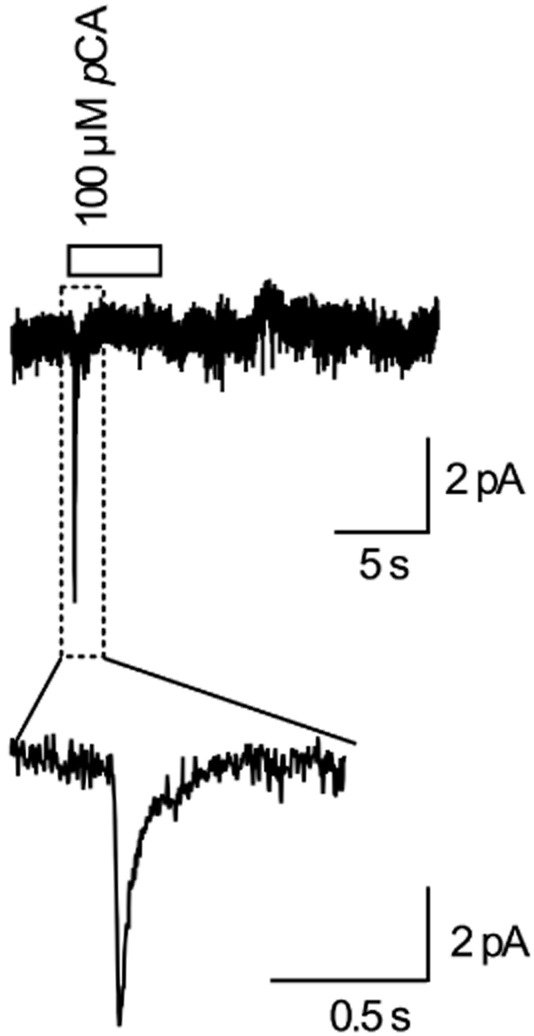
Key results: In contrast to the currents induced by 5-HT, pCA-triggered currents through SERT decayed slowly in Xenopus laevis oocytes once the agonist was removed (consistent with the molecular stent hypothesis). However, when SERT was expressed in HEK293 cells, currents induced by 3 or 100 μM pCA decayed 10 or 100 times faster, respectively, after pCA removal.

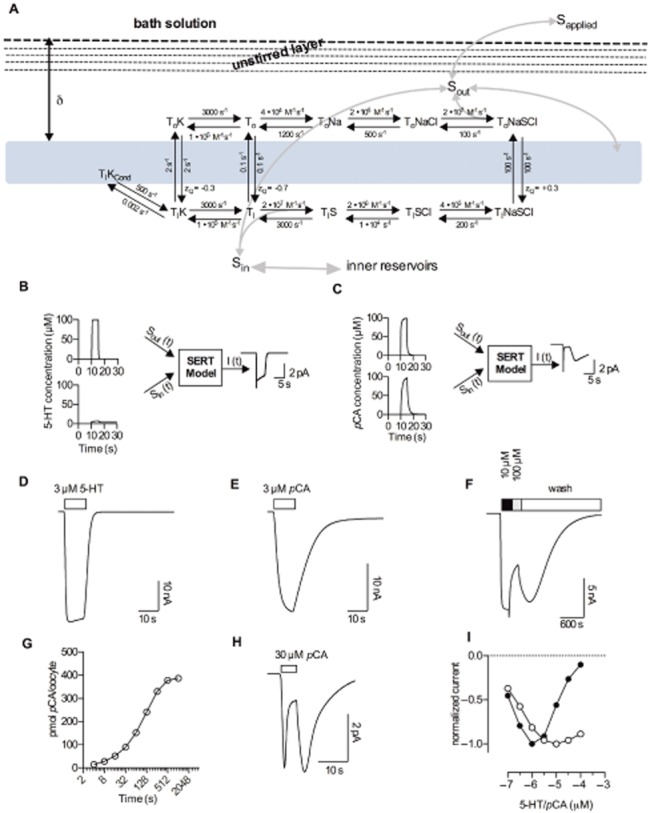
Conclusions and implications: This discrepancy in decay rates is inconsistent with the molecular stent hypothesis. In contrast, a multistate version of the alternative access model accounts for all the observations and reproduces the kinetic parameters extracted from the electrophysiological recordings. A crucial feature that explains the action of amphetamines is their lipophilic nature, which allows for rapid diffusion through the membrane.

Keywords: SERT; amphetamine; currents; diffusion.


Figures

Figure 1
Figure 1
Differences between currents induced by 5-HT and pCA respectively. Xenopus laevis oocytes expressing hSERT were clamped to −60 mV. Currents induced by 3 μM 5-HT were compared with currents from the same cell induced by 3 μM pCA. (A) 3 μM 5-HT was applied to the cell for 10 s and subsequently washed away with a gravity driven perfusion system. (B) The same procedure was repeated with 3 μM pCA. (C) The current decays were fitted to mono-exponential functions and the time constants were plotted in the bar graph. A comparison of the decay time constants following 5-HT (5.8 s ± 1.3 s, n = 6) and pCA removal (23.3 s ± 4 s, n = 6) revealed a significantly slower time constant for pCA (*** = P < 0.001, Mann–Whitney U-test).
Figure 2
Figure 2
Concentration-dependence of currents induced by 5-HT and pCA. Single Xenopus laevis oocytes were voltage clamped to −60 mV using the two electrode voltage clamp technique. Cells were continuously superfused with buffer solution. For the evaluation of the current amplitudes, the cells were either challenged with increasing concentrations of 5-HT or pCA. (A) The currents induced were recorded for both substrates (n = 5 each), averaged and plotted as a function of increasing 5-HT/pCA concentrations with lines connecting the data points. pCA (closed circles) and 5-HT (open circles) stimulation led to similar maximal current amplitudes; however, the inhibitory effect of pCA was more pronounced, as indicated by a stronger current suppression at high concentrations. (B) A representative experiment illustrating current responses to increasing pCA concentrations. The current exhibited a maximum at 10 μM pCA and was fully suppressed at 1 mM. (C) A representative current trace recorded at −60 mV; 10 μM pCA elicited the maximal current amplitude whereas 100 μM pCA inhibited the current partially. After removal of pCA, the current initially rose to a higher level; 30 to 40 min were required for its full decay (the inset shows a magnification of the current trace). Hence, the current appears to be persistent when monitored at the time scale indicated (10 to 100 s). (D) Prolonged exposure to pCA leads to slowed deactivation; currents elicited by 100 μM pCA are shown. The respective exposure times were 4 (black), 8 (dark grey) and 16 s (light grey).
Figure 3
Figure 3
Comparison of current responses to 5-HT and pCA in HEK293 cells expressing SERT. Cells were continuously perfused with buffer and voltage clamped to −70 mV utilizing the whole cell patch clamp technique. (A) Inwardly directed currents provoked by 3 μM 5-HT (upper trace) or 3 μM pCA (lower trace); 5-HT/pCA were applied for 5 s and then removed from the solution utilizing a fast perfusion system (see experimental procedures). (B) Current deactivation upon removal of 5-HT and pCA was fitted to a mono-exponential function and the time constants derived were plotted in a bar graph. Comparison of the decay time constants following 5-HT removal (0.712 s ± 0.094 s, n = 9) and pCA removal (2.549 s ± 0.208 s, n = 9) reveals a significantly slower time constant for pCA (*** = P < 0.001, Mann–Whitney U-test).
Figure 4
Figure 4
Current responses to high pCA concentrations in HEK293 cells. (A) Representative current traces recorded from HEK293 cells expressing hSERT induced by 30 and 100 μM pCA respectively. Cells were clamped to −70 mV and pCA was applied for 5 s, before it was removed from the solution. Exposure to 30 and 100 μM pCA resulted in an inwardly directed current that inactivated quickly during exposure (261 ms ± 70 ms, n = 8, and 223 ms ± 60 ms, n = 8, at 30 and 100 μM pCA respectively). The current first recovered and then deactivated after removal of pCA (7.8 s ± 2.5 s at 30 μM, n = 8, and 13.2 s ± 4.7 s, n = 8, at 100 μM pCA). The initial current peak on an expanded time scale is shown in an inset. (B) Current amplitudes upon stimulation by increasing 5-HT/pCA concentrations – measured after 5 s of exposure – were plotted as a function of concentration (n = 8 each) with lines connecting the data points. pCA (closed circles) and 5-HT (open circles) led to similar maximal current amplitudes; however, the inhibitory effect of pCA was more pronounced.
Figure 5
Figure 5
pCA-induced current in the absence of internal K+. Representative current trace recorded from a HEK293 cell expressing hSERT clamped to −70 mV. Internal K+ was replaced with NMDG+ (see experimental procedures) and the cell was challenged with 100 μM pCA for 5 s with a fast perfusion device (see also experimental procedures). pCA evoked a fast current peak, but the steady current that also included the current following pCA removal is absent (compare with Figure 4A-lower trace). The peak current is shown in an inset with an expanded time scale. The current decay was well fitted by a mono-exponential function and the fit yielded a time constant of 70 ± 21 ms (n = 5); compare this with time constants from Figure 4.
Figure 6
Figure 6
Current inhibition is a consequence of internal substrate accumulation. (A) Representative currents recorded in HEK293 cells at −70 mV induced by 30 and 100 μM MDMA respectively. MDMA was applied for 5 s and then removed from the external solution. Similar to the pCA-induced current (compare Figure 4), the current inactivated rapidly within the application time. The extracted time constants were 930 ms ± 180 ms (n = 5) and 780 ms ± 150 ms (n = 5) for 30 and 100 μM MDMA respectively. (B) Currents induced by 30 and 100 μM 5-HT; 5-HT was applied for an extended time period (see scale bar). In the case of 100 μM 5-HT, the current reached a steady level at about 50% of the initial amplitude. The respective time constant for current inactivation was 32 s ± 11 s (n = 6). (C) The logarithm of the time constant for current inactivation (σinactivation) at 100 μM pCA, MDMA and 5-HT was plotted as a function of the polar surface area (PSA); these values were taken from chemicalize.org. (D) The ratios of the initial current amplitude and the steady current amplitude are plotted as a function of increasing 5-HT concentrations. Each data point is the average of six experiments. The average values were fitted to the following equation: Y = 1/(1 + 10∧((X-logIC50))). The extracted IC50 was 131 μM [95% confidence interval: 83.36–207.8 μM]. (E) pCA uptake into uninjected Xenopus laevis oocytes. The level of accumulated pCA in pmol per oocyte is plotted as a function of the exposure time to pCA (100 μM). Each data point is the average of six experiments. The line indicates a fit to a mono-exponential function. The extracted time constant was 134 s [95% confidence interval: 83–345 s].
Figure 7
Figure 7
A model of amphetamine's action on SERT. (A) Alternative access model of SERT function in the presence of amphetamine, based on our previous findings. An unstirred solution layer surrounding the membrane at the width ∂ is included (the membrane is indicated as light blue rectangle). The unstirred solution layer was modelled by assuming five compartments separated by imaginary barriers. Grey arrows indicate substrate fluxes. (B) and (C) show examples of external and internal substrate concentrations as a function of time [Sout (t) and Sin (t)], as predicted by our model (see the model description in the supplement). I(t) is the calculated current produced by a given combination of Sout (t) and Sin (t). We assumed an application of 100 μM 5-HT in panel B and application of 100 μM pCA in panel C. Panels D–H show simulated current traces. (D) Calculated current induced by 3 μM 5-HT for SERT expressed in Xenopus laevis oocytes. (E) Calculated current induced by 3 μM pCA in oocytes. (F) Pseudo-persistent current following removal of 100 μM pCA, simulated for a Xenopus laevis oocyte expressing SERT. (G) Simulated pCA uptake into a single uninjected Xenopus laevis oocyte. (H) Simulated SERT current from HEK293 cells challenged with 30 μM pCA. (I) Simulated current amplitudes as a function of concentration measured after 5 s for 5-HT (open circles) and pCA (closed circles). This calculation was conducted for HEK293 cells expressing SERT; the calculated data points were connected with lines.

Comment in

References

    1. Adams SV, DeFelice LJ. Ionic currents in the human serotonin transporter reveal inconsistencies in the alternating access hypothesis. Biophys J. 2003;85:1548–1559. - PMC - PubMed
    1. Baldwin RL. The new view of hydrophobic free energy. FEBS Lett. 2013;587:1062–1066. - PubMed
    1. Baumann MH, Ayestas MA, Partilla JS, Sink JR, Shulgin AT, Daley PF, et al. The designer methcathinone analogs, mephedrone and methylone, are substrates for monoamine transporters in brain tissue. Neuropsychopharmacology. 2012;37:1192–1203. - PMC - PubMed
    1. Boehm S. ATP stimulates sympathetic transmitter release via presynaptic P2X purinoceptors. J Neurosci. 1999;19:737–746. - PMC - PubMed
    1. Bulling S, Schicker K, Zhang Y-W, Steinkellner T, Stockner T, Gruber C, et al. The mechanistic basis for noncompetitive ibogaine inhibition of serotonin and dopamine transporters. J Biol Chem. 2012;287:18524–18534. - PMC - PubMed

Publication types

Substances