. 2014 Feb 17;53(4):1916-24.
doi: 10.1021/ic402194c. Epub 2013 Nov 19.

Metal-organic frameworks as sensory materials and imaging agents

Affiliations

Metal-organic frameworks as sensory materials and imaging agents

Demin Liu et al. Inorg Chem. .

Abstract

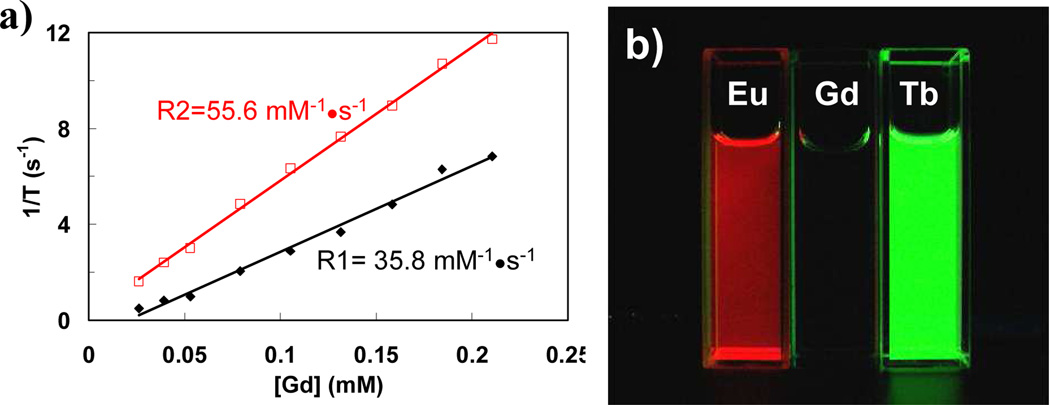
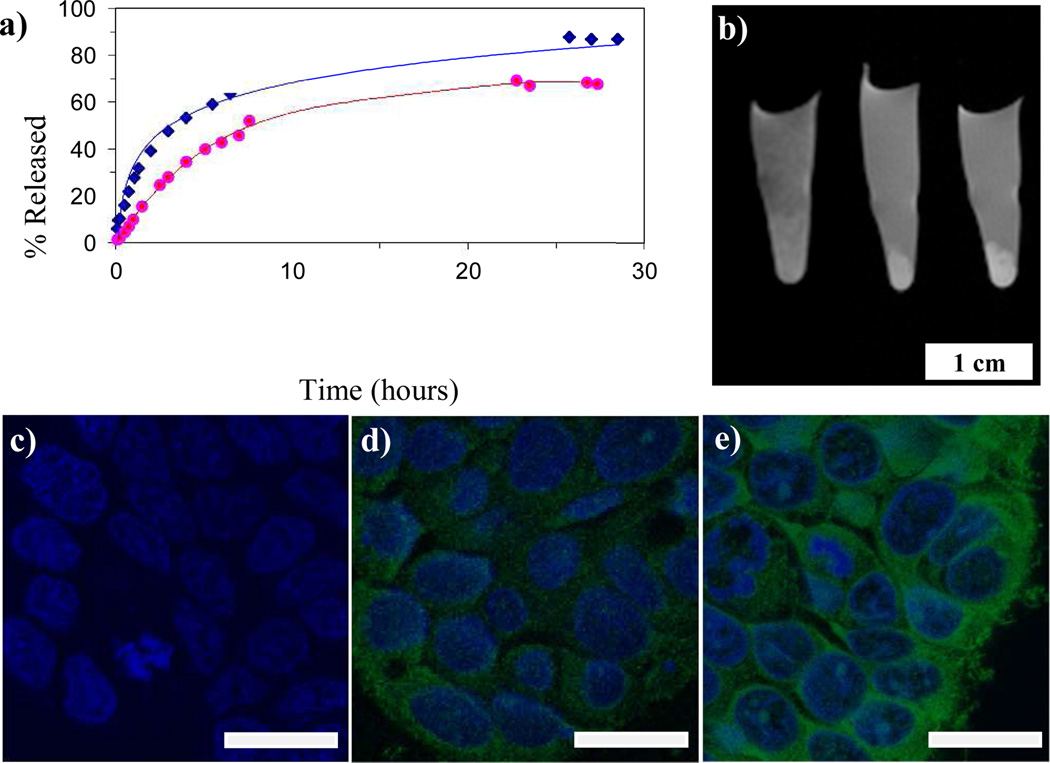
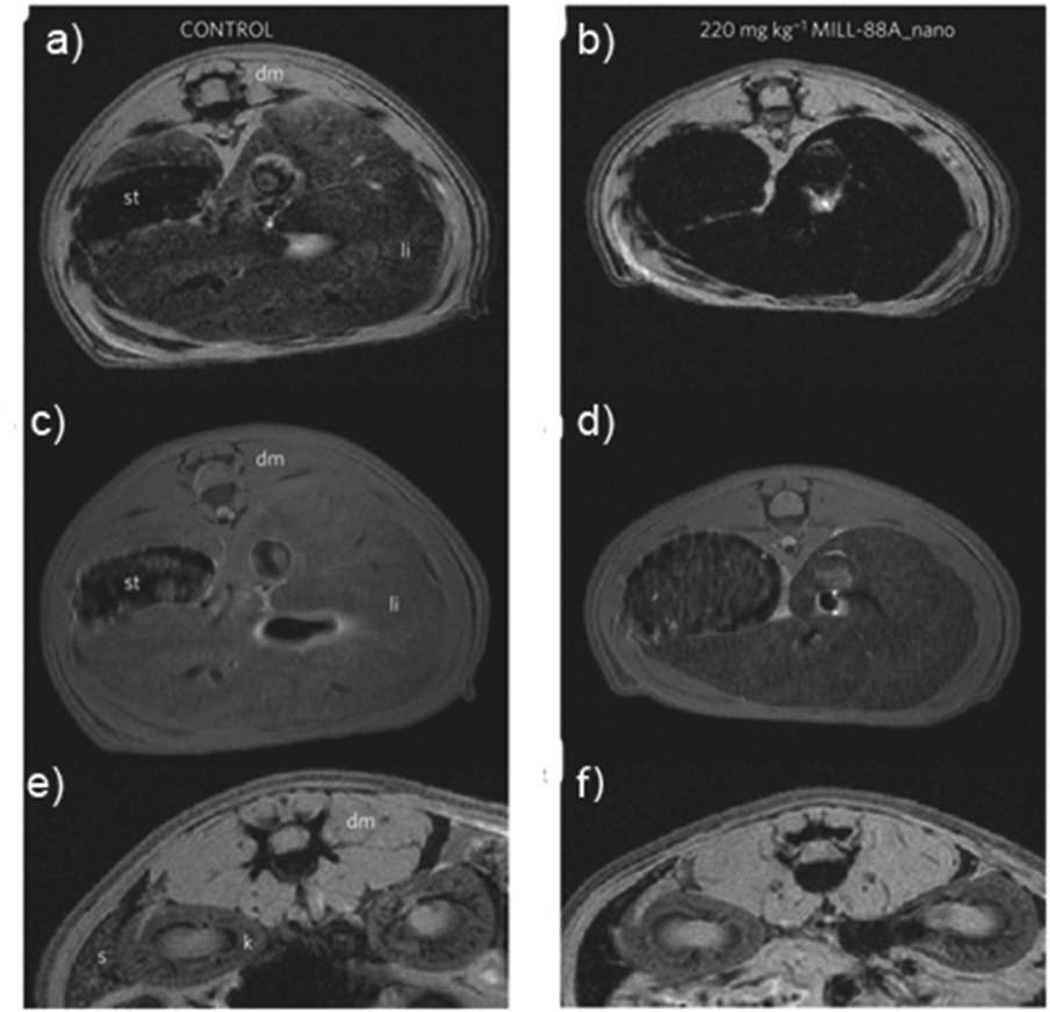
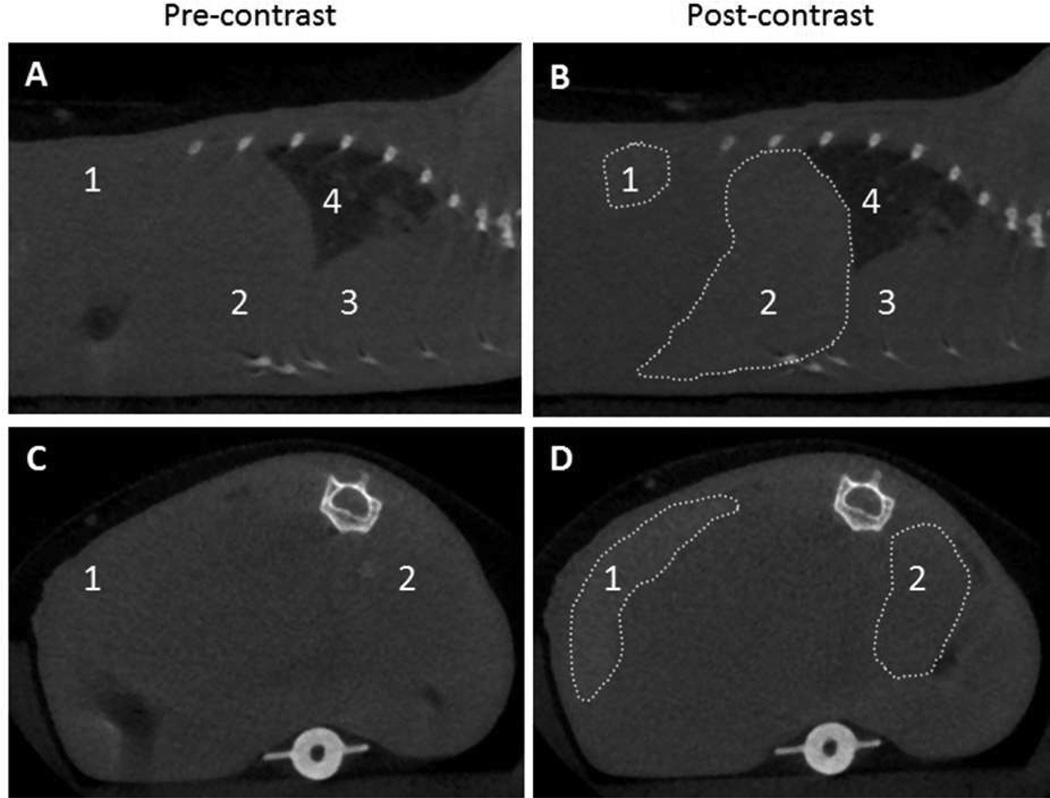
Metal-organic frameworks (MOFs) are a class of hybrid materials self-assembled from organic bridging ligands and metal ion/cluster connecting points. The combination of a variety of organic linkers, metal ions/clusters, and structural motifs can lead to an infinite array of new materials with interesting properties for many applications. In this Forum Article, we discuss the design and applications of MOFs in chemical sensing and biological imaging. The first half of this article focuses on the development of MOFs as chemical sensors by highlighting how unique attributes of MOFs can be utilized to enhance sensitivity and selectivity. We also discuss some of the issues that need to be addressed in order to develop practically useful MOF sensors. The second half of this article focuses on the design and applications of nanoscale MOFs (NMOFs) as imaging contrast agents. NMOFs possess several interesting attributes, such as high cargo loading capacity, ease of postmodification, tunable size and shape, and intrinsic biodegradability, to make them excellent candidates as imaging contrast agents. We discuss the use of representative NMOFs in magnetic resonance imaging (MRI), X-ray computed tomography (CT), and optical imaging. Although still in their infancy, we believe that the compositional tunability and mild synthetic conditions of NMOF imaging agents should greatly facilitate their further development for clinical translation.


Figures

Figure 1
Figure 1
(a) Photograph of a series of ZIF-8 films of various thicknesses grown on silicon substrates. UV-vis transmission spectra of ZIF-8 film on glass after exposure to (b) propane vapor of various concentrations from 0% (blue) to 100% (red) and (c) ethanol (red) or water (blue) and corresponding interference peak (originally at 612 nm) shift versus (d) propane concentration in N2 diluent and (e) ethanol concentration (v/v %) in ethanol/water solutions. Copyright 2010 American Chemistry Society.
Figure 2
Figure 2
Time-dependent fluorescence quenching by (a) DNT and (b) DMNB (excitation wavelength=320 nm). Insets: the corresponding fluorescence spectra before and after exposure to the analyte vapors for 10 s (left) and three consecutive quench/regeneration cycles (right). Copyright 2009 Wiley-VCH.
Figure 3
Figure 3
(a) Crystal structure of the Eu-pdc MOF, viewed along the a axis. (b) The excitation and PL spectra of MOF activated in DMF solutions of Cu(NO3)2 at different concentrations (excited and monitored at 321 nm and 618 nm, respectively). Copyright 2009 Wiley-VCH.
Figure 4
Figure 4
(a) Schematic showing the formation of [Pb2(bco)2] by leaching of the weakly coordinating bipy. The cation encapsulation and exchange experiments give the emission spectra of (b) after stirring [Pb2(bco)2] in Tb(ClO4)3 aqueous solution for 3h; (c) sample of (b) stirred in Eu(ClO4)3 aqueous solution at one (black) and two (red) days; (d) sample of (c) stirred in Tb(ClO4)3 aqueous solution at one (black) and two (red) days. Excitation are all at 303 nm. Copyright 2009 Wiley-VCH.
Figure 5
Figure 5
(a) Single crystal X-ray structure of Tb(BTC) MOF activated in methanol containing NaF. (b) Excitation (dotted) and PL spectra (solid) of the Tb(BTC) MOF activated in different concentrations of NaF. Copyright 2008 American Chemistry Society.
Figure 6
Figure 6
Top view of the 2D bilayer structure of the MOFs synthesized from two Ir(ppy)3-derived ligands (a, b); (c) Stern-Volmer plot showing I0/I vs O2 partial pressure for ligand complexes and MOFs; (d) Reversible quenching of phosphorescence of the MOF upon alternating exposure to 0.1 atm O2 and application of vacuum. The inset shows rapid equilibration of phosphorescence of the MOF after each dose of O2. Copyright 2010 American Chemistry Society.
Figure 7
Figure 7
(a) Schematic depiction of space flexibility in entangled MOF for molecular decoding. (b) The resulting luminescence of MOF powders suspension in organic liquid indicated, with 365 nm irradiation. (c) Normalized luminescent spectra of guest-containing MOFs upon excitation at 370 nm. (d) The relationship between the emission energy of guest-containing MOF and the ionization potential of each guest molecules. Copyright 2011 Nature Publishing Group.
Figure 8
Figure 8
a) Schematic showing chiral sensing of amino alcohols with a Cd MOF with BINOL-derived tetracarboxylate ligand. b) Stern-Völmer plots of fluorescence quenching of the Cd MOF by (R)- and (S)-2-amino-3-methyl-1-butanol (AA). Copyright 2012 American Chemical Society.
Figure 9
Figure 9
(a) r1 and r2 relaxivity curves of Gd(BDC)1.5(H2O)2 of ∼100 nm in length by ∼40 nm in diameter. In comparison, OmniScan gave an r1 of 4.1 mM−1s−1 under these conditions. (b) Luminescence images of ethanolic suspensions of Eu- and Tb-doped Gd(BDC)1.5(H2O)2 when irradiated with UV light. Copyright 2006 American Chemical Society.
Figure 10
Figure 10
(a) Dissolution curves of uncoated (blue) and silica-coated (red) Mn3(BTC)2(H2O)6 nanoparticles (Mn@SiO2) in water at 37 °C (% released vs time). (b) In vitro MR images of HT-29 cells incubated with no particle (left), nontargeted Mn@SiO2 (middle), and c(RGDfK)-targeted Mn@SiO.2 (right). (c–e) Merged confocal images of HT-29 cells that were incubated with no particles (c), nontargeted Mn@SiO2 (d), c(RGDfK)-targeted Mn@SiO2 (e). The blue color was from DRAQ5 used to stain the cell nuclei while the green color was from rhodamine B. The bars represent 20 µm. Copyright 2008 American Chemical Society.
Figure 11
Figure 11
T2 weighted MR images of Wistar rats injected with no particle (a,c,e) or 220 mg/kg MIL-88A (e,d,f). The images were acquired using either gradient echo (a,b,e,f) or spin echo (c,d) sequences. The images show the liver (a–d) or spleen (e,f) regions 30 minutes post-injection. [dm=dorsal muscle, k=kidney, li=liver, s=spleen, st=stomach]. Reproduced with permission from reference [14]. Copyright Nature Publishing Group 2010.
Figure 12
Figure 12
CT phantom images of a) [Cu(I4-BDC)(H2O)2]·2H2O (NCP 3a) and b) [Zn(I4-BDC)(EtOH)2]·2EtOH (NCP 5b) dispersed in ethanol, and c) Iodixanol in aqueous solution. From the top, clockwise, the slots have [I]=0, 0.075, 0.150, 0.225, and 0.300 M. d) Xray attenuation as a function of [I] for NCP 3a at 40 kVp, NCP 5b at 50 kVp, and Iodixanol at 40 kVp. Blue: Iodixanol, Red: NCP 3a, Black: 5b. Copyright 2009 Wiley-VCH.
Figure 13
Figure 13
(A and B) Sagittal and (C and D) axial CT slices of a mouse pre-contrast and 15 min after injection of Hf-UiO@SiO2@PEG. The areas of increased attenuation are outlined, and the labels are: 1 – spleen (+131 HU), 2 – liver (+86 HU), 3 – heart, and 4 – lungs. Copyright 2012 Royal Society of Chemistry.
Figure 14
Figure 14
a) Synthesis of Zr NCP, coating of Zr NCP with silica, and further functionalization with PEG and PEG-anisamide. Confocal microscopic images of H460 cells that have been incubated with various nanoparticles: control cells without any particles (b), cells with Zr-NCP@PEG-SiO2(c), and cells with Zr-NCP@AA-PEG-SiO2 (d). Copyright 2011 Wiley-VCH.
Figure 15
Figure 15
a) Schematic representation of the incorporation of anionic dyes within supramolecular networks. b) Fluorescence microscopy image of HeLa cells incubated with 4-doped 5’-AMP/Gd3+ NPs. c) Fluorescent images of organs from mice injected with 4-doped 5’-AMP/Gd3+ NPs. d) Biodistribution of 4-doped 5’-AMP/Gd3+ NPs in mice at 0.5 h and 48 h post-injection time point. Copyright 2009 American Chemical Society.
Scheme 1
Scheme 1
Schematic representations of direct incorporation of biomedically relevant agents into the MOF framework (a) and cargo loading by non-covalent (b1) and covalent (b2) means.

References

    1. Ma L, Falkowski JM, Abney C, Lin W. Nat. Chem. 2010;2:838–846. - PubMed
    1. Lee J, Farha OK, Roberts J, Scheidt KA, Nguyen ST, Hupp JT. Chem. Soc. Rev. 2009;38:1450–1459. - PubMed
    1. Ma L, Abney C, Lin W. Chem. Soc. Rev. 2009;38:1248–1256. - PubMed
    1. Song F, Wang C, Falkowski JM, Ma L, Lin W. J. Am. Chem. Soc. 2010;132:15390–15398. - PubMed
    1. Wu C-D, Hu A, Zhang L, Lin W. J. Am. Chem. Soc. 2005;127:8940–8941. - PubMed

Publication types