. 2013 Nov 19;20(1):86.
doi: 10.1186/1423-0127-20-86.

Epigallocatechin-3-gallate-mediated cardioprotection by Akt/GSK-3β/caveolin signalling in H9c2 rat cardiomyoblasts

Affiliations

Epigallocatechin-3-gallate-mediated cardioprotection by Akt/GSK-3β/caveolin signalling in H9c2 rat cardiomyoblasts

Shih-Ron Hsieh et al. J Biomed Sci. .

Abstract

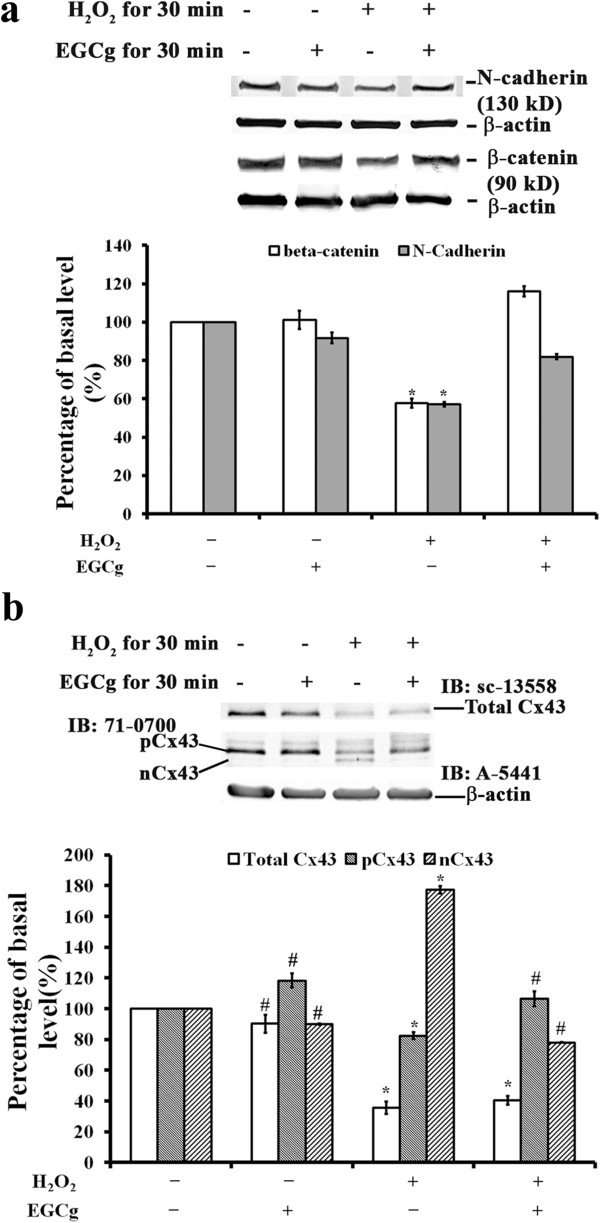
Background: Epigallocatechin-3-gallate (EGCg) with its potent anti-oxidative capabilities is known for its beneficial effects ameliorating oxidative injury to cardiac cells. Although studies have provided convincing evidence to support the cardioprotective effects of EGCg, it remains unclear whether EGCg affect trans-membrane signalling in cardiac cells. Here, we have demonstrated the potential mechanism for cardioprotection of EGCg against H2O2-induced oxidative stress in H9c2 cardiomyoblasts.

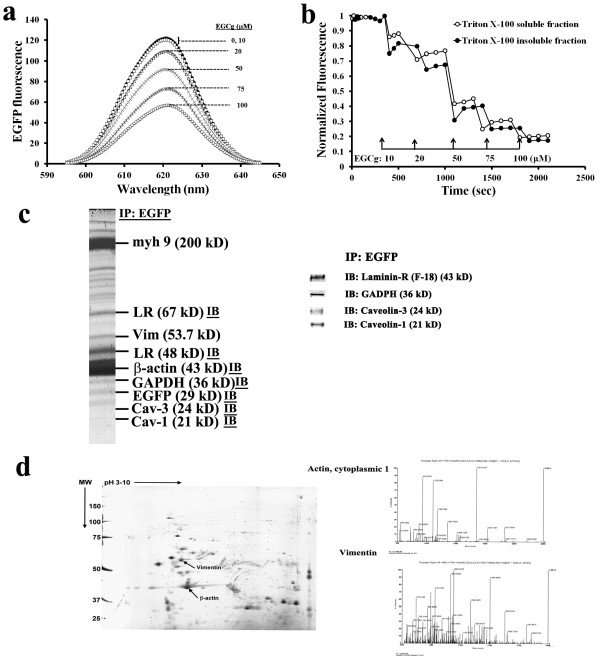
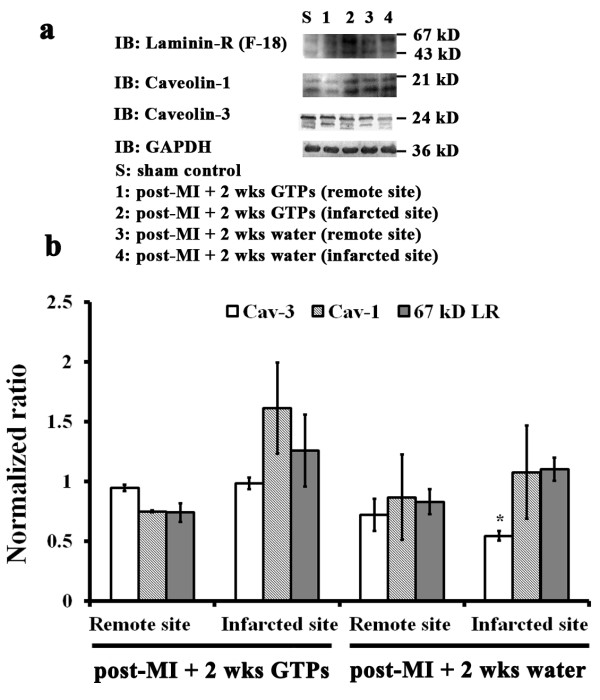
Results: Exposing H9c2 cells to H2O2 suppressed cell viability and altered the expression of adherens and gap junction proteins with increased levels of intracellular reactive oxygen species and cytosolic Ca2+. These detrimental effects were attenuated by pre-treating cells with EGCg for 30 min. EGCg also attenuated H2O2-mediated cell cycle arrest at the G1-S phase through the glycogen synthase kinase-3β (GSK-3β)/β-catenin/cyclin D1 signalling pathway. To determine how EGCg targets H9c2 cells, enhanced green fluorescence protein (EGFP) was ectopically expressed in these cells. EGFP-emission fluorescence spectroscopy revealed that EGCg induced dose-dependent fluorescence changes in EGFP expressing cells, suggesting that EGCg signalling events might trigger proximity changes of EGFP expressed in these cells. Proteomics studies showed that EGFP formed complexes with the 67 kD laminin receptor, caveolin-1 and -3, β-actin, myosin 9, vimentin in EGFP expressing cells. Using in vitro oxidative stress and in vivo myocardial ischemia models, we also demonstrated the involvement of caveolin in EGCg-mediated cardioprotection. In addition, EGCg-mediated caveolin-1 activation was found to be modulated by Akt/GSK-3β signalling in H2O2-induced H9c2 cell injury.

Conclusions: Our data suggest that caveolin serves as a membrane raft that may help mediate cardioprotective EGCg transmembrane signalling.


Figures

Figure 1
Figure 1
A cell model illustrating cardioprotection of EGCg on H2O2-induced oxidative stress in H9c2 cells. (a) Phase contrast microscopy showing cell morphology of H9c2 cells in the conditions of control (left top), 20 μM EGCg treatment for 30 min (right top), 400 μM H2O2 exposure for 30 min (left bottom), and 20 μM EGCg pre-treatment for 30 min followed by 400 μM H2O2 exposure for 30 min (right bottom). Calibration bar of 200 μm as indicated. (b) MTT assay of cell viability after incubation with 0, 100, 200, and 400 μM H2O2 with or without 0, 10, and 20 μM EGCg for 30 min. (c) Measurements of intracellular ROS formation by DCF-DA in H9c2 cells. The fluorescence changes of DCF-DA-loaded cells were measured every 10 min before and after the addition of 400 μM H2O2 with 0-50 μM EGCg as indicated by fluorescence spectrophotometry. The fluorescence excitation maximum for DCF-DA was 495 nm, and the corresponding emission maximum was 527 nm. (d) Effects of H2O2 and/or EGCg on intracellular Ca2+ levels in H9c2 cells. Cellular Ca2+ levels were measured using the Fura-2 fluorescence ratio (F340/F380) in H9c2 cells cultured in the conditions of control, 20 μM ECGg treatment for 30 min, and 400 μM H2O2 exposure for 30 min with and/or without 20 μM ECGg treatment for 30 min, then during the measurement in PBS for 3 min periods. The F340/F380 ratio was continuously monitored. In b, c and d, the values are the mean ± SEM (n = 6), with *, # indicating a significant difference compared to the untreated cells or the H2O2-treated cells, respectively.
Figure 2
Figure 2
Effects on the levels of β-catenin, N-cadherin, and Cx 43 in H9c2 cells. (a) Western blotting (top) with quantitative analyses (bottom) of N-Cadherin, β-catenin, and β-actin levels in the H9c2 cells of controls with (lane 2) or without (lane 1) 20 μM EGCg pre-treatment for 30 min or 400 μM H2O2-induced oxidative stress for 30 min with (lane 4) or without (lane 3) 20 μM EGCg pre-treatment. (b) Top: Cx43 levels on western blots using mouse monoclonal anti-rat Cx43 antibody (sc-13558) or rabbit polyclonal antibodies (71-0700) in the H9c2 cells of controls with (lane 2) or without (lane 1) 20 μM EGCg pre-treatment for 30 min or 400 μM H2O2-induced oxidative stress for 30 min with (lane 4) or without (lane 3) 20 μM EGCg pre-treatment. Bottom: Quantitative analyses using β-actin as the loading control. In a and b, the values are the mean ± SEM (n = 6), with *, # indicating a significant difference compared to the untreated cells or the H2O2-treated cells, respectively.
Figure 3
Figure 3
Effects on the cell cycle, and phosphorylated GSK-3β, GSK-3β, β-catenin, and cyclin D1 in H9c2 cells. (a) Top: Cell cycle phase determined by flow cytometry for H9c2 cells in the control medium (left top, label C), or in the medium containing 20 μM EGCg for 30 min (right top, label E), or in the medium containing 400 μM H2O2 for 30 min with (right bottom, label E + H) or without 20 μM EGCg pretreatment for 30 min (left bottom, label H). Bottom: Quantitative analysis of the cell cycle phase. (b) Western blotting (top) with quantitative analyses (bottom) of pGSK-3β, GSK-3β, and GAPDH levels for the H9c2 cells cultured in the medium as indicated. (c) Western blotting (top) with quantitative analyses (bottom) of β-catenin, cyclin D1, and β-actin levels for the H9c2 cells in the medium with the addition as indicated. (d) Western blots showing inhibition of GSK-3β on β-catenin levels in the H9c2 cells. Lane 1: cells cultured in the control medium; lane 2: cells cultured in the medium containing 20 μM EGCg for 30 min; lane 3: cells cultured in the medium containing 400 μM H2O2 for 30 min, lane 4: cells cultured in the medium containing 400 μM H2O2 for 30 min with 20 μM EGCg pre-treatment for 30 min, lane 5: cells cultured in the medium containing 400 μM H2O2 for 30 min with the pretreatment of 10 μM SB 216763 inhibitor of GSK-3α/3β for 30 min. In a, b, and c, the values are the mean ± SEM (n = 6), with *, # indicating a significant difference compared to the cells in control medium and the cells treated with H2O2, respectively.
Figure 4
Figure 4
EGCg-induced fluorescence changes in EGFP-expressing H9c2 cells and molecular identification on the EGFP-conjugated protein complex. (a) Fluorescence spectra showing the dose effect of EGCg on EGFP fluorescence. (b) Normalized EGFP fluorescence in the absence or presence of 0.1% Triton X-100. Fluorescence spectroscopy was performed as described in the Materials and Methods. The fluorescence emitted at 507 nm measured in the absence of EGCg was used to normalize the fluorescence changes caused by EGCg titrations. Each value is the mean of six measurements. (c) The EGFP co-precipitated proteins were separated by one-dimensional SDS-PAGE or (d) two-dimensional electrophoresis (2-DE), followed by proteomics acquiring MALDI-MS spectra. A co-immunoprecipitation assay reveals molecular identities by immunoblotting (IB) of the protein complexes (i.e., LR, β-actin, GAPDH, Cav-1 and -3) formed with EGFP in these cells.
Figure 5
Figure 5
Effects of H2O2 and/or EGCg on the expression of Cav in H9c2 cells. (a) Agarose gels demonstrating the presence of mRNAs encoding different Cav isoforms (Cav-1, Cav-2, and Cav-3) (left), and a histogram showing the Cav isoform mRNA levels relative to those of GAPDH mRNA in cells exposed to 0.4 mM H2O2 with (EH) or without 20 μM EGCg pretreatment (H) (right). (b) Immunoblot analysis reporting the protein levels of Cav-1 and phosphorylated Cav-1in whole cell lysates of H9c2 cells cultured in the medium as indicated. GAPDH was used as the internal control for data analysis. In a and b, each value is the mean ± SEM (n = 6). *indicates significant difference compared to H9c2 cells in control condition (C), and # symbolizes a significant difference compared to cells treated with H2O2 (H).
Figure 6
Figure 6
Effects of LAD ligation and GTPs on the myocardial content of LR, Cav-1, and Cav-3. (a) Western blotting with (b) quantitative analyses of 67 kD laminin receptor, Cav-1, and Cav-3 in the myocardium of sham controls (lane S) or post-LAD ligated rats with GTP supplementation (lanes 1, 2) or with water (lanes 3, 4) for 14 days. For post-LAD ligated rats supplemented with GTPs or water, cardiac tissues at the infarcted area (lanes 2, 4) and a remote myocardial site (lanes 1, 3) were isolated for analysis. Each group contains 5 animals for data analyses. The values are the means ± SEM, with *indicating a significant difference compared to the sham controls.
Figure 7
Figure 7
The Akt pro-survival pathway associated with GSK-3β signalling takes part in EGCg-mediated Cav-1 activation. (a) Western blotting with quantitative analyses of Akt phosphorylation at ser-473 and its downstream substrate GSK-3β phosphorylation at ser-9 in H9c2 cells. (b) Immunoblot analysis showing effects of EGCg and/or GSK-3β inhibition by GSK-3α/3β inhibitor, SB 216763, on the phosphorylation of pGSK-3β (S9) and pCav-1 (Y14) in H2O2-induced H9c2 cells. (c) MTT assay showing the improvement of H2O2,-suppressed cell viability by EGCg and/or GSK-3β inhibitor, SB 216763 pre-treatment in H2O2-induced H9c2 cells. In a and b, each value is the mean ± SEM (n = 6). *indicates significant difference compared to H9c2 cells in control condition, and # symbolizes a significant difference compared to cells treated with H2O2 (H). In a and c, each value is the mean ± SEM (n = 6). *indicates significant difference compared to H9c2 cells in control condition, # symbolizes a significant difference compared to cells treated with H2O2, and $ represents a significant difference compared to cells pretreated with EGCg in prior to H2O2 treatment.

Similar articles

Cited by

References

    1. Stangl V, Dreger H, Stangl K, Lorenz M. Molecular targets of tea polyphenols in the cardiovascular system. Cardiovasc Res. 2007;73:348–358. doi: 10.1016/j.cardiores.2006.08.022. - DOI - PubMed
    1. Mak JC. Potential role of green tea catechins in various disease therapies: Progress and promise. Clin Exp Pharmacol Physiol. 2012;39:265–273. doi: 10.1111/j.1440-1681.2012.05673.x. - DOI - PubMed
    1. Shieh SR, Tsai DC, Chen JY, Tsai SW, Liou YM. Green tea extract protects rats against myocardial infarction associated with left anterior descending coronary artery ligation. Pflugers Arch. 2009;458:631–642. doi: 10.1007/s00424-009-0655-1. - DOI - PubMed
    1. Liou YM, Hsieh SR, Wu TJ, Chen JY. Green tea extract given before regional myocardial ischemia-reperfusion in rats improves myocardial contractility by attenuating calcium overload. Pflugers Arch. 2010;460:1003–1014. doi: 10.1007/s00424-010-0881-6. - DOI - PubMed
    1. Dreger H, Lorenz M, Kehrer A, Baumann G, Stangl K, Stangl V. Characteristics of catechin- and theaflavin-mediated cardioprotection. Exp Biol Med (Maywood) 2008;233:427–433. doi: 10.3181/0710-RM-292. - DOI - PubMed

Publication types

MeSH terms