. 2013 Dec;25(12):992-e779.
doi: 10.1111/nmo.12238. Epub 2013 Oct 8.

Intrinsic functional connectivity of the brain swallowing network during subliminal esophageal acid stimulation

Affiliations

Intrinsic functional connectivity of the brain swallowing network during subliminal esophageal acid stimulation

A Babaei et al. Neurogastroenterol Motil. 2013 Dec.

Abstract

Background: Intrinsic synchronous fluctuations of the functional magnetic resonance imaging signal are indicative of the underlying 'functional connectivity' (FC) and serve as a technique to study dynamics of the neuronal networks of the human brain. Earlier studies have characterized the functional connectivity of a distributed network of brain regions involved in swallowing, called brain swallowing network (BSN). The potential modulatory effect of esophageal afferent signals on the BSN, however, has not been systematically studied.

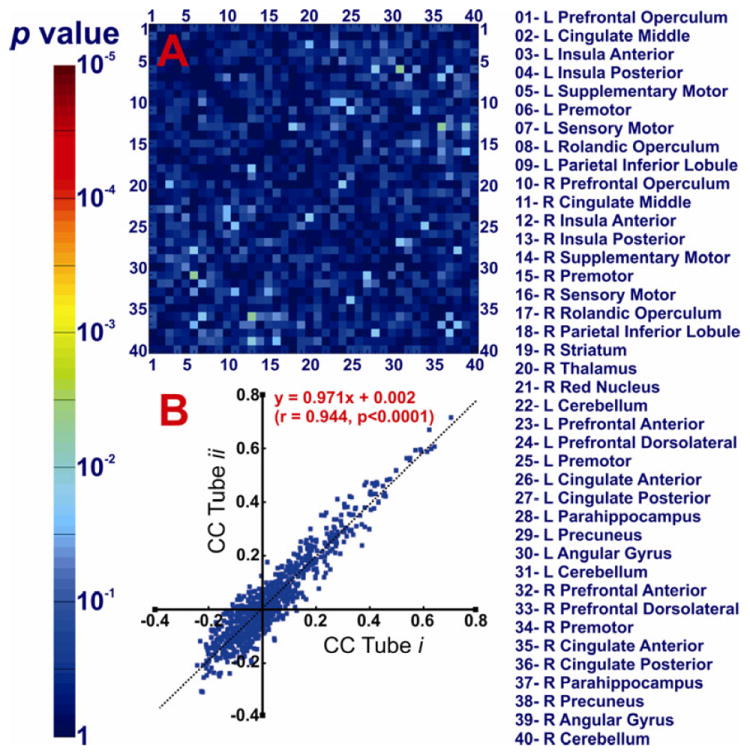
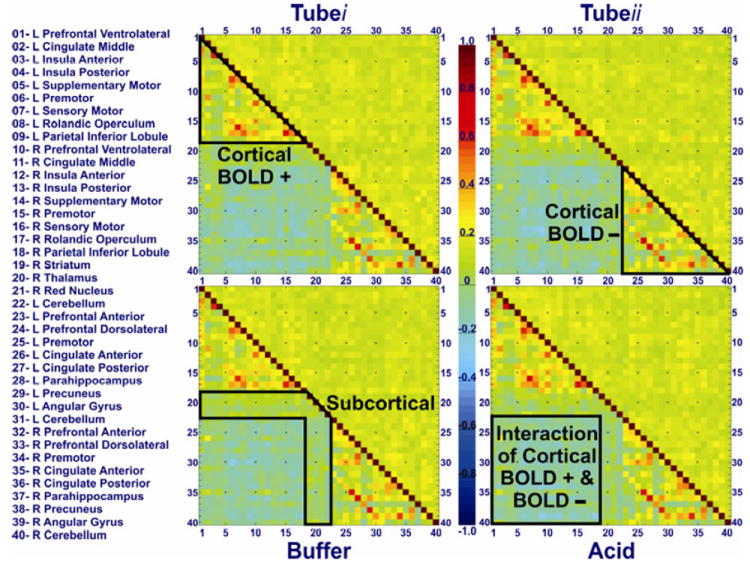
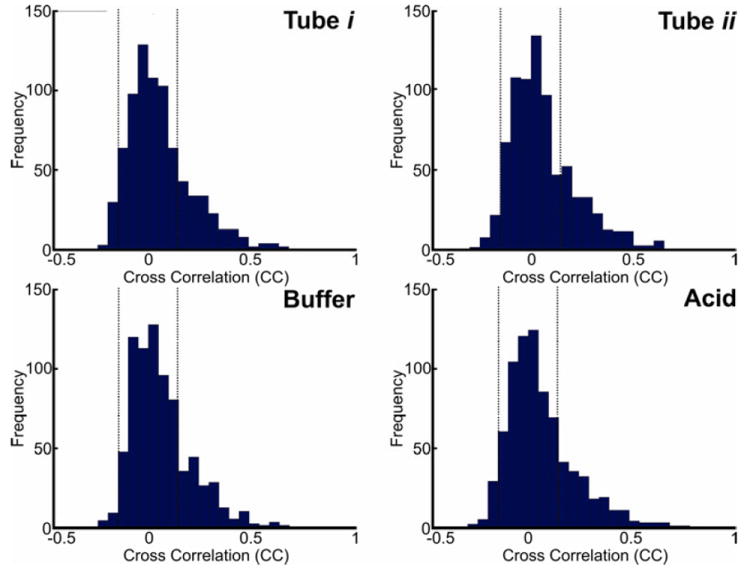
Methods: Fourteen healthy volunteers underwent steady state functional magnetic resonance imaging across three conditions: (i) transnasal catheter placed in the esophagus without infusion; (ii) buffer solution infused at 1 mL/min; and (iii) acidic solution infused at 1 mL/min. Data were preprocessed according to the standard FC analysis pipeline. We determined the correlation coefficient values of pairs of brain regions involved in swallowing and calculated average group FC matrices across conditions. Effects of subliminal esophageal acidification and nasopharyngeal intubation were determined.

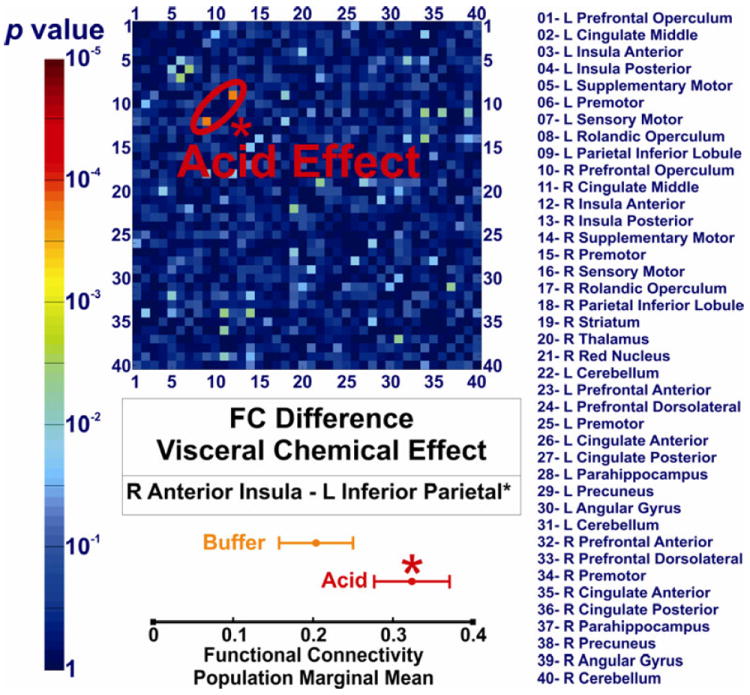
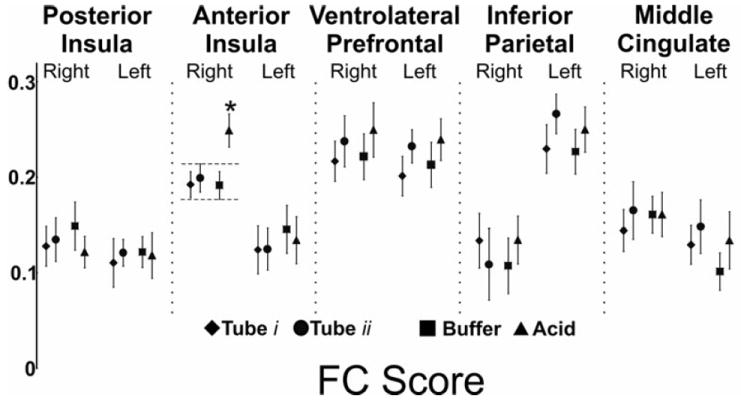
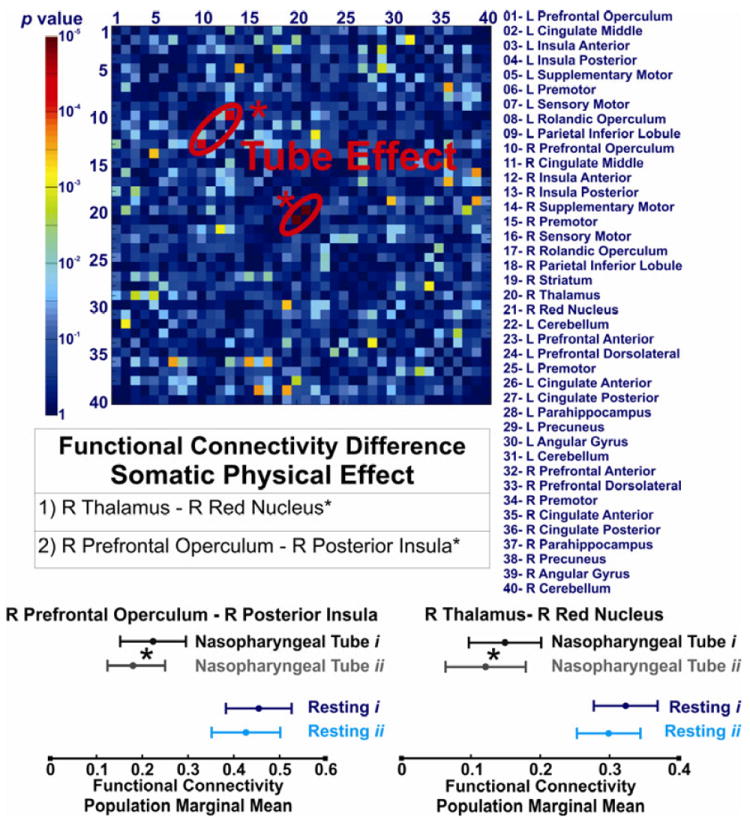
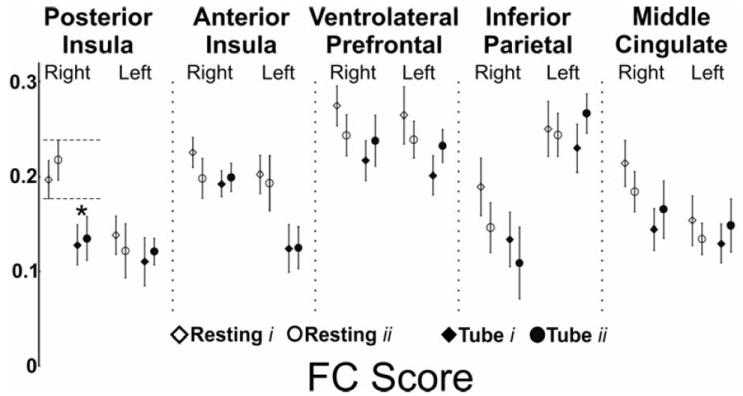
Key results: Subliminal esophageal acid stimulation augmented the overall FC of the right anterior insula and specifically the FC to the left inferior parietal lobule. Conscious stimulation by nasopharyngeal intubation reduced the overall FC of the right posterior insula, particularly the FC to the right prefrontal operculum.

Conclusions & inferences: The FC of BSN is amenable to modulation by sensory input. The modulatory effect of sensory pharyngoesophageal stimulation on BSN is mainly mediated through changes in the FC of the insula. The alteration induced by subliminal visceral esophageal acid stimulation is in different insular connections compared with that of conscious somatic pharyngeal stimulation.

Keywords: buffer; cortical swallowing network; default mode network; negative BOLD; resting connectivity.


Conflict of interest statement

The authors have no conflict of interest to disclose.

Figures

Figure 1
Figure 1. Functional connectivity matrix of the brain swallowing network after nasopharyngeal intubation (tube i and tube ii) and during subliminal acid and buffer infusion
Participants were awake but closed their eyes. Forty regions of interest that showed significant group BOLD activation (either positive or negative) during an independently obtained fMRI scan in the same population were used as seeds for subsequent connectivity analysis as described previously , . Color scale in the middle shows the spectrum of Pearson product moment-correlation coefficient (CC) values ranging from -1 to 1. The diagonal of the matrix from the upper left to the lower right corners represents connectivity of each seed region with a CC value of 1 (i.e. completely correlated). The lower left section of FC matrix below this diagonal represents CC values and the right upper section of the matrix above the diagonal represents the standard deviation of each corresponding CC. Forty seeds are enumerated on the x- and y- axes, and their corresponding FC range from -0.40 to +1.00. Connections between the first eighteen rows and columns (1-18) of the matrix represent FC of cortical positive BOLD activated seeds (top left demarcated triangle of FC matrix) and the last eighteen rows and columns (23-40) denote FC of negative BOLD activated seeds (bottom right demarcated triangle). Middle four (19-22) ROIs represent FC of subcortical positive BOLD activated seeds (demarcated middle band). Cells corresponding to the interface of the first eighteen and last eighteen rows represent the interaction of FC between positively and negatively BOLD activated seed regions (bottom left demarcated square of FC matrix).
Figure 2
Figure 2. Frequency histogram of cross correlation (CC) values of the brain swallowing network (BSN) across study conditions (tube i, tube ii, buffer and acid)
CC values of the BSN were not normally distributed and the histogram was similarly skewed to the right across all study conditions. CC values were Fisher z-transformed to assure normalized distribution of the data for further analyses. The absolute CC values higher than 0.165 (|r| > 0.165, two-tailed p < 0.01) are considered statistically significant. The dotted vertical line demonstrates that the majority of CC values were located in interaction section of BOLD positive and negative regions (76%) and were not statistically significant.
Figure 3
Figure 3. Effect of subliminal visceral chemical stimulation (esophageal acid exposure) on the functional connectivity of the brain swallowing network
The corresponding p values of comparing 780 functional connectivity values among forty seed regions in acid and buffer conditions are demonstrated as a color scale. Forty seed regions are listed and shown on x- and y- axes numerically. The only connection that is significantly different is between right anterior insula and left inferior parietal lobule. This difference survived the false discovery rate (FDR) correction for multiple comparisons (q < 0.05).
Figure 4
Figure 4. Comparison of the tube i and tube ii conditions to investigate the potential order effect on the functional connectivity of the brain swallowing network
A) The corresponding p values of comparing 780 functional connectivity values among forty seed regions in tube i and ii conditions are demonstrated as a color scale. Forty seed regions are listed and shown on x- and y- axes numerically. No connection demonstrated a significant difference between tube i at the beginning of scanning session, and tube ii at the end of scanning session. B) Linear regression analysis of the cross correlation (CC) values shows highly reproducible values between tube i and ii conditions. This result is suggesting that timing of the scan in the session had no systematic effect on CC values. These findings are indicative of no measurable order effect on the functional connectivity of the brain swallowing network.
Figure 5
Figure 5. Effect of subliminal visceral chemical stimulation (esophageal acid) on the functional connectivity score of brain swallowing network
We measured the average functional connectivity score of every seed region across all study conditions. Analysis of variance and post-hoc analysis showed that FC score of the right anterior insula during acid infusion is significantly higher during acid infusion compared to all other study conditions including buffer infusion (p < 0.05).
Figure 6
Figure 6. Effect of perceived somatic physical stimulation (nasopharyngeal tube presence) on the functional connectivity of the brain swallowing network
The corresponding p values of comparing 780 functional connectivity values among forty seed regions in resting and tube conditions are demonstrated as a color scale. Forty seed regions are listed and shown on x- and y- axes numerically. The following connections showed significant difference during presence of nasopharyngeal tube: between the right thalamus and the right red nucleus in subcortical regions and between the right posterior insula and the right prefrontal operculum in cortical BOLD positive seeds. These differences survived the false discovery rate (FDR) correction for multiple comparisons (q < 0.05).
Figure 7
Figure 7. Effect of perceived somatic physical stimulation (nasopharyngeal tube presence) on the functional connectivity score (FC) of the brain swallowing network
We measured the average functional connectivity score of every seed region both at rest and after nasopharyngeal intubation. Analysis of variance and post-hoc analysis showed that FC score of the right posterior insula during presence of nasopharyngeal tube is significantly diminished compared to the pure resting state (p < 0.05).

Similar articles

Cited by

References

    1. Hamdy S, Mikulis DJ, Crawley A, Xue S, Lau H, Henry S, Diamant NE. Cortical activation during human volitional swallowing: an event-related fMRI study. Am J Physiol. 1999;277:G219–25. - PubMed
    1. Kern M, Birn R, Jaradeh S, Jesmanowicz A, Cox R, Hyde J, Shaker R. Swallow-related cerebral cortical activity maps are not specific to deglutition. Am J Physiol Gastrointest Liver Physiol. 2001;280:G531–8. - PubMed
    1. Martin RE, Goodyear BG, Gati JS, Menon RS. Cerebral cortical representation of automatic and volitional swallowing in humans. J Neurophysiol. 2001;85:938–50. - PubMed
    1. Mosier KM, Liu WC, Maldjian JA, Shah R, Modi B. Lateralization of cortical function in swallowing: a functional MR imaging study. AJNR Am J Neuroradiol. 1999;20:1520–6. - PMC - PubMed
    1. Babaei A, Ward BD, Ahmad S, Patel A, Nencka A, Li SJ, Hyde J, Shaker R. Reproducibility of swallow-induced cortical BOLD positive and negative fMRI activity. American journal of physiology Gastrointestinal and liver physiology. 2012;303:G600–9. - PMC - PubMed

Publication types

Substances

LinkOut - more resources