Review
. 2014 Apr;24(4):625-38.
doi: 10.1089/thy.2013.0344. Epub 2014 Jan 17.

Intrinsic regulation of thyroid function by thyroglobulin

Affiliations
Review

Intrinsic regulation of thyroid function by thyroglobulin

Donald F Sellitti et al. Thyroid. 2014 Apr.

Abstract

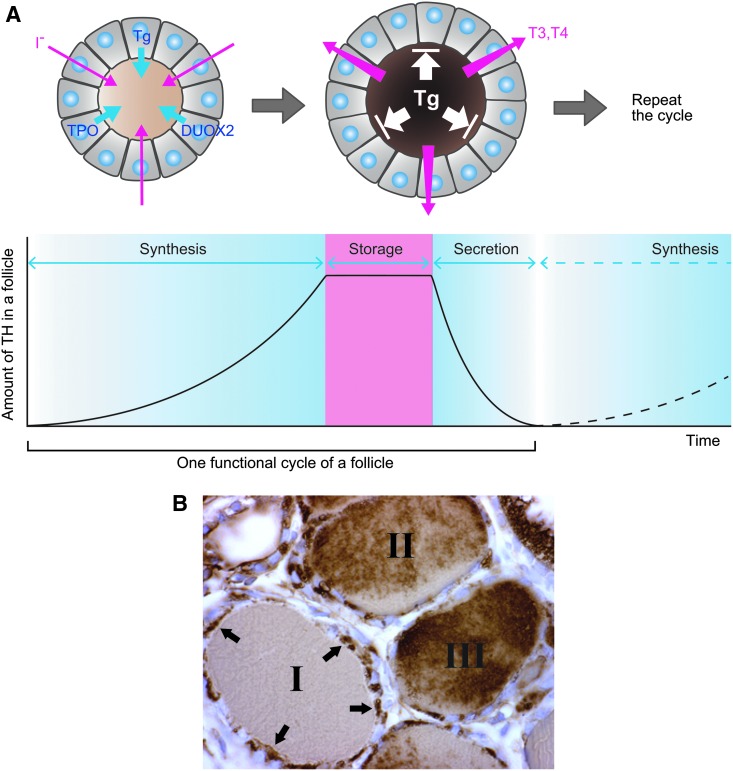
Background: The established paradigm for thyroglobulin (Tg) function is that of a high molecular weight precursor of the much smaller thyroid hormones, triiodothyronine (T3) and thyroxine (T4). However, speculation regarding the cause of the functional and morphologic heterogeneity of the follicles that make up the thyroid gland has given rise to the proposition that Tg is not only a precursor of thyroid hormones, but that it also functions as an important signal molecule in regulating thyroid hormone biosynthesis.

Summary: Evidence supporting this alternative paradigm of Tg function, including the up- or downregulation by colloidal Tg of the transcription of Tg, iodide transporters, and enzymes employed in Tg iodination, and also the effects of Tg on the proliferation of thyroid and nonthyroid cells, is examined in the present review. Also discussed in detail are potential mechanisms of Tg signaling in follicular cells.

Conclusions: Finally, we propose a mechanism, based on experimental observations of Tg effects on thyroid cell behavior, that could account for the phenomenon of follicular heterogeneity as a highly regulated cycle of increasing and decreasing colloidal Tg concentration that functions to optimize thyroid hormone production through the transcriptional activation or suppression of specific genes.


Figures

<b>FIG. 1.</b>
FIG. 1.
(A) Scanning electron micrograph of capillary plexus surrounding follicles in rhesus monkey thyroid. Basket-like structures represent methacryl resin-fixed vasculature remaining after lysis of follicular components. (Reproduced with permission of Fujita et al.) (16). (B) An example of follicular heterogeneity in rat thyroid stained for thyroglobulin (Tg) using immunohistochemistry. Adjacent follicles are of similar size but significantly different colloidal Tg content.
<b>FIG. 2.</b>
FIG. 2.
Thyroid development in the rat, illustrating early occurrence of heterogeneity. (A) Cross-section through developing trachea, esophagus, and thyroid anlage (Thy) on day 15; hematoxylin and eosin (H&E) stain. (B) Higher magnification of thyroid anlage, day 15, H&E stain. (C) Thyroid anlage, day 15, Tg immunostain. (D) Cross-section through thyroid, trachea, and esophagus on day 17; Tg immunostain. (E) Higher magnification of thyroid on day 17; Tg immunostain. (F) Thyroid on day 17, thyroxine (T4) immunostaining.
<b>FIG. 3.</b>
FIG. 3.
Unique effect of Tg on expression of thyroid-specific genes and iodide flux in FRTL-5 rat thyroid cells. (A–D) relative mRNA expression levels of genes essential for thyroid hormone synthesis: Tg (A), Tpo (B), and Slc5a5 (NIS) (C), compared to the housekeeping gene, Gapdh (D). Figures also include appropriate controls for possible nonspecific effects of Tg due to its high osmotic pressure and protein content: bovine serum albumin (BSA) and mannitol (MT). (E) Effect of Tg on Tg expression in the presence or absence of thyrotropin (TSH) compared with BSA and MT controls. (F) and (G) Radioactive iodide uptake into cells after treatment with Tg or BSA (control) shown as a function of time (F) and concentration (G). Concentrations of Tg and BSA were 0.1–10 mg/mL. Concentrations of MT were 0.1 and 1 mg/mL. *p<0.05; **p<0.01; ***p<0.001 compared with untreated control.
<b>FIG. 4.</b>
FIG. 4.
Opposing concentrations of Tg and iodide at the periphery of rat thyroid follicles. Tg distribution is identified using immunohistochemistry, and iodide distribution using 125I and autoradiography. Arrows point to rim of Tg staining (retained after autoradiography) concentrated at the apical surface of follicular cells in areas where a paucity of silver grains suggests that iodide uptake has been suppressed.
<b>FIG. 5.</b>
FIG. 5.
Kinetics of subcellular immunogold-labeled Tg distribution after TSH. The number of gold-labeled particles was counted in each of several subcellular organelles. CD, internalized colloid droplets; rER, rough endoplasmic reticulum; SG, secretory vesicles (granules).
<b>FIG. 6.</b>
FIG. 6.
(A) Model for a thyroid follicular cycle of thyroid hormone (TH) synthesis and release controlled by follicular Tg. The amplitude of the graph represents the relative amount of TH in a follicle during one full cycle of synthesis, storage, and secretion. Follicles illustrated at the top represent two functional and morphological extremes of Tg concentration and TH production corresponding to the graph below. The follicle at the extreme left shows a follicle depleted of Tg (light brown) following the end of the last cycle. Depressed Tg, TPO, and DUOX 2 expression and entry into follicle are illustrated with by blue arrows. Red arrows show increased basal and apical iodide transport. The follicle to the right of this shows the result of increased Tg (dark brown) during the preceding page. White arrows represent the apical signal generated by Tg that represses further gene transcription of TH-synthetic genes. Under the influence of circulating TSH and other hormones, iodinated Tg is endocytosed and triiodothyronine (T3) and T4 secretion begin (red arrows). Details of the cycle are explained in the text. (B) Follicular heterogeneity of Tg distribution in rat thyroid stained for Tg using immunohistochemistry adapted from an original figure used in a previous publication (57). Three adjacent follicles varying widely in staining intensity, ranging from a low Tg follicle (I) through a follicle of intermediate Tg staining (II) to a follicle heavily stained for Tg (III). Also seen is a variation in cell height and intracellular Tg staining, with the most squamous epithelium and greatest intracellular Tg staining occurring in follicle I. Arrows indicate cytoplasmic Tg staining that corresponds to the staining of rER and Golgi apparatus (28,37,101).

Similar articles

Cited by

References

    1. Dunn JT, Dunn AD.2000Thyroglobulin: chemistry, biosynthesis, and proteolysis. In: Braverman LE, Utiger RD. (eds) Werner & Ingbar's The Thyroid: A Fundamental and Clinical Text. Eighth edition. Lippincott Williams & Wilkins, Philadelphia, PA, pp. 91–104
    1. van de Graaf SA, Ris-Stalpers C, Pauws E, Mendive FM, Targovnik HM, de Vijlder JJ.2001Up to date with human thyroglobulin. J Endocrinol 170:307–321 - PubMed
    1. Ciocca DR, Puy LA, Stati AO.1984Constitution and behavior of follicular structures in the human anterior pituitary gland. Am J Pathol 115:165–174 - PMC - PubMed
    1. Capen CC.2000Anatomy In: Braverman LE, Utiger RD. (eds) Werner & Ingbar's The Thyroid: A Fundamental and Clinical Text. Eighth edition. Lippincott Williams & Wilkins, Philadelphia, PA, pp 20–51
    1. Fonseca TL, Correa-Medina M, Campos MP, Wittmann G, Werneck-de-Castro JP, Arrojo e Drigo R, Mora-Garzon M, Ueta CB, Caicedo A, Fekete C, Gereben B, Lechan RM, Bianco AC.2013Coordination of hypothalamic and pituitary T3 production regulates TSH expression. J Clin Invest 123:1492–1500 - PMC - PubMed

Publication types

LinkOut - more resources