

Computer quantification of airway collapse on forced expiration to predict the presence of emphysema
- PMID: 24251975
- PMCID: PMC3870969
- DOI: 10.1186/1465-9921-14-131
Computer quantification of airway collapse on forced expiration to predict the presence of emphysema
Abstract
Background: Spirometric parameters are the mainstay for diagnosis of COPD, but cannot distinguish airway obstruction from emphysema. We aimed to develop a computer model that quantifies airway collapse on forced expiratory flow-volume loops. We then explored and validated the relationship of airway collapse with computed tomography (CT) diagnosed emphysema in two large independent cohorts.
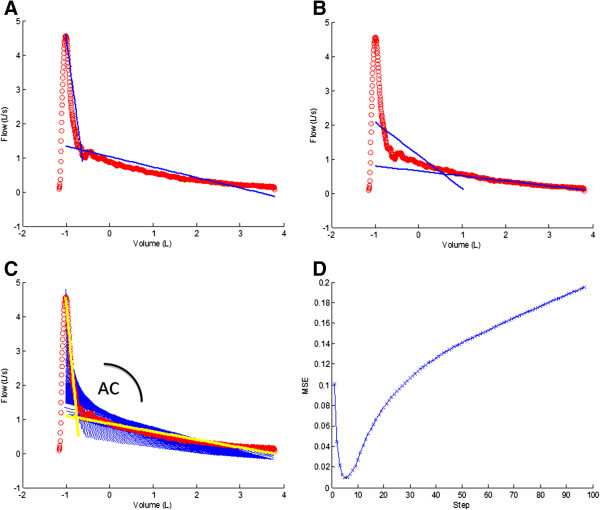
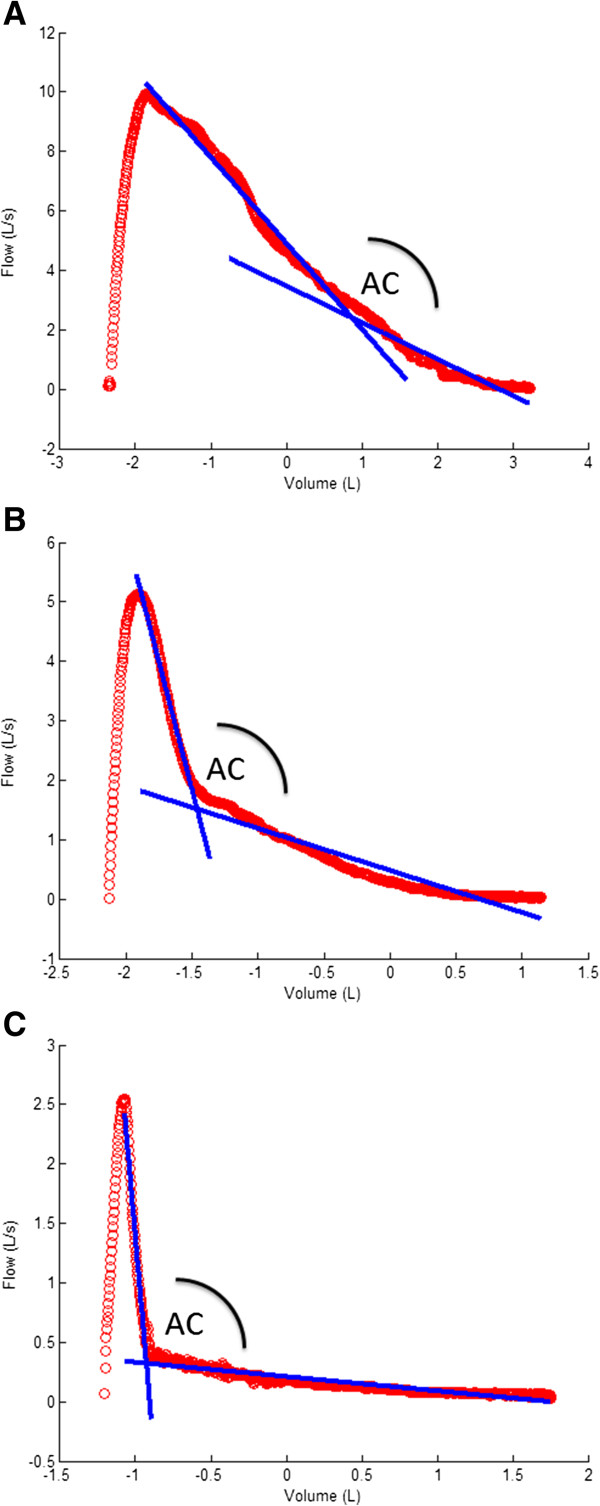
Methods: A computer model was developed in 513 Caucasian individuals with ≥15 pack-years who performed spirometry, diffusion capacity and CT scans to quantify emphysema presence. The model computed the two best fitting regression lines on the expiratory phase of the flow-volume loop and calculated the angle between them. The collapse was expressed as an Angle of collapse (AC) which was then correlated with the presence of emphysema. Findings were validated in an independent group of 340 individuals.
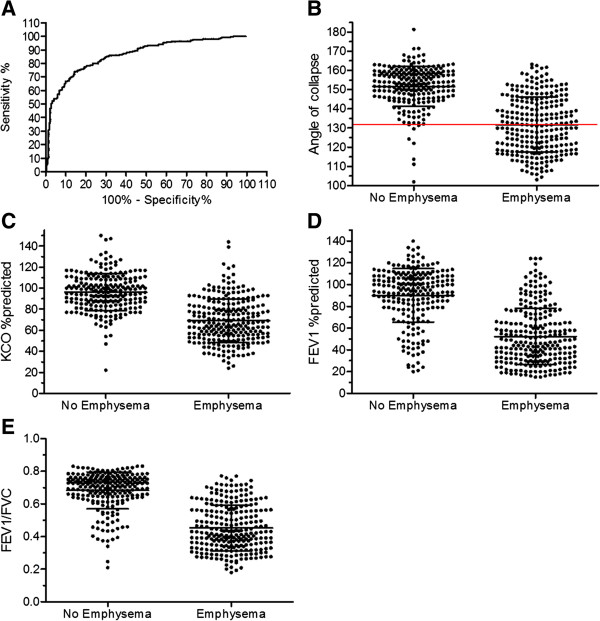
Results: AC in emphysema subjects (N = 251) was significantly lower (131° ± 14°) compared to AC in subjects without emphysema (N = 223), (152° ± 10°) (p < 0.0001). Multivariate regression analysis revealed AC as best indicator of visually scored emphysema (R2 = 0.505, p < 0.0001) with little significant contribution of KCO, %predicted and FEV1, %predicted to the total model (total R2 = 0.626, p < 0.0001). Similar associations were obtained when using CT-automated density scores for emphysema assessment. Receiver operating characteristic (ROC) curves pointed to 131° as the best cut-off for emphysema (95.5% positive predictive value, 97% specificity and 51% sensitivity). Validation in a second group confirmed the significant difference in mean AC between emphysema and non-emphysema subjects. When applying the 131° cut-off, a positive predictive value of 95.6%, a specificity of 96% and a sensitivity of 59% were demonstrated.
Conclusions: Airway collapse on forced expiration quantified by a computer model correlates with emphysema. An AC below 131° can be considered as a specific cut-off for predicting the presence of emphysema in heavy smokers.
Figures
References
-
- Murray CJ, Lopez AD. Alternative projections of mortality and disability by cause 1990-2020: global burden of disease study. Lancet. 1997;349:1498–1504. - PubMed
-
- WHO. World health statistics. 2008. http://www.who.int/whosis/whostat/EN_WHS08_Full.pdf . 2012.
-
- Mannino DM, Buist AS. Global burden of COPD: risk factors, prevalence, and future trends. Lancet. 2007;370:765–773. - PubMed
Publication types
MeSH terms
LinkOut - more resources
Full Text Sources
Other Literature Sources
Medical
