. 2014 Feb;224(2):132-41.
doi: 10.1111/joa.12138. Epub 2013 Nov 20.

Osteoblast-osteocyte transformation. A SEM densitometric analysis of endosteal apposition in rabbit femur

Affiliations

Osteoblast-osteocyte transformation. A SEM densitometric analysis of endosteal apposition in rabbit femur

Ugo E Pazzaglia et al. J Anat. 2014 Feb.

Abstract

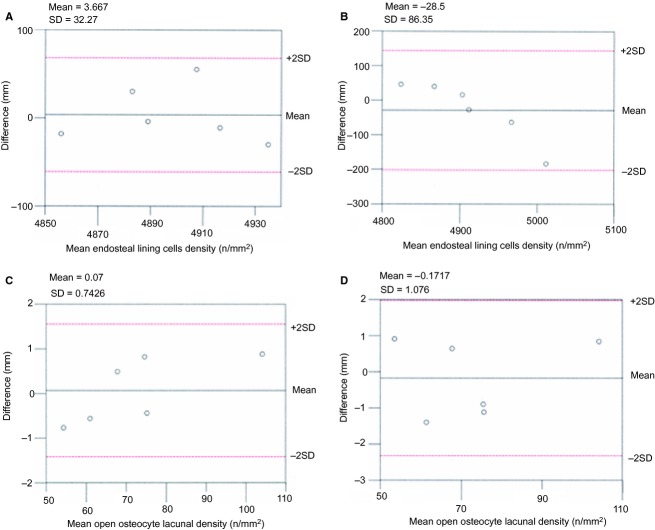
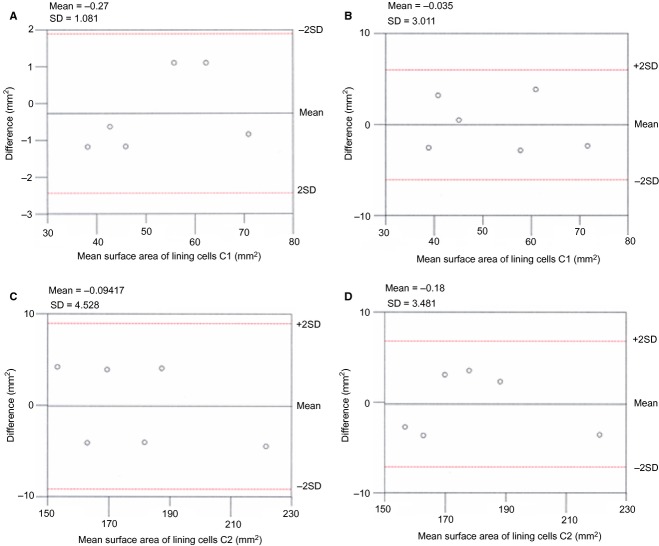
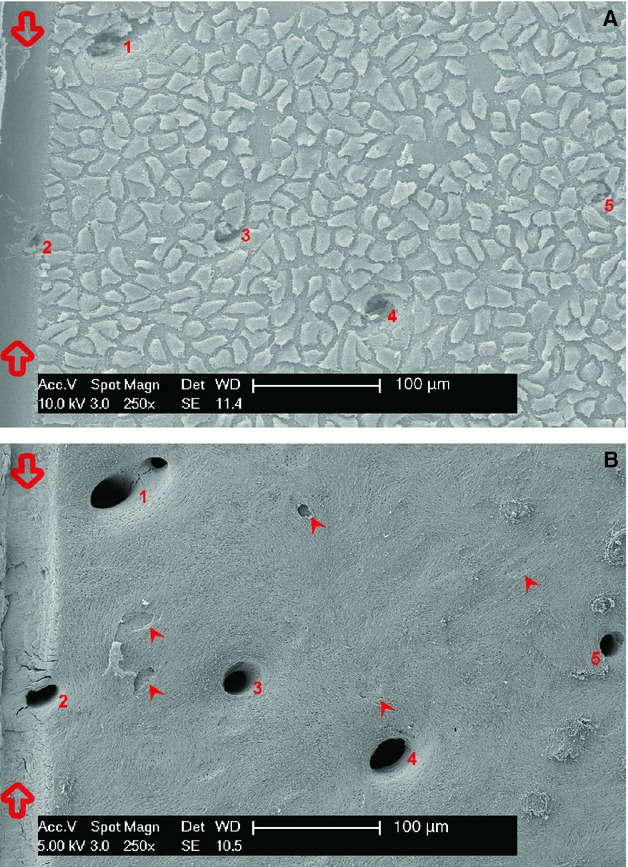
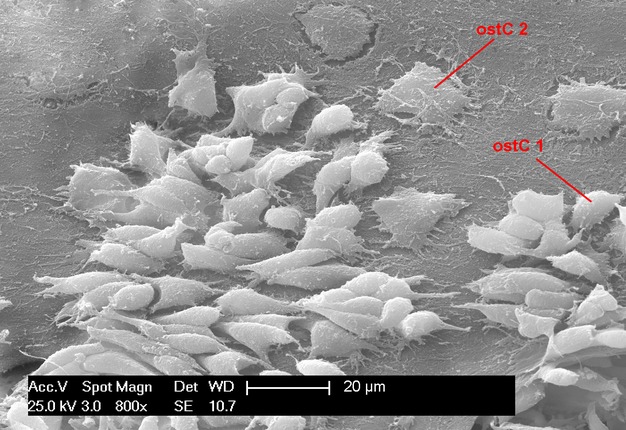
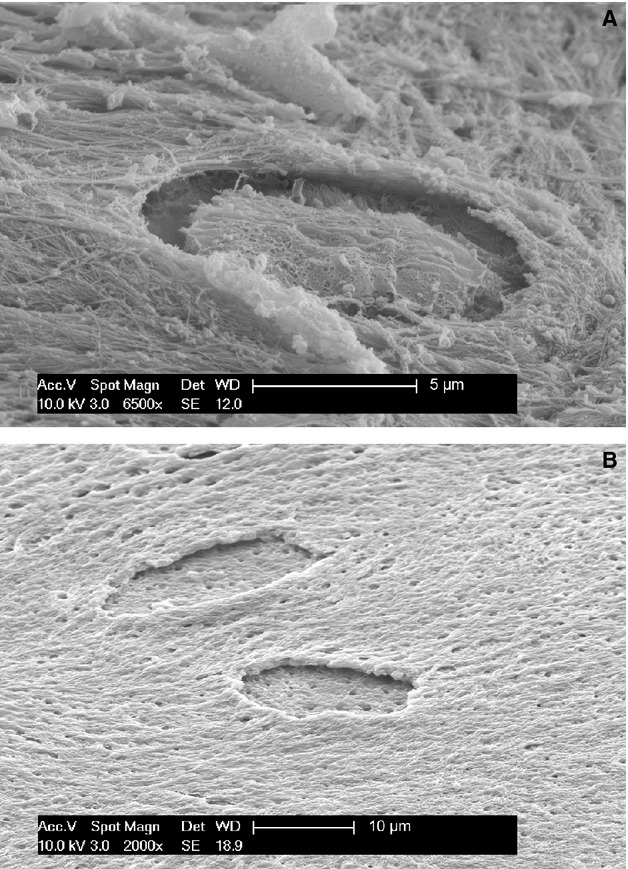
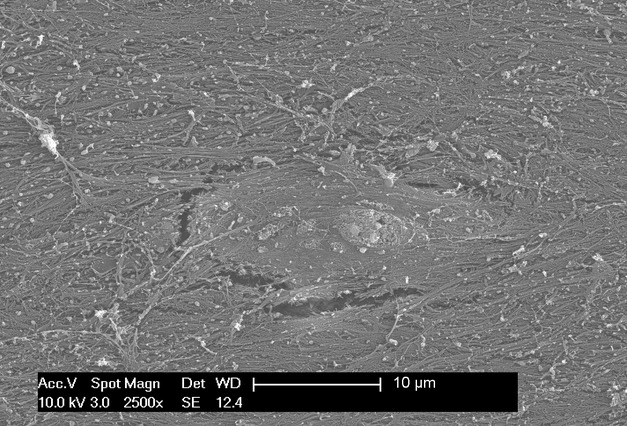
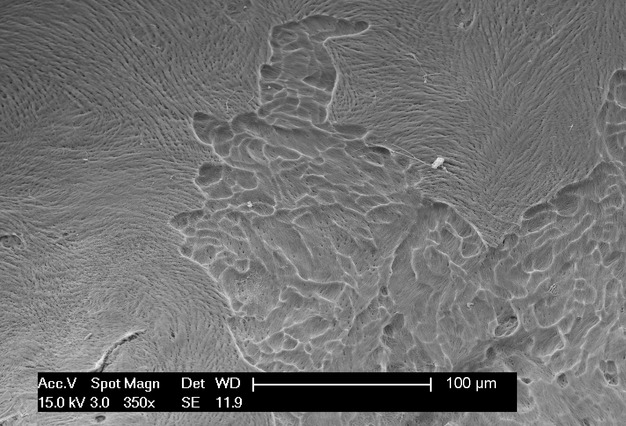
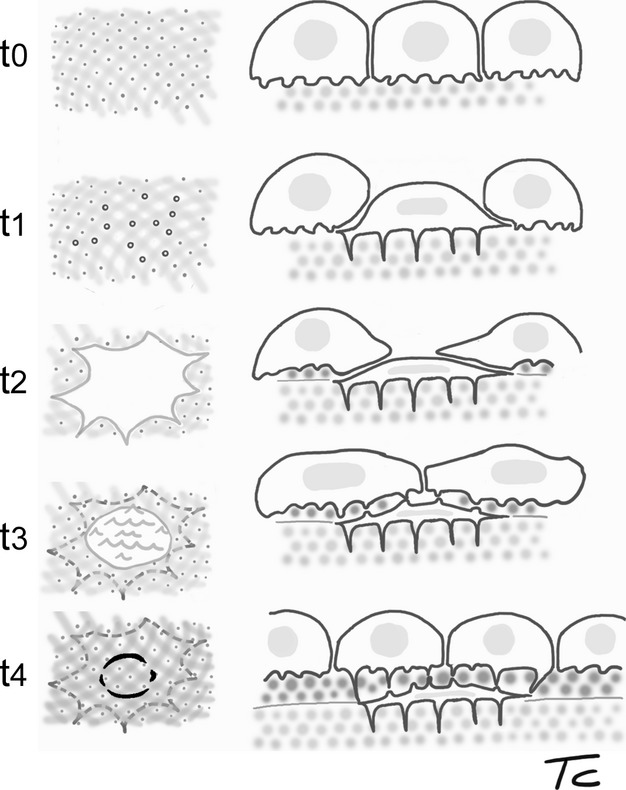
Transformation of osteoblasts into osteocytes is marked by changes in volume and cell shape. The reduction of volume and the entrapment process are correlated with the synthesis activity of the cell which decreases consequently. This transformation process has been extensively investigated by transmission electron microscopy (TEM) but no data have yet been published regarding osteoblast-osteocyte dynamic histomorphometry. Scanning electron microscope (SEM) densitometric analysis was carried out to determine the osteoblast and open osteocyte lacunae density in corresponding areas of a rabbit femur endosteal surface. The lining cell density was 4900.1 ± 30.03 n mm(-2), the one of open osteocyte lacunae 72.89 ± 22.55 n mm(-2). This corresponds to an index of entrapment of one cell every 67.23 osteoblasts (approximated by defect). The entrapment sequence begins with flattening of the osteoblast and spreading of equatorial processes. At first these are covered by the new apposed matrix and then also the whole cellular body of the osteocyte undergoing entrapment. The dorsal aspect of the cell membrane suggests that closure of the osteocyte lacuna may be partially carried out by the same osteoblast-osteocyte which developed a dorsal secretory territory. A significant proportion of the endosteal surface was analysed by SEM, without observing any evidence of osteoblast mitotic figures. This indicates that recruitment of the pool of osteogenic cells in cortical bone lamellar systems occurs prior to the entrapment process. No further additions occurred once osteoblasts were positioned on the bone surface and began lamellar apposition. The number of active osteoblasts on the endosteal surface exceeded that of the cells which become incorporated as osteocytes (whose number was indicated by the number of osteocyte lacunae). Therefore such a balance must be equilibrated by the osteoblasts' transformation in resting lining cells or by apoptosis. The current work characterised osteoblast shape changes throughout the entrapment process, allowing approximate calculation of an osteoblast entrapment index in the rabbit endosteal cortex.

Keywords: osteoblast; osteocyte; osteocyte entrapment.


Figures

Figure 1
Figure 1
Scheme showing the dorsal hemicortex of the rabbit distal femur diaphysis. The central sector is nearly flat similar to that of the ventral hemicortex. A rectangular module (5 × 2 mm) oriented along the longitudinal axis was traced to mark the boundary of the central fields used to assess osteoblasts and open osteocyte lacunae density.
Figure 2
Figure 2
Scatterplots showing: (A) mean of paired measurements (intraobserver) plotted against differences in the density assessment of lining cells; (B) mean of paired measurements (interobserver) plotted against differences in the density assessment of lining cells; (C) mean of paired measurements (intraobserver) plotted against differences in the density assessment of open osteocyte lacunae; (D) mean of paired measurements (interobserver) plotted against differences in the density assessment of open osteocyte lacunae.
Figure 3
Figure 3
Scatterplots showing: (A) mean surface area of lining cells C1 paired measurements (intraobserver) plotted against differences in surface area assessment; (B) mean surface area of lining cells C1 paired measurements (interobserver) plotted against differences in surface area assessment; (C) mean surface area of lining cells C2 paired measurements (intraobserver) plotted against differences in surface area assessment; (D) mean surface area of lining cells C2 paired measurements (interobserver) plotted against differences in surface area assessment.
Figure 4
Figure 4
(A) Scanning electron microscopy (SEM)/secondary electron imaging (SEI) (magnification 250×). The groove on the left (between empty arrows) corresponds to the border of the rectangular module used as reference for densitometry. The sheet of endosteal lining cells (osteoblasts) was exposed after marrow removal with cacodylate buffer irrigation. The cells are homogeneously distributed on the endosteal surface and are continuous with those lining the cortical vascular canals abutting the medullary canal (numbered from 1 to 5). Shrinkage led to the observed intercellular gap and floating cell boundaries. (B) SEM/SEI + OsO+ K3[Fe(CN)6] (osmium tetraoxide and potassium ferrocyanide) (magnification 250×). The same field after maceration with osmium tetraoxide and potassium ferrocyanide shows the cortex vascular canals opening into the medullary canal (numbered 1 to 5). Osteocyte lacunae appear of different depth and correspond to a more or less advanced phase of osteocyte entrapment (arrowheads). The holes of the radial canalicula mark the boundary of the entrapping cell territory. Smaller canalicula holes are homogeneously distributed on the whole endosteal surface corresponding to the dendrites of full active osteoblasts (not committed to entrapment).
Figure 5
Figure 5
SEM/SEI (magnification 800×). Endosteal surface of the right femur hemicortex, after ultrasonication treatment which mechanically detached a portion of lining cells. The lower cell surface density allowed observation of the relationship of cells and their membrane processes with the underlying bone substrate. The image illustrates the shape modulation that is undergone during entrapment. Osteoblasts of population C2 (ostC2) had a flattened bone surface and spread equatorial dendrites. The osteoblast population C1 (ostC1) showed reduced marginal adhesion to the bone, and the mean surface area was significantly lower than that of the C2 population. Different phases of entrapment are also evident in the top right and left corner, as well as the top middle of the figure.
Figure 6
Figure 6
(A) SEM/SEI (magnification 6500×). Progression of osteocyte entrapment, which occurs centripetally as the basal floor of the endosteal surface grows upwards. The dorsal osteocyte membrane possessed crests and vesicles, suggesting development of a dorsal secretory territory during this phase of entrapment. (B) SEM/SEI OsO3 + K3[Fe(CN)6] (magnification 2000×). Detail of two unfinished osteocyte lacunae after maceration with osmium tetraoxide and potassium ferrocyanide. The floor of the lacuna is almost flat, with the openings of the radial canalicula of the osteocyte undergoing entrapment. The lacunar edges appear undermined due to entrapment process centripetal progression. The holes on the bone surface correspond to openings of canalicula left by dendrites of the regular osteoblast layer (removed by maceration).
Figure 7
Figure 7
SEM/SEI (magnification 2500×). Detail of an osteocyte lacuna which has almost completed coverage of the roof. The endosteal surface is flat, but a small bump and fissures reveal the position of the recently closed lacuna.
Figure 8
Figure 8
SEM/SEI OsO4 + K3[Fe(CN)6] (magnification 350×) An endosteal resorption zone after maceration with osmium tetraoxyde and potassium ferrocyanide illustrating the superficial and confluent resorption pits produced by the osteoclasts in the distal metaphysis.
Figure 9
Figure 9
Scheme illustrating the sequential steps of osteoblast-osteocyte transformation and cell entrapment, based on SEM surface observations from the current study. The left column shows the surface as seen from the top: sequential steps t0 and t1 correspond to osmium tetraoxide/ferrocyanide macerated surfaces, used to show the canalicula holes; t3 and t4 schematise the bone surface after removal of the osteoblast superficial layer. The dotted circles indicate the perimeters of entrapping or entrapped osteocytes. The right column represents the corresponding top to deep position of the cells with respect to the endosteal surface of the femur.

References

    1. Ali NN, Mehuish PB, Boyde A, et al. Parathyroid hormone, but not prostaglandin E2, changes the shape of osteoblasts maintained on bone in vitro. J Bone Miner Res. 1990;5:115–121. - PubMed
    1. Ascenzi A, Bonucci E. The compressive properties of single osteons. Anat Rec. 1968;161:377–391. - PubMed
    1. Baud CA. Submicroscopic structure and functional aspects of the osteocyte. Clin Orthop Relat Res. 1968;56:227–236. - PubMed
    1. Bland JM, Altman DG. Statistical methods for assessing agreement between two methods of clinical measurement. Int J Nurs Studies. 2010;47:931–936. - PubMed
    1. Bowman BM, Miller SC. The proliferation and differentiation of the bone-lining cell in estrogen: induced osteogenesis. Bone. 1986;7:351–357. - PubMed

Publication types

LinkOut - more resources