. 2014 Jul 1;21(1):17-32.
doi: 10.1089/ars.2013.5539. Epub 2014 Mar 14.

Oxidative stress and inflammation modulate Rev-erbα signaling in the neonatal lung and affect circadian rhythmicity

Affiliations

Oxidative stress and inflammation modulate Rev-erbα signaling in the neonatal lung and affect circadian rhythmicity

Guang Yang et al. Antioxid Redox Signal. .

Abstract

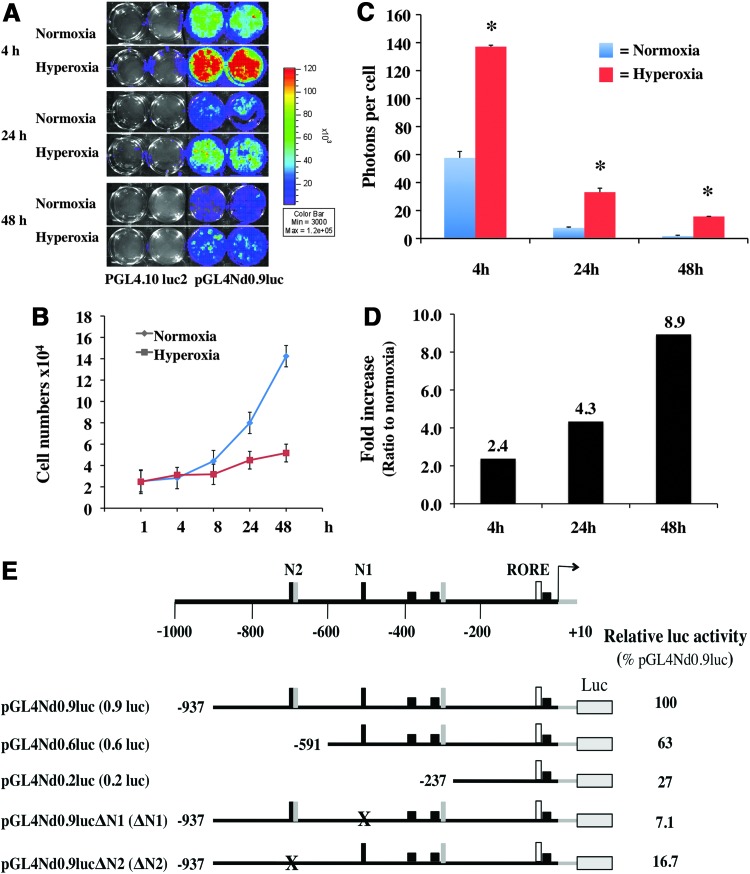
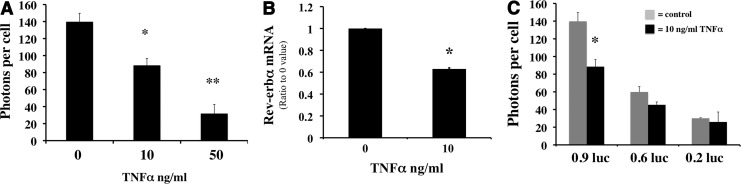
Aims: The response to oxidative stress and inflammation varies with diurnal rhythms. Nevertheless, it is not known whether circadian genes are regulated by these stimuli. We evaluated whether Rev-erbα, a key circadian gene, was regulated by oxidative stress and/or inflammation in vitro and in a mouse model.

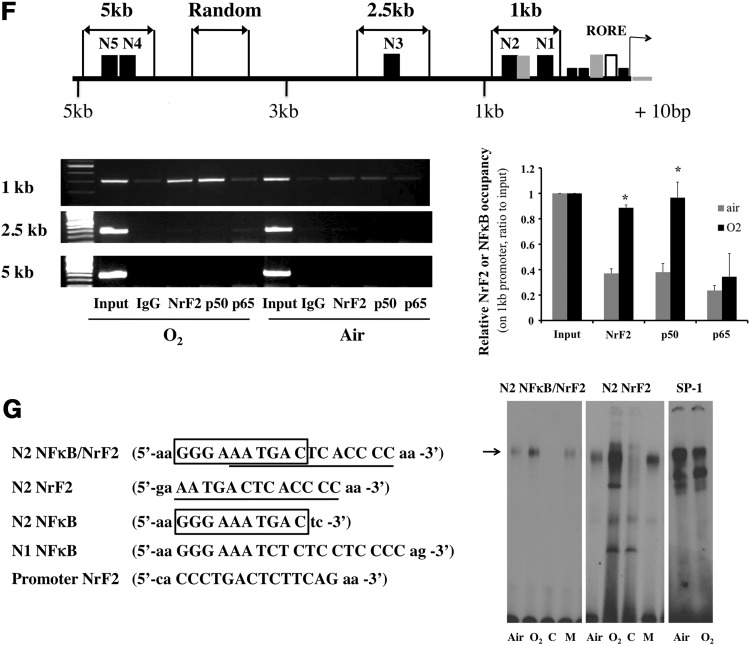
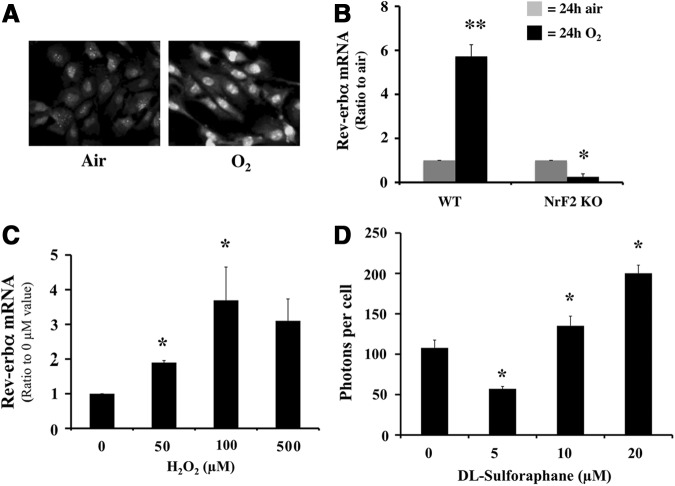
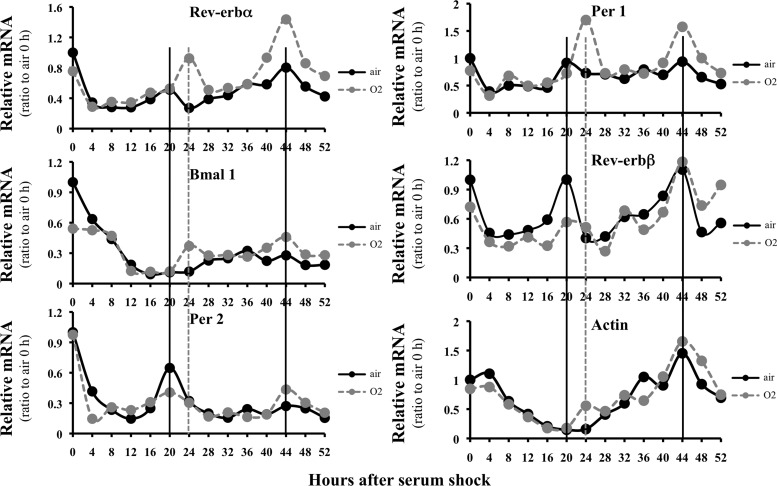
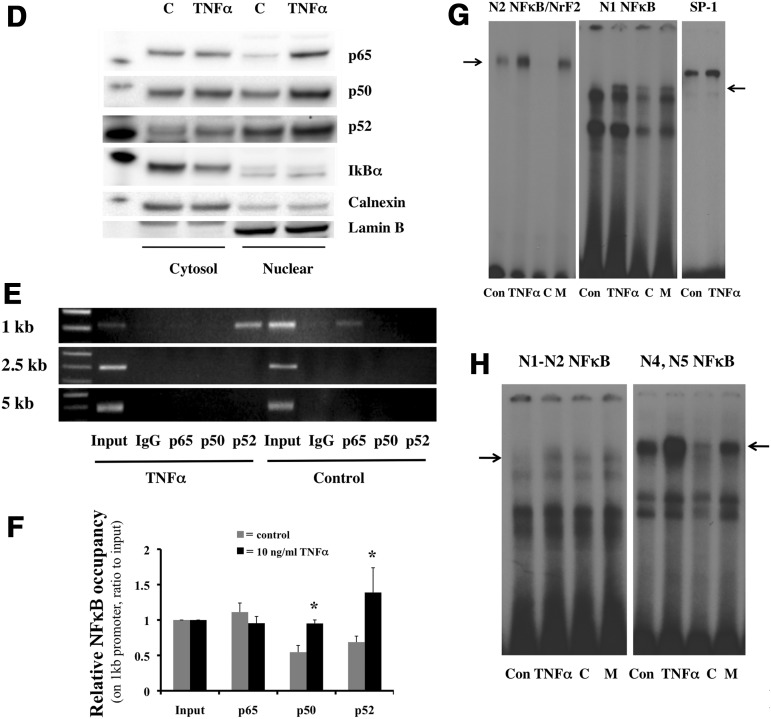
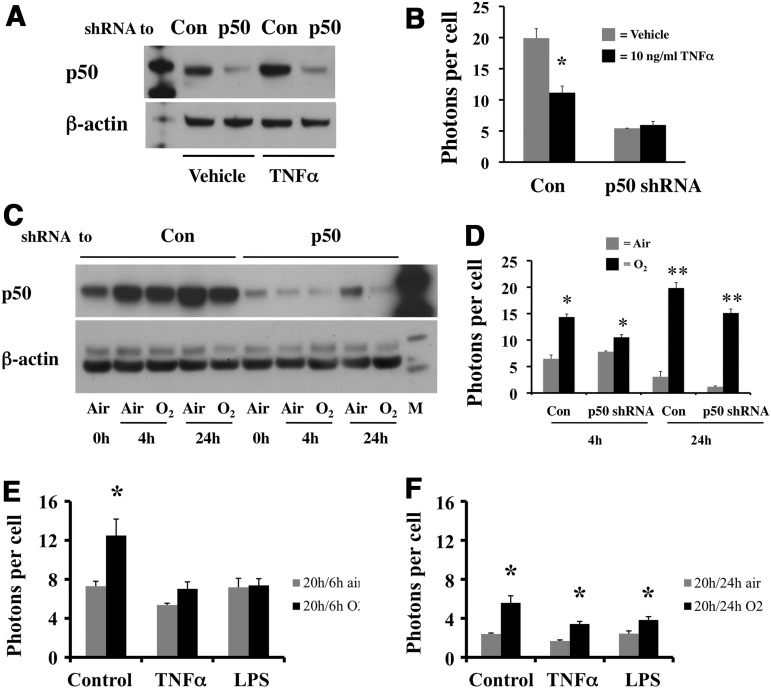
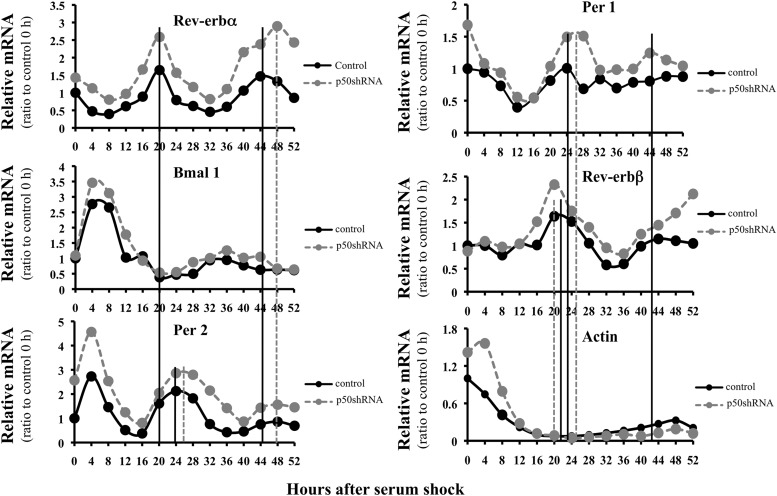
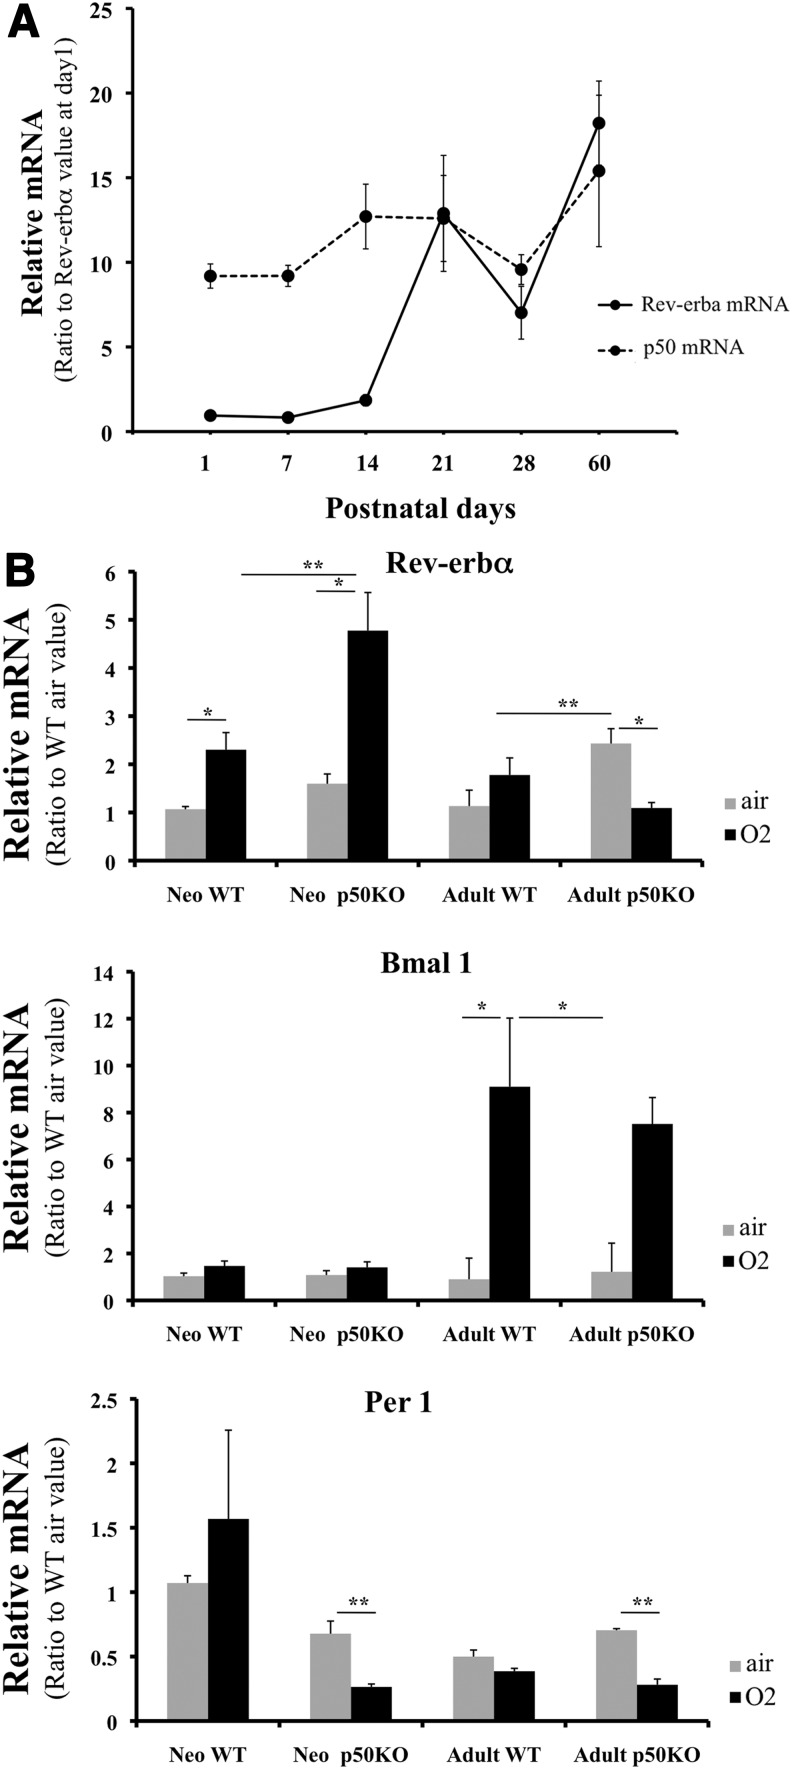
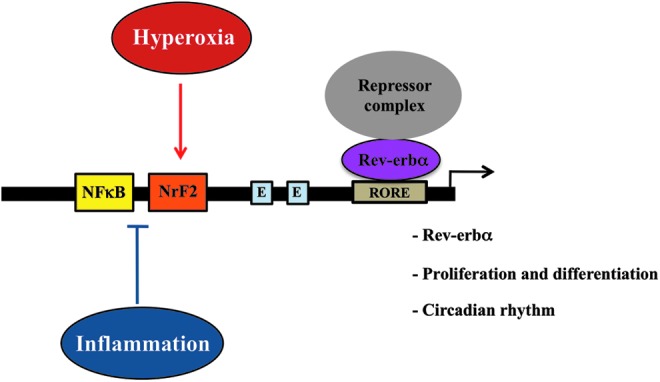
Results: A unique sequence consisting of overlapping AP-1 and nuclear factor kappa B (NFκB) consensus sequences was identified on the mouse Rev-erbα promoter. This sequence mediates Rev-erbα promoter activity and transcription in response to oxidative stress and inflammation. This region serves as an NrF2 platform both to receive oxidative stress signals and to activate Rev-erbα, as well as an NFκB-binding site to repress Rev-erbα with inflammatory stimuli. The amplitude of the rhythmicity of Rev-erbα was altered by pre-exposure to hyperoxia or disruption of NFκB in a cell culture model of circadian simulation. Oxidative stress overcame the inhibitory effect of NFκB binding on Rev-erbα transcription. This was confirmed in neonatal mice exposed to hyperoxia, where hyperoxia-induced lung Rev-erbα transcription was further increased with NFκB disruption. Interestingly, this effect was not observed in similarly exposed adult mice.

Innovation: These data provide novel mechanistic insights into how key circadian genes are regulated by oxidative stress and inflammation in the neonatal lung.

Conclusion: Rev-erbα transcription and circadian oscillation are susceptible to oxidative stress and inflammation in the neonate. Due to Rev-erbα's role in cellular metabolism, this could contribute to lung cellular function and injury from inflammation and oxidative stress.


Figures

<b>FIG. 1.</b>
FIG. 1.
Rev-erbα promoter activity and occupancy of NrF2 and NFκB in hyperoxia. Representative images of Rev-erbα luciferase reporter activity in live cells after exposure to hyperoxia or normoxia for 4–48 h (A). The color scale bar represents photon emission intensity. (B) Cell numbers for each image shown in (A). (C) Photon emission normalized to cell numbers. *p<0.001 versus normoxia. Values are the mean±SE of six measurements. (D) Fold increase in promoter activity in hyperoxia versus normoxia. (E) A graphic illustration of the Rev-erbα promoter constructs and activities. Upper panel: Graphic representation of the putative NFκB (N1 and N2 shown as black bars) and NrF2 (grey bars) binding sites on the mouse 0.9 kb Rev-erbα promoter. The arrow indicates the transcription initiation site. White bar: The RORE; Black boxes: E-boxes. Lower panel: Relative luciferase activity of 0.9 kb Rev-erbα promoter constructs. Luciferase activity in the linearly deleted constructs (0.6 and 0.2 kb luc) was normalized to transfection efficiency that was determined by renilla luciferase activity. Values represent the mean of three measurements. (F) Occupancy of NrF2 or NFκB protein on the Rev-erbα promoter regions N1 to N5. Upper panel: Relative localization of primer sets is shown. Lower left panel: A representative ChIP assay from three experiments shows the occupancy of NrF2 and NFκB subunit proteins, p65 and p50, before and after hyperoxic exposure. Lower right panel: Densitometric evaluation of the ChIP assay from the left. *p<0.05 versus air; n=3. Air: Twenty-four hours normoxic exposure; O2: Twenty-four hours hyperoxic exposure. (G) DNA binding of the NrF2 or NFκB. Left panel: Putative DNA sequences of the NrF2 and NFκB binding sites. Underlined text: Putative NrF2 sequences overlapping with the N2 NFκB sequence; Black boxes: Putative NFκB sequences on N2 overlapping with the NrF2 sequence. The overlapping sequences between the NrF2 and NFκB on the N2 site were further dissected as N2 NrF2 and N2 NFκB. N1 NFκB: Putative NFκB sequence on the N1 site. Promoter NrF2: A putative NrF2 sequence closer to the initiation site. Right panel: Representative of two EMSA assays using radiolabeled DNA sequences corresponding to the consensus sequences shown in the left panel. The SP-1 consensus sequence served as a loading control; Air: Twenty-four hours normoxia; O2: Twenty-four hours hyperoxia; C: Cold competition with 50×of unlabeled probe; M: Competition with 50×of unlabeled mutant DNA probe (Table 3). Arrow indicates the NrF2-binding signal. NFκB, nuclear factor kappa B; ChIP, chromatin immunoprecipitation; RORE, retinoid-related orphan receptor response element; EMSA, electrophoretic mobility gel shift assay. To see this illustration in color, the reader is referred to the web version of this article at www.liebertpub.com/ars
<b>FIG. 2.</b>
FIG. 2.
Effect of NrF2 on Rev-erbα promoter activity and transcription. (A) Representative immunohistochemical staining for NrF2 protein in Mlg cells after 4 h exposure to normoxia (air) and hyperoxia (O2). Image was obtained at 60×magnification. (B) Rev-erbα mRNA steady-state levels after 24 h hyperoxia in NrF2 null MEF cells. Values are the mean±SE of three measurements, *p<0.05 versus KO air; **p<0.01 versus WT air. (C) Steady-state Rev-erbα mRNA levels after incubation with 0–500 μmol H2O2 for 4 h. (D) Promoter activity of Rev-erbα after 12 h incubation with 0–20 μmol DL-Sulforaphane. In (C, D) values are the mean±SE of three measurements, *p<0.05 versus control. MEF, mouse embryonic fibroblast.
<b>FIG. 3.</b>
FIG. 3.
Effect of sublethal hyperoxic exposure on rythmicity of Rev-erbα and other circadian genes. Representative of circadian gene mRNA rhythmicity was shown in two consecutive cycles. Black solid line with circle: Pre-exposure to normoxia for 12 h. Grey dotted line with circle: Pre-exposure to hyperoxia for 12 h. Vertical lines indicate the time when the phase shift occurred or the amplitude was altered.
<b>FIG. 4.</b>
FIG. 4.
Rev-erbα transcription and occupancy of NFκB subunit proteins after incubation with TNFα. (A) Cells were incubated with 0–50 ng/ml TNFα for 12 h. Photon emission was normalized to cell numbers in each group. (B) Steady-state levels of Rev-erbα after incubation with TNFα for 12 h. (C) Photon emission after incubation with 10 ng/ml TNFα for 12 h in 0.9, 0.6, and 0.2 kb Rev-erbα constructs. Values are the mean±SE of three to five measurements; *p<0.05 versus controls; **p<0.001 versus controls. (D) A representative Western blot of NFκB subunit protein distributions between cytosol and nucleus after incubation with 10 ng/ml TNFα (TNFα) or control (C) for 12 h. The samples were pooled from three experiments. Lamin B and calnexin serve as loading controls for nuclear and cytoplasmic extracts, respectively. (E) ChIP assay from three experiments to evaluate the occupancy of NrF2 and NFκB subunit proteins, p65, p50, and p52, with TNFα incubation. (F) Densitometric evaluation of the ChIP assay from (E) *p<0.05 versus controls; n=3. (G, H) Representative radiographs from two EMSA assays using radiolabeled DNA sequences. N2 NFκB/NrF2: The overlapping sequence of NrF2 and NFκB on N2; N1 NFκB: The NFκB sequence on N1; SP-1: Consensus sequence for transcription factor SP-1 serves as a loading control; N1-N2 NFκB: The NFκB (p50/p50 specific) sequence found between N1 and N2; N4,N5 NFκB: The NFκB (p50/p50 specific) sequence on N4 or N5; Con: Control; TNFα: Cells incubated with 10 ng/ml TNFα for 12 h. C: Cold competition with 50×of unlabeled probe; M: Competition with 50×of unlabeled mutant DNA probe (Table 3). Arrows indicate the NFκB binding signal.
<b>FIG. 5.</b>
FIG. 5.
Effect of p50 knockdown on Rev-erbα promoter activity. Stably transfected Mlg cell lines with or without p50 shRNA were incubated with 10 ng/ml TNFα for 12 h or exposed to hyperoxia for 4 and 24 h. (A) Representative Western blot of p50 protein with or without TNFα incubation. (B) Photon emission of the 0.9 kb Rev-erbα luc promoter in p50 shRNA and control cell lines with or without TNFα incubation. Values are the mean±SE of five measurements; *p<0.05 versus vehicle. (C) Representative Western blot of p50 protein with or without hyperoxia exposure. (D) Photon emission of the 0.9 kb Rev-erbα luc promoter in p50 shRNA and control cell lines with or without hyperoxia exposure. Values are the mean±SE of three measurements. *p<0.05 versus air; **p<0.001 versus air. (E, F) Rev-erbα promoter activity in cells pre-incubated with TNFα (10 ng/ml) or LPS (0.1 μg/ml) before hyperoxia. Values are the mean±SE of three measurements. *p<0.05 versus air. LPS, lipopolysaccharides.
<b>FIG. 6.</b>
FIG. 6.
Effect of NFκB disruption on rythmicity of Rev-erbα and other circadian genes. Representative of circadian gene mRNA rhythmicity was shown in two consecutive cycles. Black solid line with circles: Control shRNA cells. Grey dotted line with circles: p50 shRNA cells. Vertical lines indicate the time when the phase shift occurred or the amplitude was altered.
<b>FIG. 7.</b>
FIG. 7.
Effect of NFκB disruption on expression of key circadian genes in lungs exposed to hyperoxia. (A) Correlation of p50 and Rev-erbα mRNA during postnatal lung development. The relative expression of p50 mRNA levels was normalized to the postnatal day 1 value and compared with Rev-erbα mRNA levels at similar time points. Values are the mean±SE of three mice in each group. (B) Relative lung mRNA levels of Rev-erbα, Bmal 1, and Per 1 in WT and p50KO neonatal (3 days old) and adult mice (60 days old) exposed to hyperoxia. Values are the mean±SE of six mice in the WT groups and three mice in the p50KO groups. *p<0.05; **p<0.01.
<b>FIG. 8.</b>
FIG. 8.
Proposed mechanism by which oxidative stress and inflammation alter Rev-erbα signaling. Hyperoxia activates Rev-erbα gene expression via putative NrF2 sites on the promoter, whereas inflammation inhibits gene expression via putative NFκB sites that overcome the self-regulation by a repressor complex. To see this illustration in color, the reader is referred to the web version of this article at www.liebertpub.com/ars

Similar articles

Cited by

References

    1. Adelmant G, Begue A, Stehelin D, and Laudet V. A functional Rev-erb alpha responsive element located in the human Rev-erb alpha promoter mediates a repressing activity. Proc Natl Acad Sci U S A 93: 3553–3558, 1996 - PMC - PubMed
    1. Angelov D, Lenouvel F, Hans F, Muller CW, Bouvet P, Bednar J, Moudrianakis EN, Cadet J, and Dimitrov S. The histone octamer is invisible when NF-kappaB binds to the nucleosome. J Biol Chem 279: 42374–42382, 2004 - PubMed
    1. Auten RL, Mason SN, Auten KM, and Brahmajothi M. Hyperoxia impairs postnatal alveolar epithelial development via NADPH oxidase in newborn mice. Am J Physiol Lung Cell Mol Physiol 297: L134–L142, 2009 - PMC - PubMed
    1. Balsalobre A, Damiola F, and Schibler U. A serum shock induces circadian gene expression in mammalian tissue culture cells. Cell 93: 929–937, 1998 - PubMed
    1. Barker GF, Manzo ND, Cotich KL, Shone RK, and Waxman AB. DNA damage induced by hyperoxia: quantitation and correlation with lung injury. Am J Respir Cell Mol Biol 35: 277–288, 2006 - PMC - PubMed

Publication types

MeSH terms

LinkOut - more resources