

Geographical differentiation in floral traits across the distribution range of the Patagonian oil-secreting Calceolaria polyrhiza: do pollinators matter?
- PMID: 24252281
- PMCID: PMC3890392
- DOI: 10.1093/aob/mct239
Geographical differentiation in floral traits across the distribution range of the Patagonian oil-secreting Calceolaria polyrhiza: do pollinators matter?
Abstract
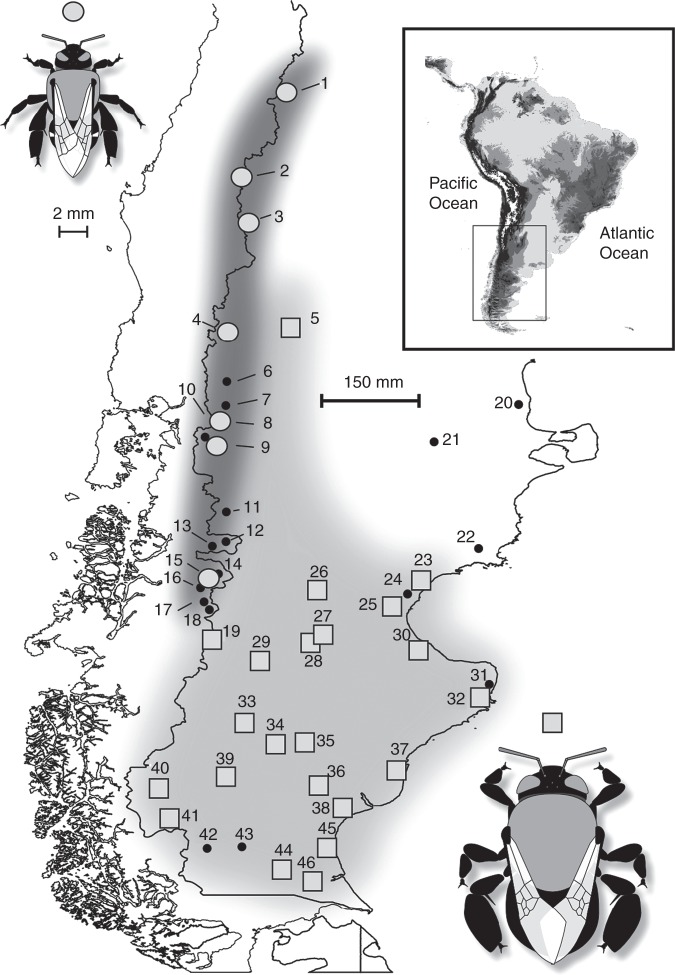
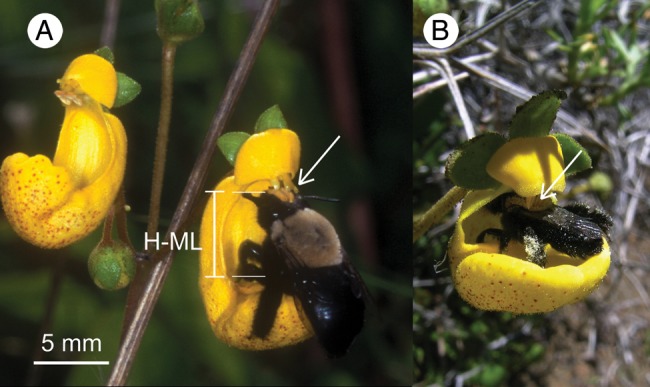
Background and aims: The underlying evolutionary processes of pollinator-driven floral diversification are still poorly understood. According to the Grant-Stebbins model speciation begins with adaptive local differentiation in the response to spatial heterogeneity in pollinators. Although this crucial process links the micro- and macroevolution of floral adaptation, it has received little attention. In this study geographical phenotypic variation was investigated in Patagonian Calceolaria polyrhiza and its pollinators, two oil-collecting bee species that differ in body size and geographical distribution.
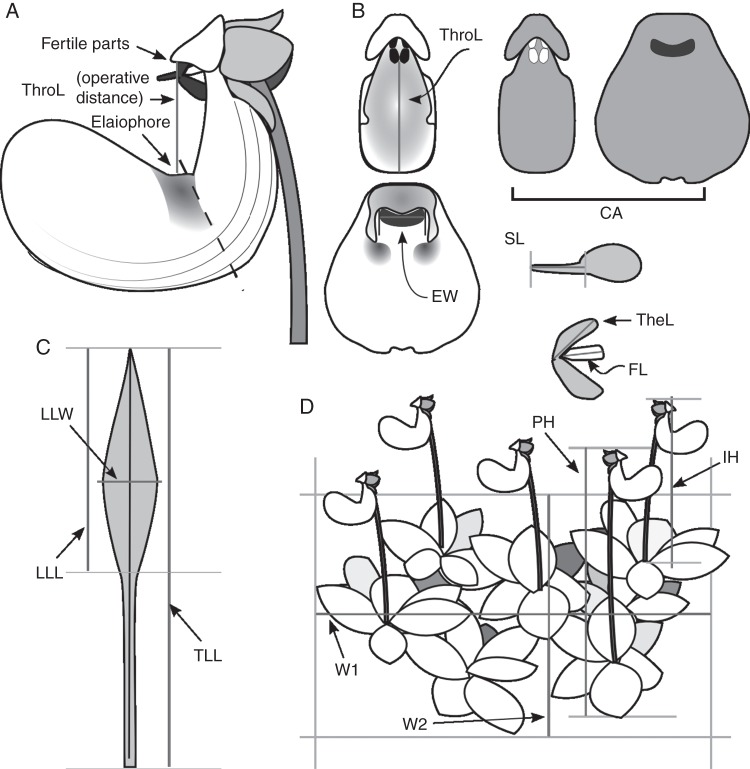
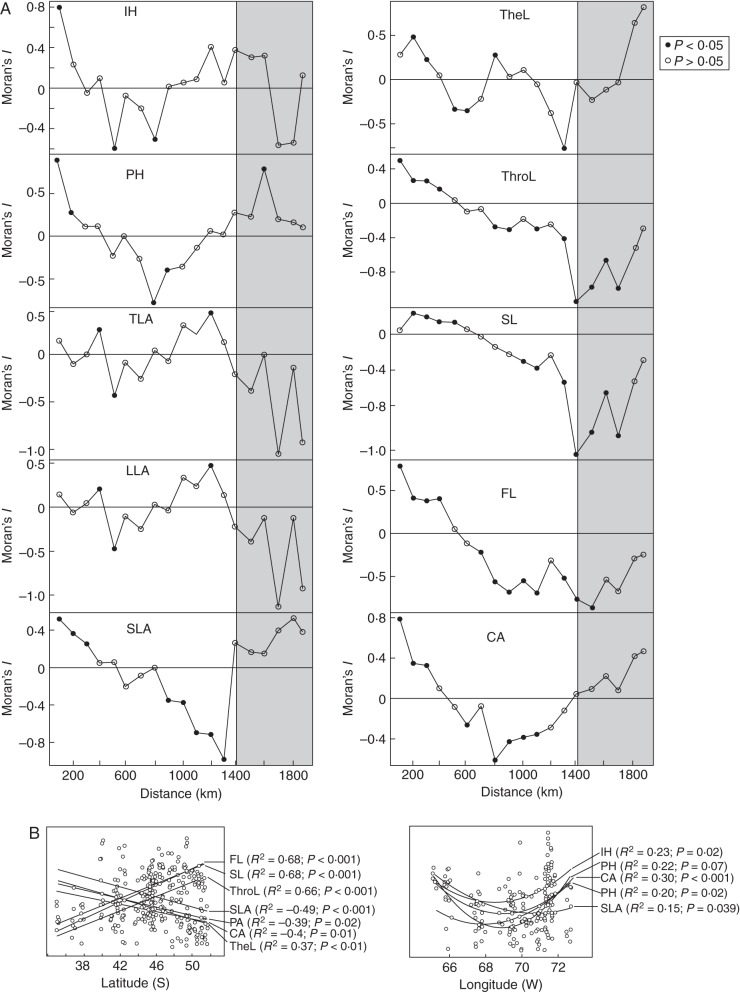
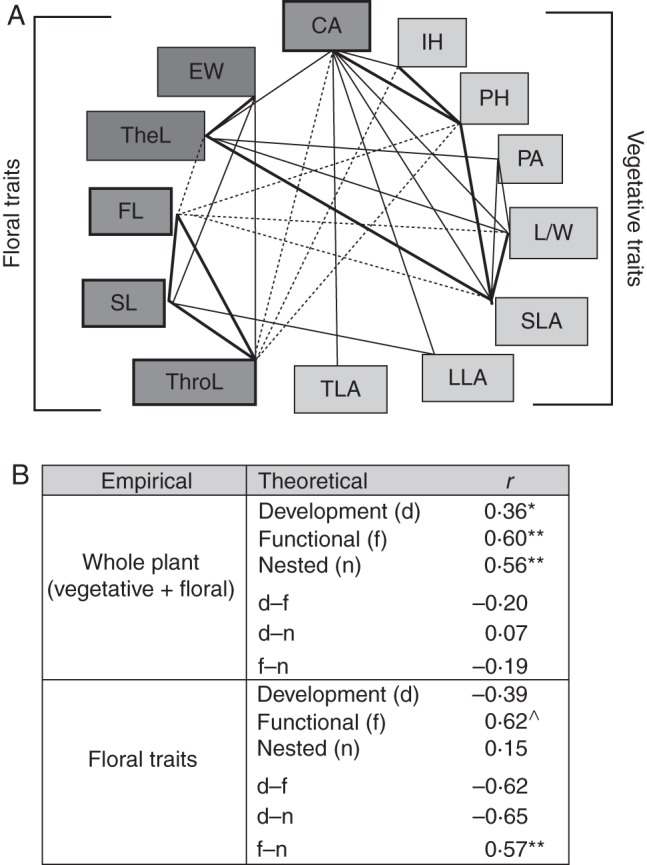
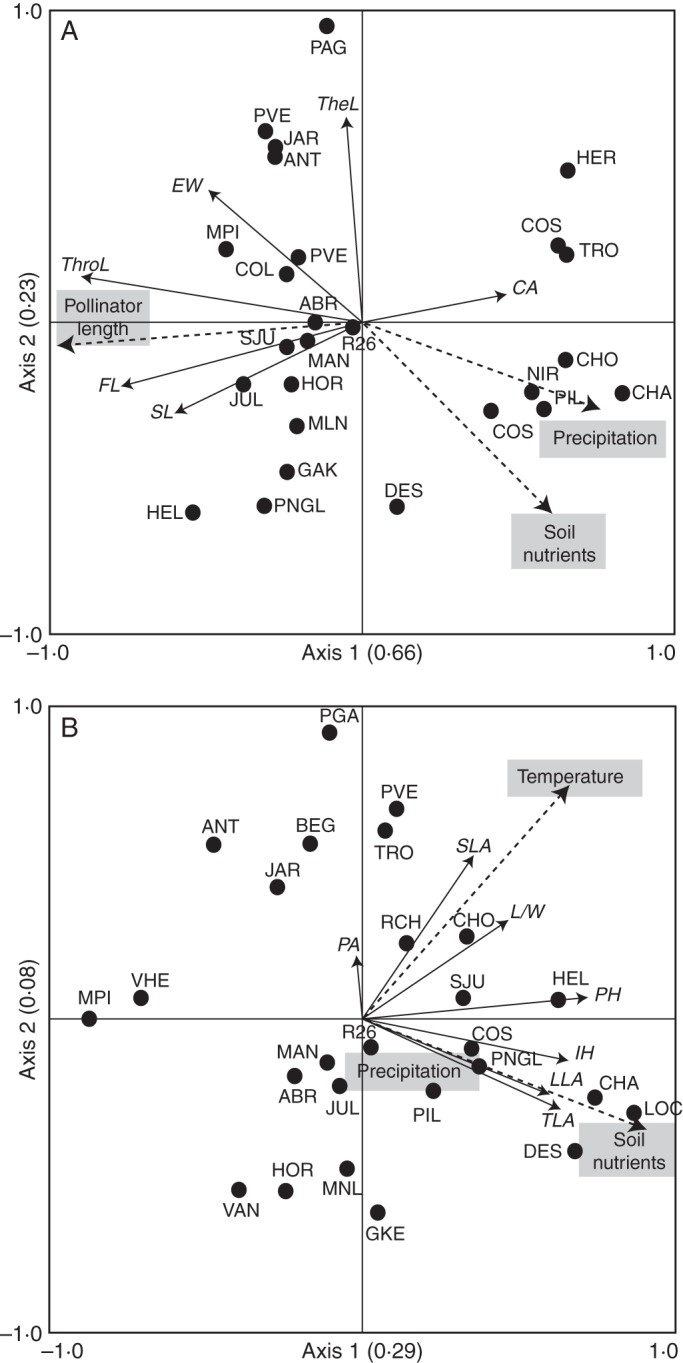
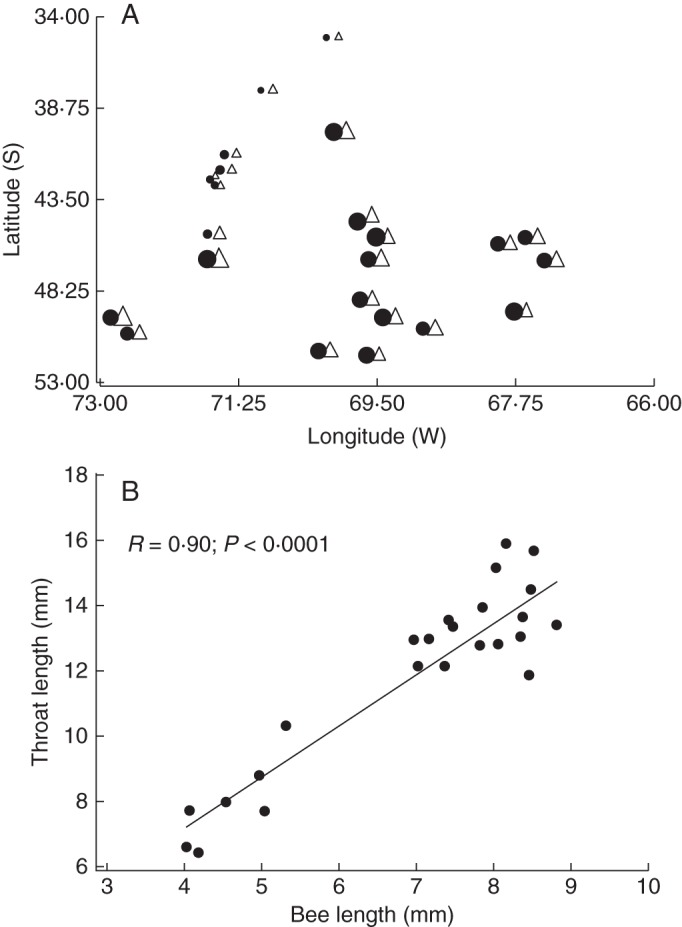
Methods: Patterns of phenotypic variation were examined together with their relationships with pollinators and abiotic factors. Six floral and seven vegetative traits were measured in 45 populations distributed across the entire species range. Climatic and edaphic parameters were determined for 25 selected sites, 2-16 bees per site of the most frequent pollinator species were captured, and a critical flower-bee mechanical fitting trait involved in effective pollination was measured. Geographical patterns of phenotypic and environmental variation were examined using uni- and multivariate analyses. Decoupled geographical variation between corolla area and floral traits related to the mechanical fit of pollinators was explored using a Mantel test.
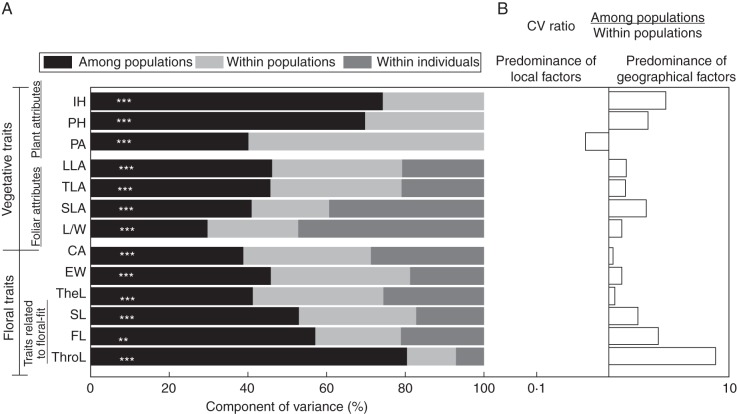
Key results: The body length of pollinators and the floral traits related to mechanical fit were strongly correlated with each other. Geographical variation of the mechanical-fit-related traits was decoupled from variation in corolla size; the latter had a geographical pattern consistent with that of the vegetative traits and was mainly affected by climatic gradients.
Conclusions: The results are consistent with pollinators playing a key role in shaping floral phenotype at a geographical scale and promoting the differentiation of two floral ecotypes. The relationship between the critical floral-fit-related trait and bee length remained significant even in models that included various environmental variables and an allometric predictor (corolla area). The abiotic environment also has an important role, mainly affecting floral size. Decoupled geographical variation between floral mechanical-fit-related traits and floral size would represent a strategy to maintain plant-pollinator phenotypic matching in this environmentally heterogeneous area.
Keywords: Abiotic environmental gradients; Calceolaria; Patagonia; bee morphology; floral ecotypes; geographical range; local adaptation; oil-collecting bees; oil-offering flowers; phenotypic covariance; specialized pollination; speciation; vegetative morphology.
Figures
Similar articles
-
Pollinator-mediated selection on Krameria oil flowers: a flower-pollinator fit adaptation to an atypical oil-collecting behaviour?Ann Bot. 2024 Oct 30;134(4):603-614. doi: 10.1093/aob/mcae102. Ann Bot. 2024. PMID: 38916514 Free PMC article.
-
A pollinator shift explains floral divergence in an orchid species complex in South Africa.Ann Bot. 2014 Jan;113(2):277-88. doi: 10.1093/aob/mct216. Epub 2013 Oct 9. Ann Bot. 2014. PMID: 24107684 Free PMC article.
-
Pollination syndromes in a specialised plant-pollinator interaction: does floral morphology predict pollinators in Calceolaria?Plant Biol (Stuttg). 2015 Mar;17(2):551-7. doi: 10.1111/plb.12225. Epub 2014 Aug 12. Plant Biol (Stuttg). 2015. PMID: 25115902
-
The effect of global change on the expression and evolution of floral traits.Ann Bot. 2025 Feb 8;135(1-2):9-24. doi: 10.1093/aob/mcae057. Ann Bot. 2025. PMID: 38606950 Free PMC article. Review.
-
A quantitative review of pollination syndromes: do floral traits predict effective pollinators?Ecol Lett. 2014 Mar;17(3):388-400. doi: 10.1111/ele.12224. Epub 2014 Jan 7. Ecol Lett. 2014. PMID: 24393294
Cited by
-
Matching floral and pollinator traits through guild convergence and pollinator ecotype formation.Ann Bot. 2014 Jan;113(2):373-84. doi: 10.1093/aob/mct203. Epub 2013 Sep 19. Ann Bot. 2014. PMID: 24052557 Free PMC article.
-
Pollination ecotypes and the origin of plant species.Proc Biol Sci. 2025 Jan;292(2039):20242787. doi: 10.1098/rspb.2024.2787. Epub 2025 Jan 29. Proc Biol Sci. 2025. PMID: 39876736 Free PMC article. Review.
-
Twigs of dove tree in high-latitude region tend to increase biomass accumulation in vegetative organs but decrease it in reproductive organs.Front Plant Sci. 2023 Jan 13;13:1088955. doi: 10.3389/fpls.2022.1088955. eCollection 2022. Front Plant Sci. 2023. PMID: 36714716 Free PMC article.
-
Compensating for the corolla? Pollen exposure is not associated with pollen-collecting hair length.Ann Bot. 2024 Dec 31;134(6):1027-1036. doi: 10.1093/aob/mcae139. Ann Bot. 2024. PMID: 39230168
-
Spatiotemporal variation in the pollination systems of a supergeneralist plant: is Angelica sylvestris (Apiaceae) locally adapted to its most effective pollinators?Ann Bot. 2019 Jan 23;123(2):415-428. doi: 10.1093/aob/mcy140. Ann Bot. 2019. PMID: 30059963 Free PMC article.
References
-
- Anderson B, Johnson SD. The geographical mosaic of coevolution in a plant–pollinator mutualism. Evolution. 2008;62:220–225. - PubMed
-
- Anderson B, Johnson SD. Geographical covariation and local convergence of flower depth in a guild of fly-pollinated plants. New Phytologist. 2009;182:533–40. - PubMed
-
- Armbruster WS. Estimating and testing adaptive surfaces: the morphology and pollination of Dalechampia blossoms. American Naturalist. 1990;135:14–31.
-
- Armbruster WS. Multilevel analysis of morphometric data from natural plant populations: insights into ontogenetic, genetic, and selective correlations in Dalechampia scandens. Evolution. 1991;45:1229–1244. - PubMed
-
- Armbruster WS, Di Stilio VS, Tuxill JD, Flores TC, Velásquez Runk JL. Covariance and decoupling of floral and vegetative traits in nine Neotropical plants: a re-evaluation of Berg's correlation-pleiades concept. American Journal of Botany. 1999;86:39–55. - PubMed
Publication types
MeSH terms
Substances
LinkOut - more resources
Full Text Sources
Other Literature Sources
