. 2013 Aug 2:1:43.
doi: 10.1186/2051-5960-1-43.

Myelin alters the inflammatory phenotype of macrophages by activating PPARs

Affiliations

Myelin alters the inflammatory phenotype of macrophages by activating PPARs

Jeroen F J Bogie et al. Acta Neuropathol Commun. .

Abstract

Background: Foamy macrophages, containing myelin degradation products, are abundantly found in active multiple sclerosis (MS) lesions. Recent studies have described an altered phenotype of macrophages after myelin internalization. However, mechanisms by which myelin affects the phenotype of macrophages and how this phenotype influences lesion progression remain unclear.

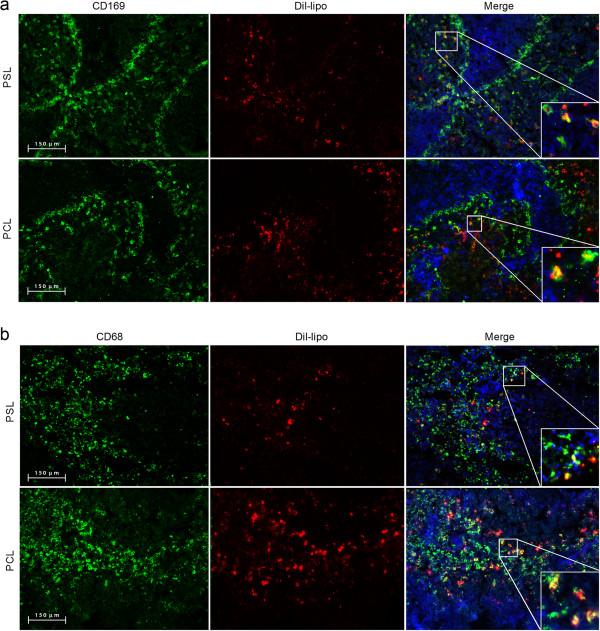
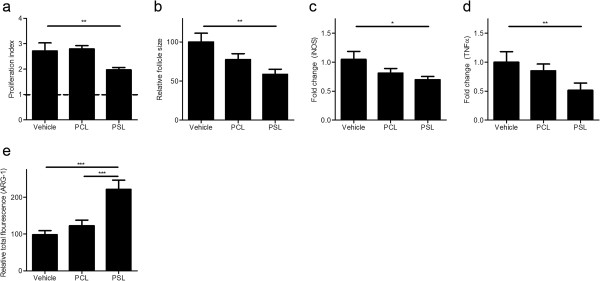
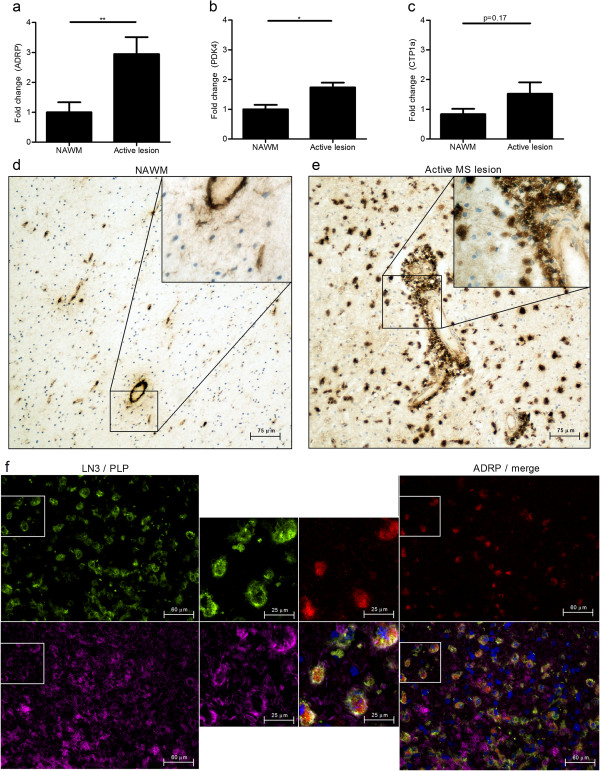
Results: We demonstrate that myelin as well as phosphatidylserine (PS), a phospholipid found in myelin, reduce nitric oxide production by macrophages through activation of peroxisome proliferator-activated receptor β/δ (PPARβ/δ). Furthermore, uptake of PS by macrophages, after intravenous injection of PS-containing liposomes (PSLs), suppresses the production of inflammatory mediators and ameliorates experimental autoimmune encephalomyelitis (EAE), an animal model of MS. The protective effect of PSLs in EAE animals is associated with a reduced immune cell infiltration into the central nervous system and decreased splenic cognate antigen specific proliferation. Interestingly, PPARβ/δ is activated in foamy macrophages in active MS lesions, indicating that myelin also activates PPARβ/δ in macrophages in the human brain.

Conclusion: Our data show that myelin modulates the phenotype of macrophages by PPAR activation, which may subsequently dampen MS lesion progression. Moreover, our results suggest that myelin-derived PS mediates PPARβ/δ activation in macrophages after myelin uptake. The immunoregulatory impact of naturally-occurring myelin lipids may hold promise for future MS therapeutics.


Figures

Figure 1
Figure 1
Myelin and PSLs modulates the macrophages phenotype by PPARβ/δ activation. (a-c) Relative NO and IL-6 concentration in supernatants of LPS stimulated control, myelin- or PSL-treated macrophages. Prior to administration of myelin or PSLs, cells were treated with antagonists for PPARα (GW6471), PPARβ/δ (GSK0660) or PPARγ (GW9662). The relative NO and IL-6 production is defined as the production of NO in experimental cultures divided by values in stimulated control cultures. Data represent the mean ± SEM of five independent experiments. (−): control cultures in which no antagonists were added.
Figure 2
Figure 2
Systemically administered liposomes home primarily to splenic marginal zone and red pulp macrophages. (a,b) Healthy rats were injected with 5 mg/kg DiI-labeled PCLs and PSLs. Splenic cryosections were stained with CD169 (a, marginal metallophilic and marginal zone macrophages) and CD68 (b, red pulp macrophages). One representative experiment is shown (20× magnification).
Figure 3
Figure 3
Intravenously injected PSLs reduce CNS infiltration of immune cells and ameliorate EAE. (a) MOG-immunized animals were treated daily with PBS (n=8; black), 5 mg/kg PCLs (n=8; dark grey) or 5 mg/kg PSLs (n=8; light grey) starting from day 5. Neurological score and weight were assessed daily. Data represent the mean ± SEM. *P < 0.05 (vehicle vs PSL), +P < 0.05 (PCL vs. PSL). (b) Spinal cord tissue was isolated 30 dpi and stained with CD3 (20× magnification) and CD68 (4× magnification). One representative image is shown. (c,d) Quantification of T cell and macrophage infiltration in spinal cord tissue 30 dpi. Nine cryosections, covering the complete length of the spinal cord, were stained with CD68 (c) and CD3 (d). A 4× magnification was used to determine the amount of immune cell infiltration. Data represent the mean ± SEM of 4 animals.
Figure 4
Figure 4
PSLs have a therapeutic effect on EAE. MOG-immunized animals were treated daily with PBS (n=6; black) or 5 mg/kg PSLs (n=6; light grey) starting at disease onset. Neurological score and weight was assessed daily. Data represent the mean ± SEM.
Figure 5
Figure 5
PSLs affect splenic cognate antigen specific proliferation and expression of TNFα, iNOS and ARG-1. (a) Cognate antigen specific proliferation (10 dpi) of splenic cultures was assessed by culturing splenic cells from vehicle, PCL and PSL treated animals with MOG. Proliferation was assessed by [3H]thymidine incorporation. Non-stimulated cultures were used as control (dotted line). Data represent the mean ± SEM of four experiments. (b) The size of the splenic white pulp was determined using ImageJ software. Three cryosections per animal were stained with CD200R, a marker for myeloid cells, after which the surface area surrounded by the marginal metallophilic macrophages was determined. Five images (4× magnification) per section were taken to calculate the mean white pulp size. Data represent the mean ± SEM of four animals. (c,d) Comparison of fold changes between vehicle, PCL and PSL-treated spleens 10 dpi. Relative quantification of iNOS (c) and TNFα (d) was accomplished by using the comparative Ct method. Data were normalized to the most stable reference genes, determined by Genorm (Pgk1 and Rpl13a). Data represent the mean ± SEM of 4 experiments. (e) Spleen cryosections were stained with ARG-1 after which the total corrected fluorescence was determined using ImageJ software, as described previously [65]. Three cryosections were stained and 6 images (10× magnification) were taken per section. Data represent the mean ± SEM of four animals.
Figure 6
Figure 6
PPARs are activated in myelin-phagocytosing macrophages during active MS. (a-c) Comparison of fold changes between non-demented controls (n=5) and active MS lesions (n=5). Relative quantification of ADRP (a), PDK4 (b) and CTP1a (c) was accomplished by using the comparative Ct method. Data were normalized to the most stable reference genes, determined by Genorm (YHWAZ and Rpl13a). (d,e) Normal-appearing white matter (d) and an active MS lesion (e) stained for ADRP. One representative image is shown (20× magnification). (f) Active MS lesion stained with HLA-DR (green top; left corner), ADRP (red; top right corner), PLP (magenta; bottom left corner) and DAPI (blue, bottom right corner). One representative image is shown (40× magnification).

Similar articles

Cited by

References

    1. Trapp BD, Peterson J, Ransohoff RM, Rudick R, Mork S, Bo L. Axonal transection in the lesions of multiple sclerosis. N Engl JMed. 1998;1:278–285. doi: 10.1056/NEJM199801293380502. - DOI - PubMed
    1. Barnett MH, Henderson AP, Prineas JW. The macrophage in MS: just a scavenger after all? Pathology and pathogenesis of the acute MS lesion. Mult Scler. 2006;1:121–132. doi: 10.1191/135248506ms1304rr. - DOI - PubMed
    1. Hendriks JJ, Teunissen CE, de Vries HE, Dijkstra CD. Macrophages and neurodegeneration. Brain Res Brain Res Rev. 2005;1:185–195. doi: 10.1016/j.brainresrev.2004.12.008. - DOI - PubMed
    1. Miller E, Mrowicka M, Zolynski K, Kedziora J. [Oxidative stress in multiple sclerosis] PolMerkur Lekarski. 2009;1:499–502. - PubMed
    1. Sun X, Wang X, Chen T, Li T, Cao K, Lu A, Chen Y, Sun D, Luo J, Fan J. et al.Myelin activates FAK/Akt/NF-kappaB pathways and provokes CR3-dependent inflammatory response in murine system. PLoS One. 2010;1:e9380. doi: 10.1371/journal.pone.0009380. - DOI - PMC - PubMed

Publication types

MeSH terms