. 2013 Jun 19:1:26.
doi: 10.1186/2051-5960-1-26.

Friedreich ataxia: metal dysmetabolism in dorsal root ganglia

Affiliations

Friedreich ataxia: metal dysmetabolism in dorsal root ganglia

Arnulf H Koeppen et al. Acta Neuropathol Commun. .

Abstract

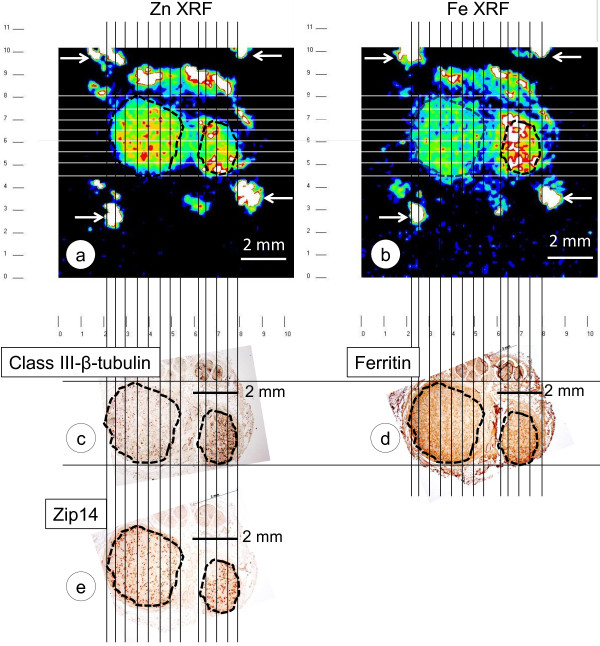
Background: Friedreich ataxia (FA) causes distinctive lesions of dorsal root ganglia (DRG), including neuronal atrophy, satellite cell hyperplasia, and absorption of dying nerve cells into residual nodules. Two mechanisms may be involved: hypoplasia of DRG neurons from birth and superimposed iron (Fe)- and zinc (Zn)-mediated oxidative injury. This report presents a systematic analysis of DRG in 7 FA patients and 13 normal controls by X-ray fluorescence (XRF) of polyethylene glycol-embedded DRG; double-label confocal immunofluorescence microscopy of Zn- and Fe-related proteins; and immunohistochemistry of frataxin and the mitochondrial marker, ATP synthase F1 complex V β-polypeptide (ATP5B).

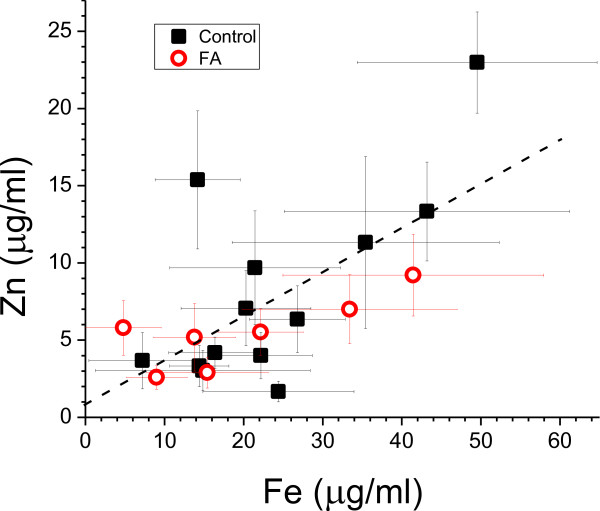
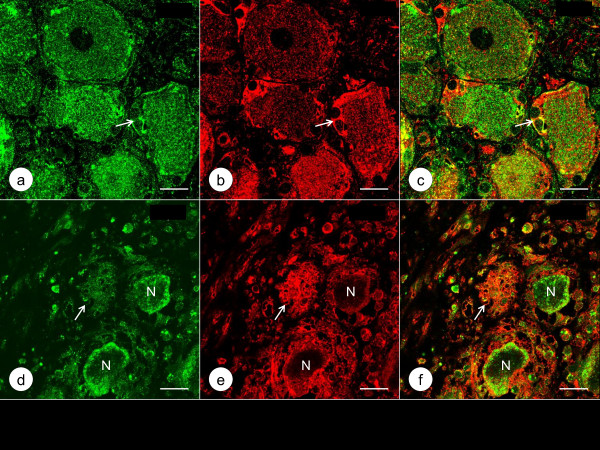
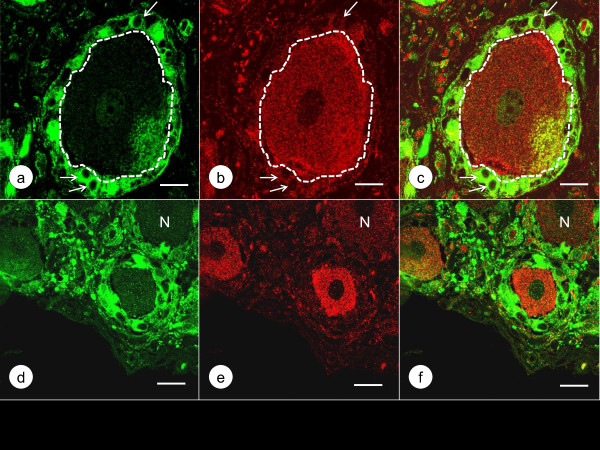
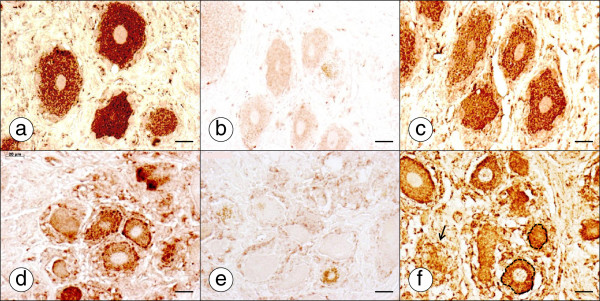
Results: XRF revealed normal total Zn- and Fe-levels in the neural tissue of DRG in FA (mean ± standard deviation): Zn=5.46±2.29 μg/ml, Fe=19.99±13.26 μg/ml in FA; Zn=8.16±6.19 μg/ml, Fe=23.85±12.23 μg/ml in controls. Despite these unchanged total metal concentrations, Zn- and Fe-related proteins displayed major shifts in their cellular localization. The Zn transporter Zip14 that is normally expressed in DRG neurons and satellite cells became more prominent in hyperplastic satellite cells and residual nodules. Metallothionein 3 (MT3) stains confirmed reduction of neuronal size in FA, but MT3 expression remained low in hyperplastic satellite cells. In contrast, MT1/2 immunofluorescence was prominent in proliferating satellite cells. Neuronal ferritin immunofluorescence declined but remained strong in hyperplastic satellite cells and residual nodules. Satellite cells in FA showed a larger number of mitochondria expressing ATB5B. Frataxin immunohistochemistry in FA confirmed small neuronal sizes, irregular distribution of reaction product beneath the plasma membrane, and enhanced expression in hyperplastic satellite cells.

Conclusions: The pool of total cellular Zn in normal DRG equals 124.8 μM, which is much higher than needed for the proper function of Zn ion-dependent proteins. It is likely that any disturbance of Zn buffering by Zip14 and MT3 causes mitochondrial damage and cell death. In contrast to Zn, sequestration of Fe in hyperplastic satellite cells may represent a protective mechanism. The changes in the cellular localization of Zn- and Fe-handling proteins suggest metal transfer from degenerating DRG neurons to activated satellite cells and connect neuronal metal dysmetabolism with the pathogenesis of the DRG lesion in FA.


Figures

Figure 1
Figure 1
Alignment of Zn and Fe XRF maps of a DRG in FA and matching paraffin sections. (a), Zn XRF; (b), Fe XRF; (c) class-III-β-tubulin immunohistochemistry; (d), ferritin immunohistochemistry; (e), Zip14 immunohistochemistry. Low-power photographs of the stained sections were adjusted for size by reference to the mm scale on the XRF maps and rotated for optimal orientation. The illustrated DRG consisted of two portions of neural tissue that were identified by class-III-β-tubulin (c) and Zip14 reaction products (e). The region-of-interest containing the bulk of DRG neurons was outlined by interrupted lines. The outline was then transferred to the Zn and Fe XRF maps and the ferritin-stained section. Maps were segmented by vertical and horizontal lines placed at 0.5 mm intervals over the images to generate a grid. Within the maps, each square represented 0.25 mm2. At the edges, the squares were smaller. A single Zn or Fe signal was recorded as counts/10 sec from each square, and results of all signals were averaged for each metal. After subtracting background XRF, averaged counts were converted to μg Zn or Fe per ml PEG 1450. In the illustrated case of FA, Zn=4.8 μg/ml and Fe=33.4 μg/ml. The arrows in the two XRF maps indicate the location of Ti wires that are visible on the Zn and Fe XRF maps, respectively, due to minor contamination by these metals. Note strong Zn and Fe XRF arising from the capsule surrounding the neural portions of the DRG. These regions were effectively excluded from quantitative analysis by the illustrated alignment. Bars, 2 mm.
Figure 2
Figure 2
Correlation of Zn and Fe levels in DRG of 13 normal controls and 7 cases of FA. Zn levels increase with Fe levels in controls (closed back squares) and FA patients (open red circles). Each symbol represents the mean Zn and Fe level in a single subject, with horizontal and vertical lines representing the S.D. of Zn and Fe determinations, respectively, within that subject. Mean and S.D. are calculated from non-overlapping 0.25 mm2 areas in controls and FA, covering the entire neural tissue region of DRG (see methods). Regression result for all subjects is shown by the dashed line: Zn = 0.81 + 0.285 × Fe; slope p<0.001; R2=0.45. Multiple linear regression showed no significant difference between controls and FA subjects in either slope (p=0.16) or intercept (p=0.41).
Figure 3
Figure 3
Double-label immunofluorescence of class-III-β-tubulin and Zip14 in a normal control DRG and a DRG of an FA patient. (a)-(c) normal control; (d)-(f) FA; (a) and (d) class-III-β-tubulin (Alexa488, green); (b) and (e) Zip14 (Cy3, red); (c) and (f) merged images. The normal DRG (a) shows large neurons that yield intense class-III-β-tubulin reaction product in perikaryon and dendrites. Zip14 staining (b) is heterogeneous, with less reaction product in the nerve cell marked by “N”. Anti-Zip14 also visualizes satellite cells (b). In FA, a small class-III-β-tubulin-reactive neuron (d) continues to display Zip14 reaction product but is surrounded by multiple layers of Zip14-reactive satellite cells (e). Bars, 20 μm.
Figure 4
Figure 4
Double-label immunofluorescence of Zip14 and ferritin in a normal control DRG and a DRG of an FA patient. (a)-(c) normal control; (d)-(f) FA; (a) and (d) Zip14 (Alexa488, green); (b) and (e) ferritin (Cy3, red); (c) and (f) merged images. Zip14 (a) and ferritin reaction products (b) show co-localization in the cytoplasm of several large and small neurons and in perineuronal satellite cells (arrows). Zip14 and ferritin fluorescence in neurons is heterogeneous. In the FA case (d-f), neuronal Zip14 (d) and ferritin (e) have shifted to a location beneath the plasma membrane while the central portion of the nerve cells (N) is devoid of reaction product. Zip14 fluorescence is present in satellite cells and a residual nodule (d, arrow). Ferritin fluorescence in multi-layer satellite cells and a residual nodule (e, arrow) is very prominent. Bars, 20 μm.
Figure 5
Figure 5
Double-label immunofluorescence of MT1/2 and MT3 in a normal control DRG and a DRG of an FA patient. (a)-(c) normal control; (d)-(f) FA; (a) and (d) MT1/2 (Alexa488, green); (b) and (e) MT3 (Cy3, red); (c) and (f) merged images. MT1/2 immunoreactivity is restricted to normal (a) and hyperplastic satellite cells in FA (d). MT3 immunofluorescence is localized in the cytoplasm of a normal large DRG neuron (b) and in satellite cells, in which it co-localizes with MT1/2 (a-c, arrows). In FA (e), one of three small DRG neurons shows very little MT3 immunofluorescence (N) while two others remain strongly fluorescent. The thickened layers of satellite cells around the 3 neurons show relatively low MT3 fluorescence (e). Bars, 20 μm.
Figure 6
Figure 6
Double-label immunofluorescence of S100α and ATP5B in a normal control DRG and a DRG of an FA patient. (a)-(c) normal control; (d)-(f) FA; (a) and (d) S100α (Alexa488, green); (b) and (e) ATP5B (Cy3, red); (c) and (f) merged images. S100α immunofluorescence is a robust marker of normal satellite cells (a) and hyperplastic satellite cells in FA (d). In the normal DRG, ATP5B fluorescence is prominent in neuronal cytoplasm (b), and only sparse reaction product is present in the tissue between neurons. In contrast, satellite cells in FA (e) show a great abundance of granular ATP5B immunofluorescence. The arrows in (d)-(f) indicate a residual nodule. Bars, 20 μm.
Figure 7
Figure 7
Frataxin and ATP5B immunohistochemistry of a normal control DRG and a DRG of an FA patient. (a)-(c) normal control; (d)-(f) FA; (a) and (d) frataxin; (b) and (e) anti-frataxin antibody pre-absorbed by human recombinant frataxin; (c) and (f) ATP5B. In the normal DRG, granular frataxin reaction product fills the perikarya of all neurons (a). Reaction product in satellite cells is sparse. ATP5B immunohistochemistry yields a similar result (c). In FA (d-f), frataxin reaction product in small neurons is concentrated under the neuronal plasma membrane, and hyperplastic satellite cells display more frataxin-reactive granules than normal (d). In FA, ATP5B reaction product shows a distribution in neurons, hyperplastic satellite cells, and a residual nodule that resembles frataxin (f, arrow). Two neurons are outlined by interrupted lines. Bars, 20 μm.

Similar articles

Cited by

References

    1. Koeppen AH, Mazurkiewicz JE. Friedreich ataxia: Neuropathology revised. J Neuropathol Exp Neurol. 2013;1:78–90. doi: 10.1097/NEN.0b013e31827e5762. - DOI - PMC - PubMed
    1. Koeppen AH, Morral JA, Davis AN, Qian J, Petrocine SV, Knutson MD, Gibson WM, Cusack MJ, Li D. The dorsal root ganglion in Friedreich’s ataxia. Acta Neuropathol. 2009;1:763–776. doi: 10.1007/s00401-009-0589-x. - DOI - PubMed
    1. Campuzano V, Montermini L, Moltò MD, Pianese L, Cossée M, Cavalcanti F, Monros E, Rodius F, Duclos F, Monticelli A, Zara F, Cañizares J, Koutnikova H, Bidichandani SI, Gellera C, Brice A, Trouillas P, De Michele G, Filla A, De Frutos R, Palau F, Patel PI, Di Donato S, Mandel JL, Cocozza S, Koenig M, Pandolfo M. Friedreich’s ataxia: autosomal recessive disease caused by an intronic GAA triplet repeat expansion. Science. 1996;1:1423–1427. doi: 10.1126/science.271.5254.1423. - DOI - PubMed
    1. Rötig A, De Lonlay P, Chretien D, Foury F, Koenig M, Sidi D, Munnich A, Rustin P. Aconitase and mitochondrial iron-sulphur protein deficiency in Friedreich ataxia. Nat Genet. 1997;1:215–217. doi: 10.1038/ng1097-215. - DOI - PubMed
    1. Armstrong JS, Khdour O, Hecht SM. Does oxidative stress contribute to the pathology of Friedreich’s ataxia? A radical question. FASEB J. 2010;1:2152–2163. doi: 10.1096/fj.09-143222. - DOI - PubMed

Publication types

MeSH terms