. 2014 Mar:81:88-98.
doi: 10.1016/j.steroids.2013.10.018. Epub 2013 Nov 16.

Estrogen response element-independent signaling partially restores post-ovariectomy body weight gain but is not sufficient for 17β-estradiol's control of energy homeostasis

Affiliations

Estrogen response element-independent signaling partially restores post-ovariectomy body weight gain but is not sufficient for 17β-estradiol's control of energy homeostasis

Kyle J Mamounis et al. Steroids. 2014 Mar.

Abstract

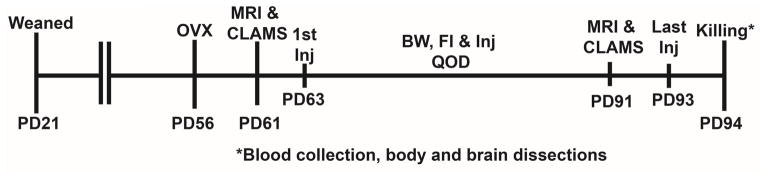
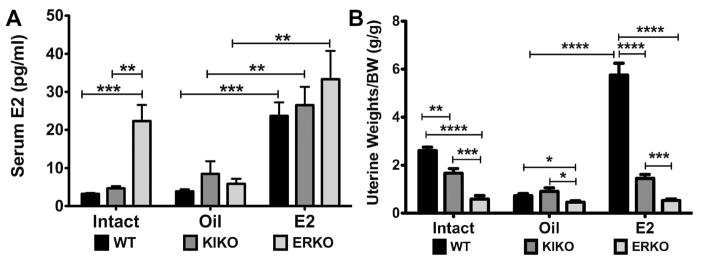
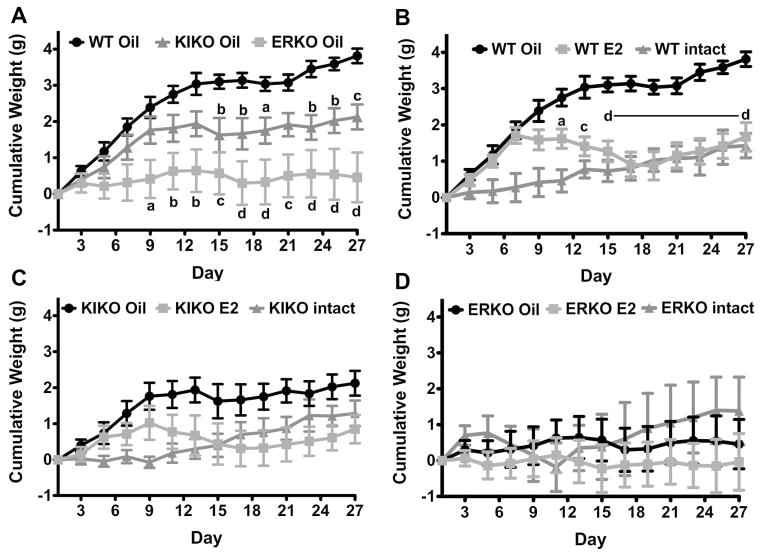
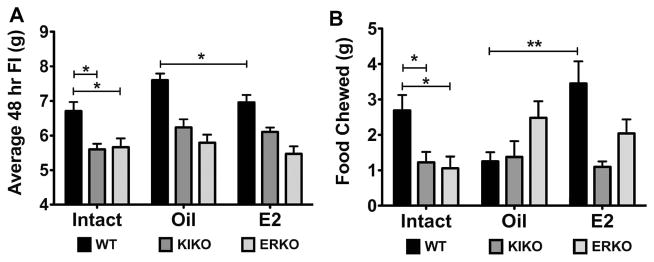
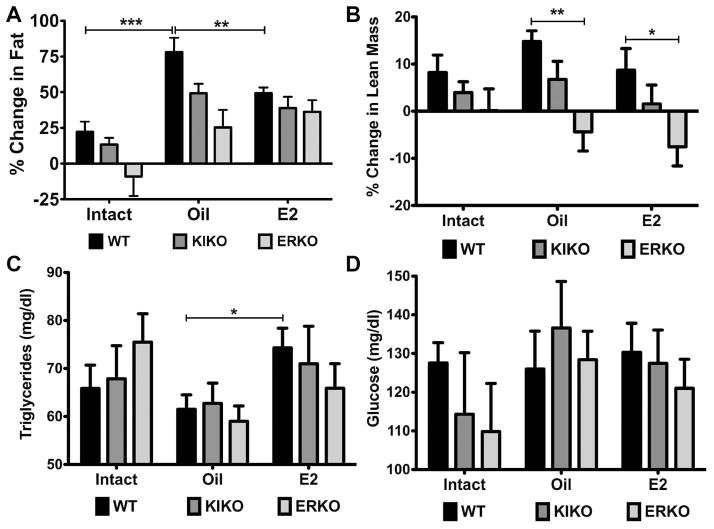
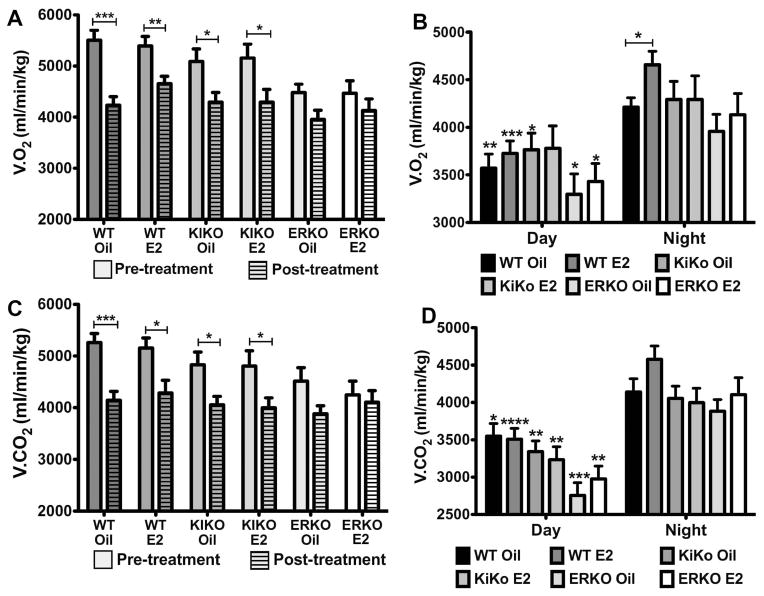
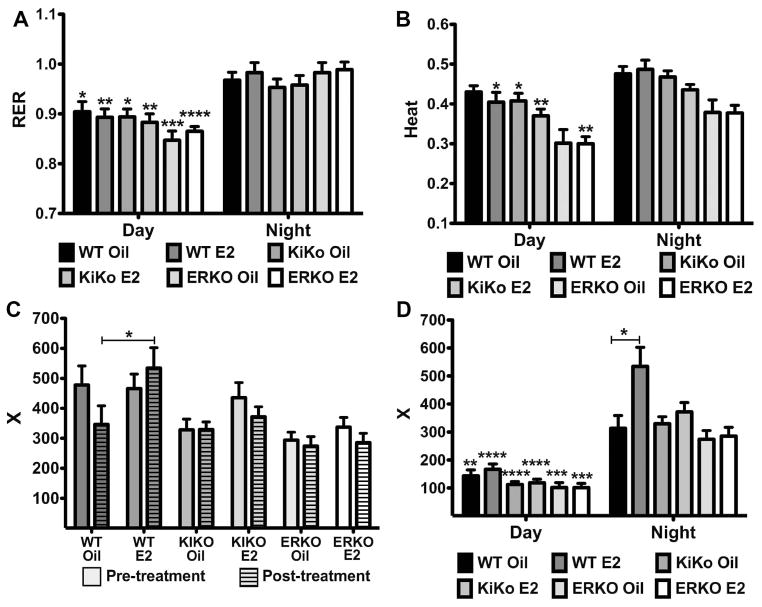
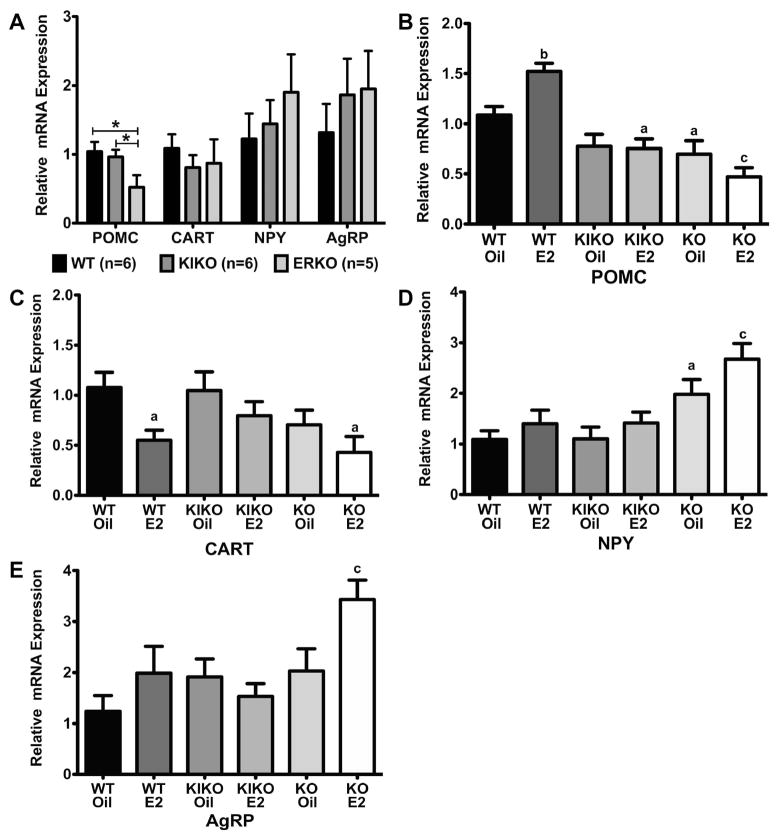
The steroid 17β-estradiol (E2) modulates energy homeostasis by reducing feeding behavior and increasing energy expenditure primarily through estrogen receptor α (ERα)-mediated mechanisms. Intact ERαKO female mice develop obesity as adults exhibiting decreased energy expenditure and increased fat deposition. However, intact transgenic female mice expressing a DNA-binding-deficient ERα (KIKO) are not obese and have similar energy expenditure, activity and fat deposition as to wild type (WT) females, suggesting that non-estrogen response element (ERE)-mediated signaling is important in E2 regulation of energy homeostasis. Initial reports did not examine the effects of ovariectomy on energy homeostasis or E2's attenuation of post-ovariectomy body weight gain. Therefore, we sought to determine if low physiological doses of E2 (250 ng QOD) known to suppress post-ovariectomy body weight gain in WT females would suppress body weight gain in ovariectomized KIKO females. We observed that the post-ovariectomy increase in body weight was significantly greater in WT females than in KIKO females. Furthermore, E2 did not significantly attenuate the body weight gain in KIKO females as it did in WT females. E2 replacement suppressed food intake and fat accumulation while increasing nighttime oxygen consumption and activity only in WT females. E2 replacement also increased arcuate POMC gene expression in WT females only. These data suggest that in the intact female, ERE-independent mechanisms are sufficient to maintain normal energy homeostasis and to partially restore the normal response to ovariectomy. However, they are not sufficient for E2's suppression of post-ovariectomy body weight gain and its effects on metabolism and activity.

Keywords: 17β-Estradiol; ERα; Energy homeostasis; Ovariectomy.


Figures

Figure 1
Figure 1
Experimental protocol for ovariectomized and intact females.
Figure 2
Figure 2. Serum 17β-estradiol levels and uterine weights from intact and ovariectomized females
A. Serum E2 (pg/ml) were measured using a Mouse Calbiotech ELISA in WT (black bars), KIKO (dark gray bars) and ERKO (light gray bars) in intact females as well as oil-treated and E2-treated ovx females. Each intact genotype group had 7 females and each ovx group had 8 females. B. Uterine weights normalized to body weight (g/g) in the same animals. Data was analyzed by a one-way ANOVA with Bonferroni-Dunn multiple comparison tests across and within genotypes (* p<0.05; ** p<0.01; *** p<0.001; **** p<0.0001).
Figure 3
Figure 3. Post-ovariectomy body weight gain and the attenuation by E2
A. Bi-daily (QOD) cumulative body weight gain in oil-treated, ovariectomized WT (black circles), KIKO (dark gray triangles) and ERKO (light gray squares). Each ovariectomized group had 8 females. Data was analyzed by a two-way ANOVA (genotype: p<0.01, df=2, F=9.84) with Bonferroni-Dunn multiple comparison tests (a = p<0.05; b = p<0.01; c = p<0.001; d = p<0.0001, compared to WT). B–D. Cumulative body weight gain in oil-treated, ovariectomized (black circles); E2-treated, ovariectomized (gray squares); and intact (dark gray triangles) females (B=WT, C=KIKO; D=ERKO). Ovariectomized groups had 8 females and the intact groups had 7 females each. Data was analyzed by a two-way ANOVA (WT: p<0.001, df=1, F=20.68; KIKO & ERKO: not significant (ns)) with Bonferroni-Dunn multiple comparison tests (a = p<0.05; b = p<0.01; c = p<0.001; d = p<0.0001, oil vs. E2 comparisons only).
Figure 4
Figure 4. Average 48 hr food intake and food chewed for both intact and ovariectomized females
A. Average 48 hr food intake (g) over the course of the 4 weeks measured for each animal from each group. WT (black bars), KIKO (dark gray bars) and ERKO (light gray bars) in intact and oil-treated and E2-treated ovariectomized females. Data was analyzed by a two-way ANOVA (genotype: p<0.0001, df=2, F=39.1; steroid: p<0.01; df=2, F=5.25) with Bonferroni-Dunn multiple comparison tests across and within genotypes (* p<0.05; ** p<0.01). B. The average 48 hr amount of food chewed but not consumed by each animal within each group. Data was analyzed by a one-way ANOVA (Intact: p<0.01, df=2; F=6.28; E2: p<0.01, df=2, F=6.37; oil: ns) with Bonferroni-Dunn multiple comparison tests across and within genotypes (* p<0.05; ** p<0.01).
Figure 5
Figure 5. E2 replacement suppressed body fat accumulation and increases blood triglycerides levels
A. Average percent change in body fat/body weight during the 4 weeks averaged for each group. WT (black bars), KIKO (dark gray bars) and ERKO (light gray bars) in intact and oil-treated and E2-treated ovariectomized females. Data was analyzed by a one-way ANOVA (WT: p<0.001, df=2, F=13.6; KIKO: p<0.01, df=2, F=7.26; ERKO: p<0.05, df=2, F=4.26) with Bonferroni-Dunn multiple comparison tests across and within genotypes (** p<0.01, *** p<0.001). B. The average percent change in lean mass/body weight averaged for each group. Data was analyzed by a one-way ANOVA (E2: p<0.05, df=2; F=3.65; oil: p<0.01, df=2, F=7.65; oil: ns) with Bonferroni-Dunn multiple comparison tests across and within genotypes (* p<0.05; ** p<0.01). C. Blood triglycerides levels (mg/dl) averaged for each group. Data was analyzed by a one-way ANOVA with Bonferroni-Dunn multiple comparison tests across and within genotypes (* p<0.05). D. Blood glucose levels (mg/dl) averaged for each group. Data was analyzed by a one-way ANOVA with Bonferroni-Dunn multiple comparison tests across and within genotypes.
Figure 6
Figure 6. Oxygen consumption (V.O2) and carbon dioxide production (V.CO2) decreases after ovariectomy, which is only attenuated by E2 in WT females
A. Average nightime V.O2 (ml/min/kg) for each group before and after treatment. Unhatched bar = pre-treatment and hatched bars = post-treatment. Data was analyzed by a two-way ANOVA (genotype X steroid: p<0.001, df=5, F=4.09; pre-post: p<0.0001, df=1, F=36.97) with Bonferroni-Dunn multiple comparison tests across and within genotypes. B. Average daytime and nighttime V.O2 (ml/min/kg) for each group post-treatment. Data was analyzed by a two-way ANOVA (day-night: p<0.0001, df=1; F=36.74; genotype X steroid: ns (p=0.06)) with Bonferroni-Dunn multiple comparison tests across and within genotypes (* p<0.05, ** p<0.01, *** p<0.001, compared to nighttime group). C. Average nighttime V.CO2 (ml/min/kg) for each group before and after treatment. Unhatched bar = pre-treatment and hatched bars = post-treatment. Data was analyzed by a two-way ANOVA (genotype X steroid: ns; pre-post: p<0.0001, df=1, F=30.85) with Bonferroni-Dunn multiple comparison tests across and within genotypes. D. Average daytime and nighttime V.CO2 (ml/min/kg) for each group post-treatment. Data was analyzed by a two-way ANOVA (day-night: p<0.0001, df=1; F=77.71; genotype X steroid: p<0.01, df=5, F=3.63) with Bonferroni-Dunn multiple comparison tests across and within genotypes (* p<0.05, ** p<0.01, *** p<0.001, **** p<0.0001, compared to nighttime group).
Figure 7
Figure 7. Respiratory Exchange Ratio (RER), heat production and activity
A. Average daytime and nighttime RER for each group post-treatment. Data was analyzed by a two-way ANOVA (day-night: p<0.0001, df=1; F=79.23; genotype X steroid: ns) with Bonferroni-Dunn multiple comparison tests across and within genotypes (* p<0.05, ** p<0.01, *** p<0.001, **** p<0.0001, compared to nighttime group). B. Average daytime and nighttime heat production for each group post-treatment. Data was analyzed by a two-way ANOVA (day-night: p<0.0001, df=1; F=31.89; genotype X steroid: p<0.0001, df=5; F=11.97) with Bonferroni-Dunn multiple comparison tests across and within genotypes (* p<0.05, ** p<0.01, compared to nighttime group). C. Average nighttime X-plane activity (counts) for each group before and after treatment. Unhatched bar = pre-treatment and hatched bars = post-treatment. Data was analyzed by a two-way ANOVA (genotype X steroid: p<0.0001, df=5, F=5.84; pre-post: ns) with Bonferroni-Dunn multiple comparison tests across and within genotypes (* p<0.05). D. Average daytime and nighttime X-plane activity for each group post-treatment. Data was analyzed by a two-way ANOVA (day-night: p<0.0001, df=1; F=140.2; genotype X steroid: p<0.0001, df=5, F=6.69) with Bonferroni-Dunn multiple comparison tests across and within genotypes (* p<0.05, ** p<0.01, *** p<0.001, **** p<0.0001, compared to nighttime group).
Figure 8
Figure 8. Genotype and steroid treatment affect relative expression of Arcuate neuropeptide genes
A. Average relative mRNA expression for POMC, CART, NPY and AgRP neuropeptides in the intact females. Data was analyzed by a one-way ANOVA (POMC: p<0.05, df=2; F=3.85) with Bonferroni-Dunn multiple comparison tests across and within genotypes (* p<0.05). B–E. Average relative mRNA expression in oil-treated and E2-treated, ovariectomized females for each neuropeptide. Data was normalized to WT-oil samples and analyzed by a one-way ANOVA (POMC: p<0.0001, df=5, F=14.7; CART: p<0.05, df=5, F=3.22; NPY: p<0.001, df=5, F=5.8; AgRP: p<0.05, df=5, F=3.44) with Bonferroni-Dunn multiple comparison tests across and within genotypes (a = p<0.05, b = p<0.01, c = p<0.001, d = p<0.0001).

Similar articles

Cited by

References

    1. Santollo J, Torregrossa A-M, Eckel LA. Estradiol acts in the medial preoptic area, arcuate nucleus, and dorsal raphe nucleus to reduce food intake in ovariectomized rats. Horm Behav. 2011;60:86–93. - PMC - PubMed
    1. Asarian L, Geary N. Estradiol enhances cholecystokinin-dependent lipid-induced satiation and activates estrogen receptor-α-expressing cells in the nucleus tractus solitarius of ovariectomized rats. Endocrinology. 2007;148:5656–5666. - PubMed
    1. Thammacharoen S, Lutz TA, Geary N, Asarian L. Hindbrain administration of estradiol inhibits feeding and activates estrogen receptor-α-expressing cells in the nucleus tractus solitarius of ovariectomized rats. Endocrinology. 2008;149:1609–1617. - PMC - PubMed
    1. Musatov S, Chen W, Pfaff DW, Mobbs CV, Yang X-J, Clegg DJ, et al. Silencing of estrogen receptor α in the ventromedial nucleus of hypothalamus leads to metabolic syndrome. Proc Natl Acad Sci USA. 2007;104:2501–2506. - PMC - PubMed
    1. Asarian L, Geary N. Cyclic estradiol treatment normalizes body weight and restores physiological patterns of spontaneous feeding and sexual receptivity in ovariectomized rats. Horm Behav. 2002;42:461–471. - PubMed

Publication types