. 2013 Nov 19;15(1):104.
doi: 10.1186/1532-429X-15-104.

ECG-based gating in ultra high field cardiovascular magnetic resonance using an independent component analysis approach

Affiliations

ECG-based gating in ultra high field cardiovascular magnetic resonance using an independent component analysis approach

Johannes W Krug et al. J Cardiovasc Magn Reson. .

Abstract

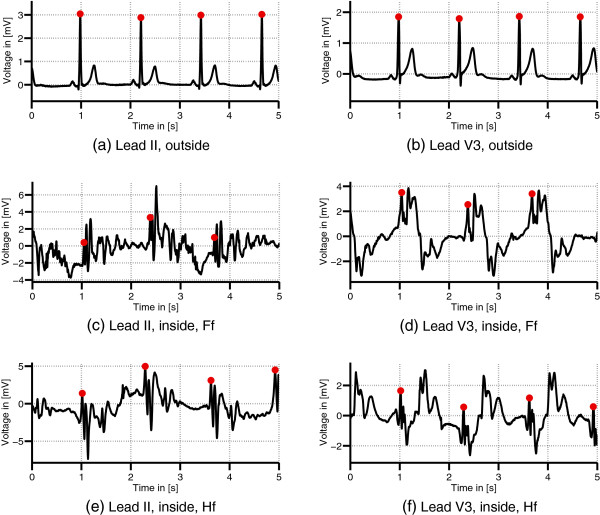
Background: In Cardiovascular Magnetic Resonance (CMR), the synchronization of image acquisition with heart motion is performed in clinical practice by processing the electrocardiogram (ECG). The ECG-based synchronization is well established for MR scanners with magnetic fields up to 3 T. However, this technique is prone to errors in ultra high field environments, e.g. in 7 T MR scanners as used in research applications. The high magnetic fields cause severe magnetohydrodynamic (MHD) effects which disturb the ECG signal. Image synchronization is thus less reliable and yields artefacts in CMR images.

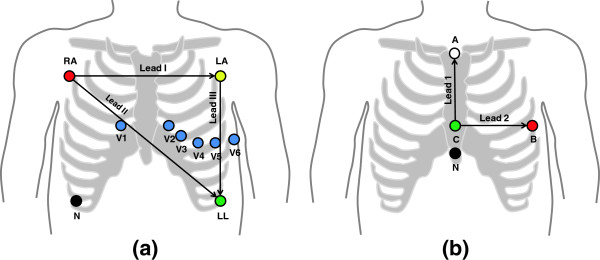
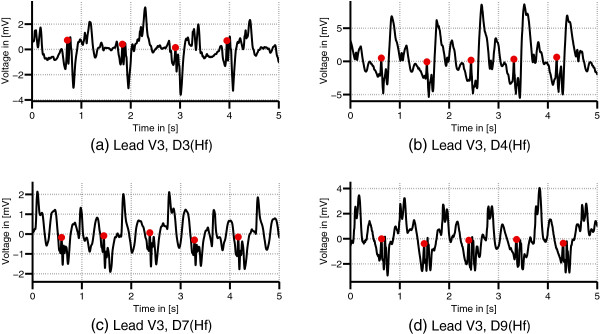
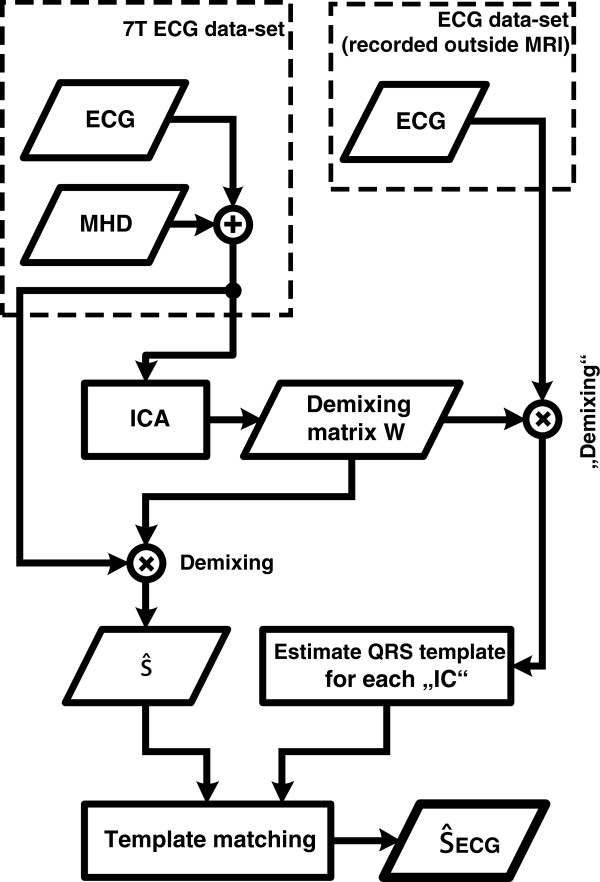
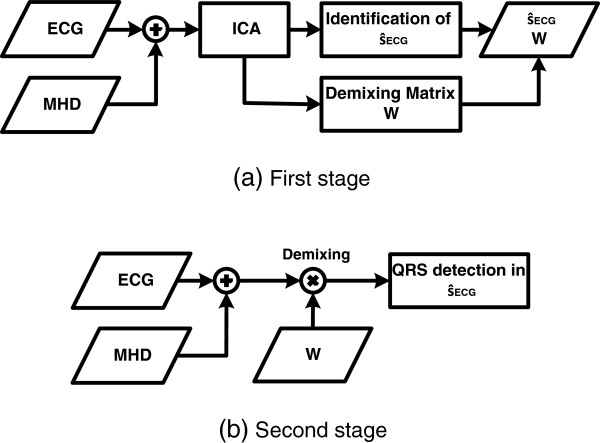
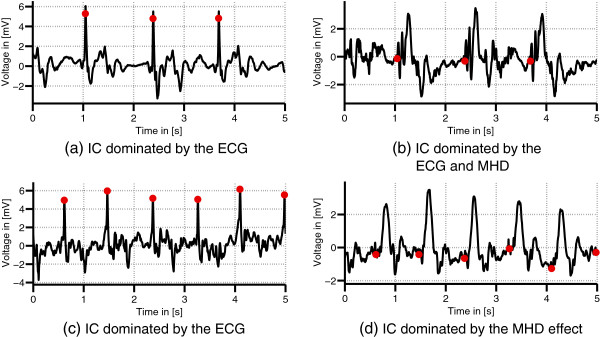
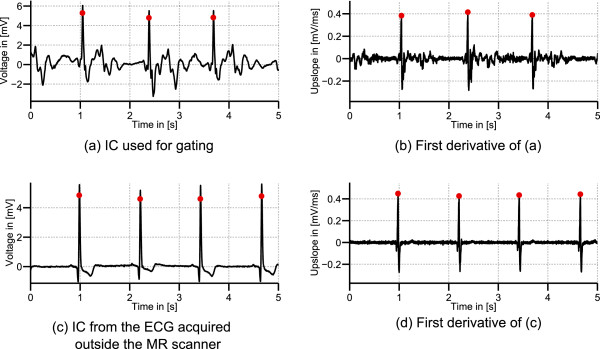
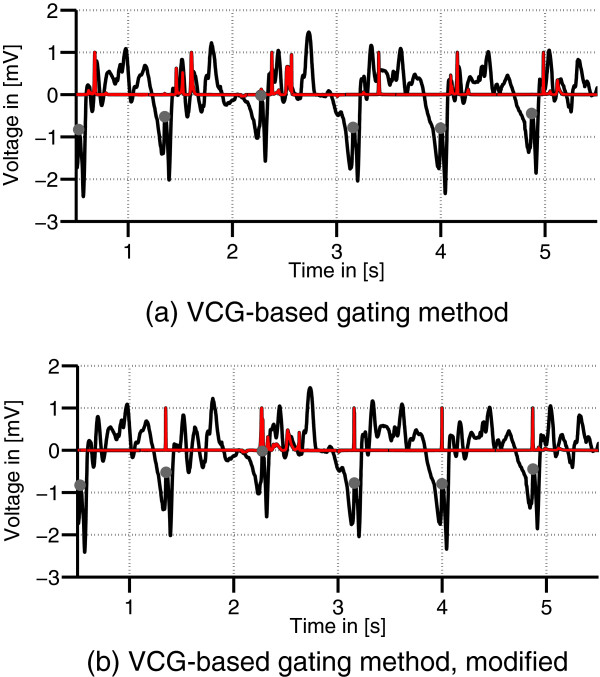
Methods: A strategy based on Independent Component Analysis (ICA) was pursued in this work to enhance the ECG contribution and attenuate the MHD effect. ICA was applied to 12-lead ECG signals recorded inside a 7 T MR scanner. An automatic source identification procedure was proposed to identify an independent component (IC) dominated by the ECG signal. The identified IC was then used for detecting the R-peaks. The presented ICA-based method was compared to other R-peak detection methods using 1) the raw ECG signal, 2) the raw vectorcardiogram (VCG), 3) the state-of-the-art gating technique based on the VCG, 4) an updated version of the VCG-based approach and 5) the ICA of the VCG.

Results: ECG signals from eight volunteers were recorded inside the MR scanner. Recordings with an overall length of 87 min accounting for 5457 QRS complexes were available for the analysis. The records were divided into a training and a test dataset. In terms of R-peak detection within the test dataset, the proposed ICA-based algorithm achieved a detection performance with an average sensitivity (Se) of 99.2%, a positive predictive value (+P) of 99.1%, with an average trigger delay and jitter of 5.8 ms and 5.0 ms, respectively. Long term stability of the demixing matrix was shown based on two measurements of the same subject, each being separated by one year, whereas an averaged detection performance of Se = 99.4% and +P = 99.7% was achieved.Compared to the state-of-the-art VCG-based gating technique at 7 T, the proposed method increased the sensitivity and positive predictive value within the test dataset by 27.1% and 42.7%, respectively.

Conclusions: The presented ICA-based method allows the estimation and identification of an IC dominated by the ECG signal. R-peak detection based on this IC outperforms the state-of-the-art VCG-based technique in a 7 T MR scanner environment.


Figures

Figure 1
Figure 1
Wiggers diagram. The diagram shows the aortic, atrial and ventricular pressure and the ventricular volume in relation to the ECG signal. (Image source: Wikimedia Commonsa), modified).
Figure 2
Figure 2
ECG electrode positioning. The 12-lead configuration was used for the experimental measurements (a). Typical CMR gating applications employ a reduced orthogonal 2-lead configuration (b).
Figure 3
Figure 3
ECGs acquired outside and inside the MRI. Comparison of ECG leads II and V3 of dataset D1 acquired outside (a)-(b) and inside the 7 T MR scanner in Ff (c)-(d) and Hf position (e)-(f). The dots mark the positions of the R-peaks.
Figure 4
Figure 4
Variation of the MHD effect. ECG records (lead V3) from different volunteers acquired in the head first (Hf) position (a)-(d). The MHD effect varies between the different datasets. The dots mark the positions of the R-peaks.
Figure 5
Figure 5
Automated procedure for the identification ofs^k,ECG. A template matching algorithm was employed for the identification of s^k,ECG. The demixing matrix W obtained from the ECG signals acquired inside the MR scanner (xk) was applied to the ECG signals acquired outside the MR scanner (xk,out). A QRS template was generated from each IC. s^k,ECG was identified by cross-correlating each QRS template with the corresponding IC in s^k.
Figure 6
Figure 6
Estimation of the demixing matrix W and its application. (a): Using a 30 s long ECG signal, the demixing matrix W and the IC s^k,ECG were estimated. (b): The demixing matrix W obtained in the first stage was applied the the latest ECG sample. This procedure was followed by applying an QRS detector to s^k,ECG.
Figure 7
Figure 7
Exemplary ICs. Different ICs obtained from datasets D1(Ff) (a)-(b) and D2(Ff) (c)-(d). The ICs s^k,ECG shown in (a) and (c) were used for R-peak detection.
Figure 8
Figure 8
IC used for gating, its first derivative, IC from the ECG acquired outside the MR scanner and first derivative. IC from dataset D1(Ff) identified as s^k,ECG(a) and its first derivative with detected R-peaks positions (b). (c): s^k,out,ECG obtained by applying the demixing matrix W to the ECG acquired outside the MR scanner. (d): The first derivative of (c).
Figure 9
Figure 9
QRS upslopes. Mean and standard deviations of the QRS-upslopes for all datasets in s^k,ECG (red) and of the corresponding IC s^k,out,ECG (green).
Figure 10
Figure 10
VCG-based gating results. VCG lead z (black) of a 7 T record. The dots mark the R-peak positions. The red graph displays the result of the VCG gating algorithm (a) and of its modification using the different reference vector rout(b).

References

    1. Attili AK, Schuster A, Nagel E, Reiber JH, van der Geest RJtitle=Quantification in cardiac MRI: advances in image acquisition and processing. Int J Cardiovasc Imaging. 2010. pp. 27–40. - PMC - PubMed
    1. Niendorf T, Sodickson DK, Krombach GA, Schulz-Menger J. Toward cardiovascular MRI at 7 T: clinical needs, technical solutions and research promises. Eur Radiol. 2010;20(12):2806–16. doi: 10.1007/s00330-010-1902-8. - DOI - PMC - PubMed
    1. van Ooij P, Kleinloog R, Zwanenburg J, Visser F, Luijten P, Barker A, Markl M, Nederveen A, Majoie C, Regli L. et al. Improved depiction of hemodynamics in intracranial aneurysms by 4D flow MRI at 7T compared to 3T. J Cardiovasc Magn Reson. 2013;15(Suppl 1):W12. doi: 10.1186/1532-429X-15-S1-W12. - DOI
    1. Scott A, Keegan J, Firmin D. Motion in cardiovascular MR imaging. Radiology. 2009;250(2):331–51. doi: 10.1148/radiol.2502071998. - DOI - PubMed
    1. Fischer S, Wickline S, Lorenz C. Novel real-time R-wave detection algorithm based on the vectorcardiogram for accurate gated magnetic resonance acquisitions. Magnet Reson Med. 1999;42(2):361–70. doi: 10.1002/(SICI)1522-2594(199908)42:2<361::AID-MRM18>3.0.CO;2-9. - DOI - PubMed

Publication types