. 2014 Feb;1842(2):220-31.
doi: 10.1016/j.bbadis.2013.11.009. Epub 2013 Nov 16.

Inhibition of ERK-DLP1 signaling and mitochondrial division alleviates mitochondrial dysfunction in Alzheimer's disease cybrid cell

Affiliations

Inhibition of ERK-DLP1 signaling and mitochondrial division alleviates mitochondrial dysfunction in Alzheimer's disease cybrid cell

Xueqi Gan et al. Biochim Biophys Acta. 2014 Feb.

Abstract

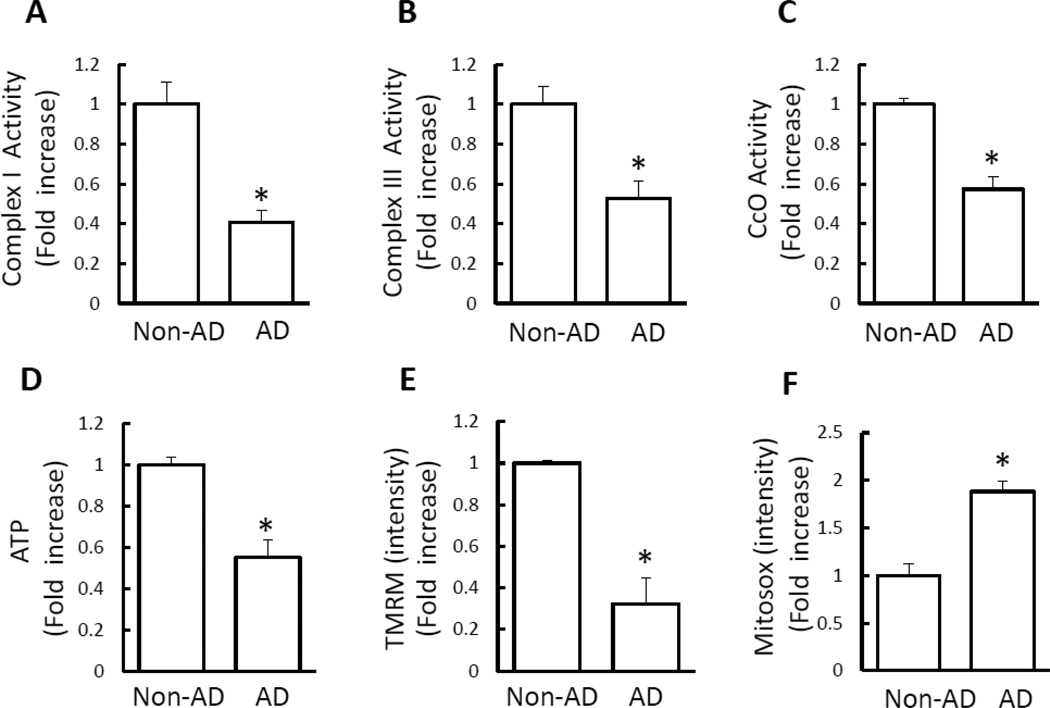
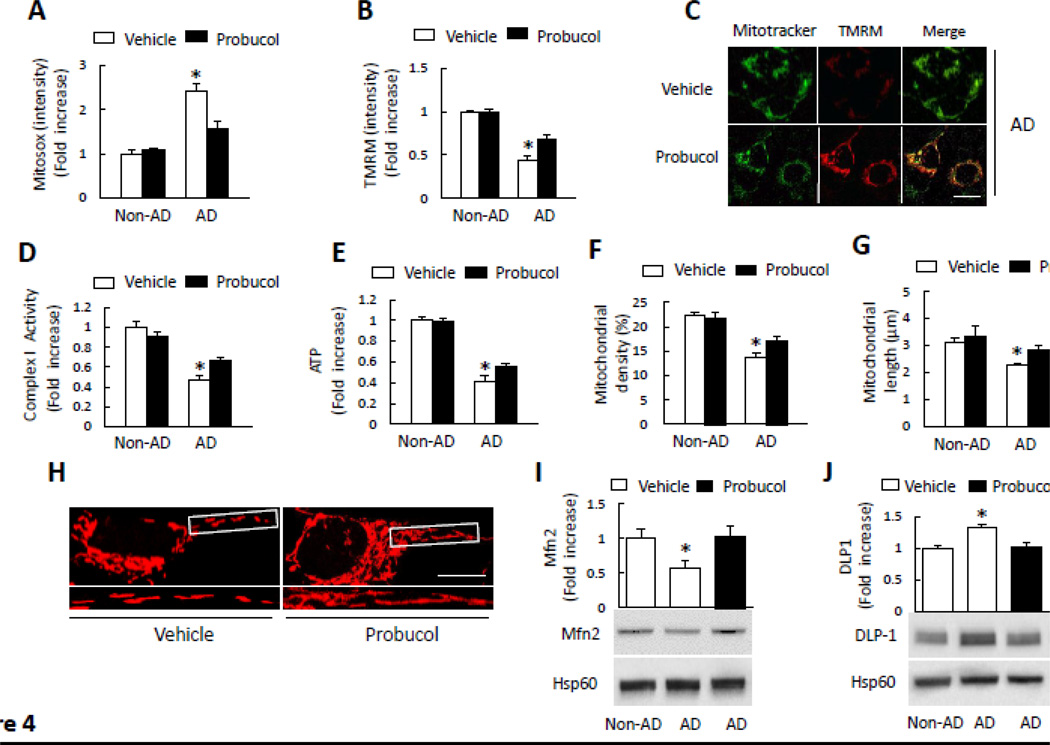
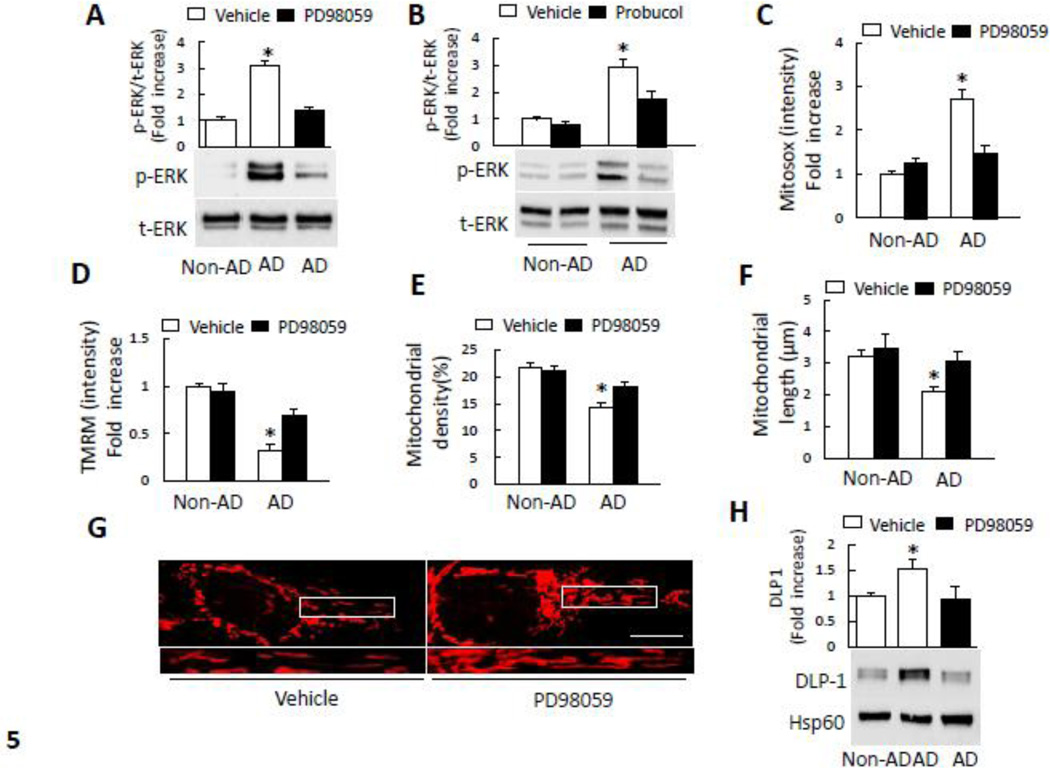
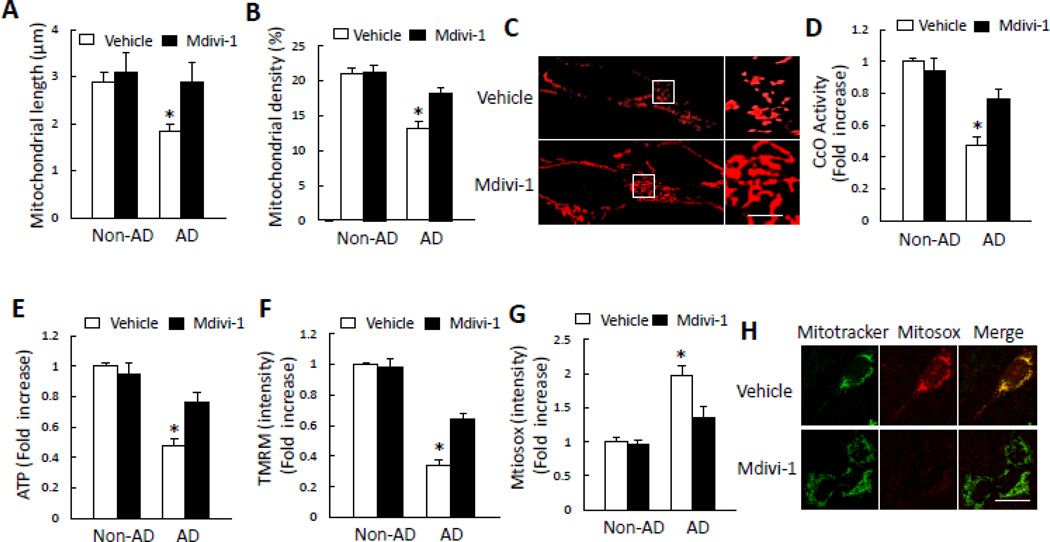
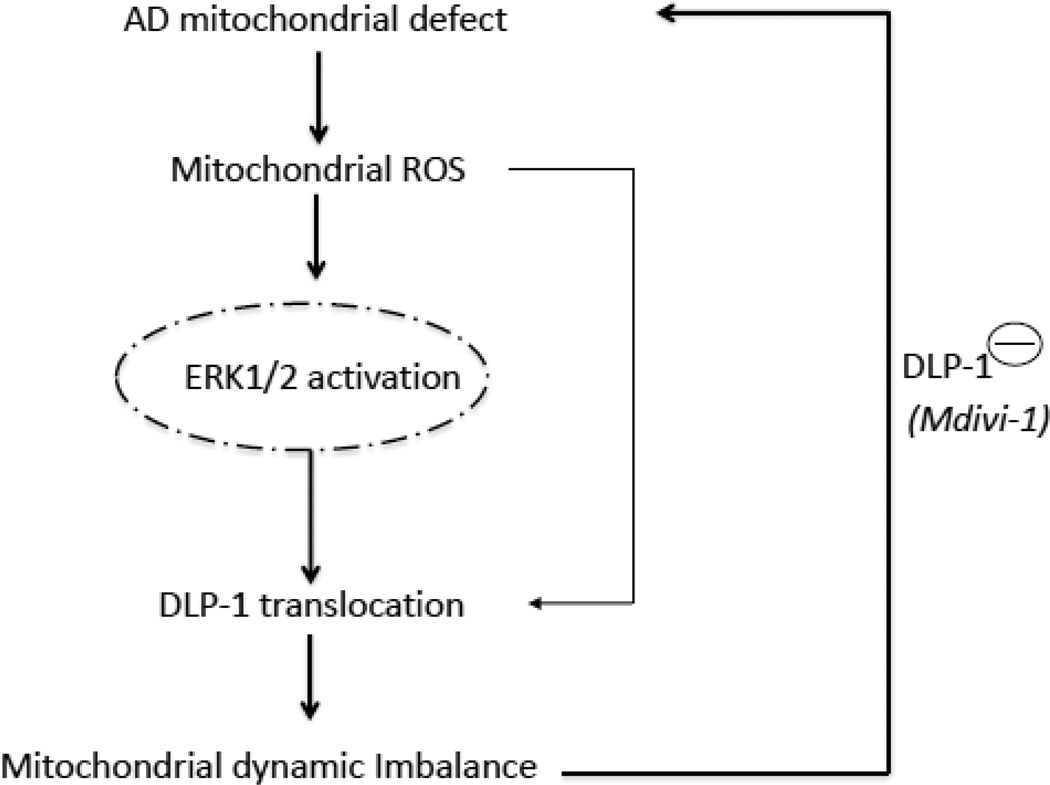
Mitochondrial dysfunction is an early pathological feature of Alzheimer's disease (AD). The underlying mechanisms and strategies to repair it remain unclear. Here, we demonstrate for the first time the direct consequences and potential mechanisms of mitochondrial functional defects associated with abnormal mitochondrial dynamics in AD. Using cytoplasmic hybrid (cybrid) neurons with incorporated platelet mitochondria from AD and age-matched non-AD human subjects into mitochondrial DNA (mtDNA)-depleted neuronal cells, we observed that AD cybrid cells had significant changes in morphology and function; such changes associate with altered expression and distribution of dynamin-like protein (DLP1) and mitofusin 2 (Mfn2). Treatment with antioxidant protects against AD mitochondria-induced extracellular signal-regulated kinase (ERK) activation and mitochondrial fission-fusion imbalances. Notably, inhibition of ERK activation not only attenuates aberrant mitochondrial morphology and function but also restores the mitochondrial fission and fusion balance. These effects suggest a role of oxidative stress-mediated ERK signal transduction in modulation of mitochondrial fission and fusion events. Further, blockade of the mitochondrial fission protein DLP1 by a genetic manipulation with a dominant negative DLP1 (DLP1(K38A)), its expression with siRNA-DLP1, or inhibition of mitochondrial division with mdivi-1 attenuates mitochondrial functional defects observed in AD cybrid cells. Our results provide new insights into mitochondrial dysfunction resulting from changes in the ERK-fission/fusion (DLP1) machinery and signaling pathway. The protective effect of mdivi-1 and inhibition of ERK signaling on maintenance of normal mitochondrial structure and function holds promise as a potential novel therapeutic strategy for AD.

Keywords: AD; Alzheimer's disease; Amyloid beta peptide; Aβ; CcO; Cybrid cells; Cytochrome c oxidase; DLP1; Dynamin-like protein; ERK; Extracellular signal-regulated kinase; HD; Huntington disease; Mfn2; Mitochondrial DNA; Mitochondrial fission and fusion; Mitofusin 2; PD; Parkinson disease; ROS; Reactive oxygen species; TMRM; Tetramethylrhodaminemethylester; mtDNA.


Conflict of interest statement

Conflict of Interest: The authors have no conflict of interest to disclose

Figures

Figure 1
Figure 1
Mitochondrial dysfunction in AD cybrid cells. A–D) Enzymatic activity of complex I, III, and IV (CcO), and ATP levels were determined in cell lysates from indicated cell groups. E–F) Mitochondrial membrane potential and reactive oxygen species (ROS) were measured by TMRM (E) and Mitosox staining intensity (F), respectively. Image intensity was quantified using NIH Image J software. Data are expressed as fold increase relative to non-AD cybrid cells. N = 7 cell lines/group. * p<0.05 versus non-AD group.
Figure 2
Figure 2
Abnormal mitochondrial morphology in AD cybrid cells. Cybrid cells were labeled with Mitotracker Red for visualization of mitochondrial morphology. (A1–A3) Quantitative measurement of mitochondrial density presented as the percentage of area occupied by mitochondria in entire cells (A1), neuronal process (A2), or cell body (A3), using NIH Image J software. B) Representative images of Mitotracker Red staining. Lower panels present larger images corresponding to the indicated images above. Scale bar = 5 µm. (C1–C3) Average mitochondrial length over the entire cell, neuronal processes, and cell body was lower in AD cybrid cells compared to non-AD cells. (C4) Quantification of mitochondrial sizes based on the grouped differently sized bins. N = 7 cell lines/group. * p<0.05 versus non-AD group.
Figure 3
Figure 3
DLP1 and Mfn2 expression levels in AD cybrid mitochondria. A–D) Densitometry of immunoreactive bands for DLP1 (A, C) and Mfn2 (B, D) in mitochondrial fractions (A–B) and cytosol (C–D) of indicated groups. Data were expressed as fold-increase of DLP1 or Mfn2 relative to non-AD cells. DLP1 or Mfn2 levels were normalized to mitochondrial marker Hsp60 or β-actin. Representative immunoblots are shown in lower panel. N = 7 cell lines/group. *p<0.05 versus non-AD group.
Figure 4
Figure 4
Effect of antioxidant treatment on mitochondrial function and morphology. A–B) Cells were treated with probucol (10 µM) for 24 h and then stained with Mitosox or TMRM to determine mitochondrial ROS levels and membrane potential. Quantification of staining intensity for Mitosox (A) and TMRM (B) in the indicated groups of cells using NIH Image J software. *p<0.05 versus all non-AD groups and probucol treated AD group. (C) Representative images with TMRM staining (Scale bar = 10 µm). Mitotracker staining was used to show mitochondria. D–E) Complex I activity (D) and ATP levels (E) were measured in the indicated groups of cells with or without probucol treatment. Data are expressed as fold increase relative to vehicle-treated non-AD cybrid cells. *p<0.05 versus all non-AD groups and probucol treated AD group. F–H) Quantitative measurement of mitochondrial density (F) and average mitochondrial length (G) in indicated cell groups using NIH Image J. *p<0.05 versus all non-AD groups and probucol treated AD group. (H) Representative images of Mitotracker Red staining. The lower panels present larger images corresponding to indicated images above (Scale bar = 5µM). I–J) Quantification of immunoreactive bands for Mfn2 (I) or DLP1 (J) relative to Hsp60 in indicated cell groups with probucol or vehicle treatment using NIH Image J software. *, p<0.05 versus non-AD groups and probucol treated AD group. Data are expressed as fold increase relative to vehicle-treated non-AD cybrid cells. Representative immunoblots are shown in the lower panel. N = 5–7 cell lines/group.
Figure 5
Figure 5
Inhibition of ERK activation rescued abnormal mitochondrial function and morphology. A–B) Densitometry of immunoreactive bands for phospho-ERK1/2 (p-ERK1/2) using NIH Image J, normalized to total-ERK1/2 (t-ERK1/2) in indicated cell groups treated with PD98059 (10 µM for 2 h) (A), probucol (10 µM for 24 h) (B), or vehicle. *p<0.05 versus all other groups. Representative immunoblots are shown in lower panel. C) PD98059 treatment decreased Mitosox staining intensity in AD cybrid cells compared to vehicle treatment. (D) TMRM staining intensity was significantly increased in AD cybrid cells treated with PD98059. *p<0.05 versus all other groups. E–F) Effect of ERK inhibitor on mitochondrial morphology. Mitochondrial density (E) and average length (F) were measured in indicated cell groups treated with PD98059 or vehicle. *p<0.05 versus all other groups. (G) Representative images are shown for Mitotracker Red staining. The lower panel is a larger image corresponding to the indicated image above (Scale bar = 5 µm). H) Quantification of immunoreactive bands for DLP1 and Mfn2 normalized to Hsp60 in mitochondrial fractions of the indicated cell groups with PD98059 or vehicle treatment. Representative immunoblots are shown in lower panel. Data are expressed as fold increase relative to vehicle-treated non-AD cybrid cells. *p<0.05 versus all other groups. N = 5–7 cell lines/group.
Figure 6
Figure 6
Inhibition of DLP1 by mdivi-1 rescues mitochondrial structure and function in AD cybrid mitochondria. A–C) Effect of mdivi-1 on mitochondrial morphology. Mdivi-1 treatment (10 µM for 24 h) significantly increased mitochondrial length (A) and density (B) Representative images for Mitotracker red staining reveal mitochondrial morphology (C). *p<0.05 versus all other groups. The right panel is a larger image corresponding to the indicated image on the left panel (Scale bar = 5 µm). D–H) Effect of mdivi-1 on mitochondrial function. Treatment with mdiv-1 resulted in increased CcO activity (D), ATP levels (E), and TMRM intensity in AD cybrid cells (F). Mdivi-1 also attenuated mitochondrial ROS production as shown by reduced level of Mitosox staining intensity (G) Representative images for Mitotracker and Mitosox staining are shown (H) (Scale bar = 10 µm). *p<0.05 versus all other groups. N = 5–7 cell lines/group.
Figure 7
Figure 7
Effect of DLP1 blockade accomplished by introduction of DLP1K38A or siRNA-DLP1 to AD cybrid cells. A–D) AD cybrid cells were transfected with GFP-DLP1K38A or empty vector. After 24 h, cells were incubated with Mitotracker Red to analyze mitochondrial morphology under confocal microscopy (Scale bar = 5 µm). DLP1K38A-transfected AD cybrids had tubular mitochondria, whereas empty vector-transfected cells retained fragmented mitochondrial morphology (A). Mitochondrial average length (B), density (C), and CcO activity (D) were increased in DLP1K38A-transfected cells compared to vector-transfected control cells. *p<0.05 versus vector treated group. E–J) Effect of siRNA-DLP1. Immunoblotting for DLP1 in cells treated with siRNA-DLP1 (siRNA) or control siRNA (con) (E). Representative immunoblots for DLP1 and β-actin. (F) Mitotracker staining and immunostaining of DLP1 in siRNA-DLP1 or control siRNA treated cells (Scale bar = 5 µm). Average mitochondrial length (G) and density (H).I–J), increased TMRM intensity (I), and ATP levels (J) in siRNA-DLP1 cells relative to control siRNA cells. *p<0.05 versus vector treated group. N = 5–7 cell lines/group.
Figure 8
Figure 8
Working hypothesis: Increased mitochondrial ROS generation/accumulation is due to defects in AD mitochondrial respiratory function, which leads to an activation of ERK signal transduction. ERK activation directly or indirectly disrupts the balance of mitochondrial dynamics (fusion and fission events) and results in altered DLP1 or Mfn2 expression levels and distribution, which eventually leads to aberrant mitochondrial morphology and function. Inhibition of DLP1 activity/expression levels by mdivi-1 or genetic blockade of DLP1 rescues the perturbation of mitochondrial morphology and function relevant to AD mitochondrial degeneration.

References

    1. Swerdlow RH. Mitochondria and cell bioenergetics: increasingly recognized components and a possible etiologic cause of Alzheimer's disease. Antioxidants & redox signaling. 2012;16:1434–1455. - PMC - PubMed
    1. Du H, Guo L, Fang F, Chen D, Sosunov AA, McKhann GM, Yan Y, Wang C, Zhang H, Molkentin JD, Gunn-Moore FJ, Vonsattel JP, Arancio O, Chen JX, Yan SD. Cyclophilin D deficiency attenuates mitochondrial and neuronal perturbation and ameliorates learning and memory in Alzheimer's disease. Nat Med. 2008;14:1097–1105. - PMC - PubMed
    1. Du H, Guo L, Yan SS. Synaptic Mitochondrial Pathology in Alzheimer's Disease. Antioxid Redox Signal. 2011 - PMC - PubMed
    1. Guo L, Du H, Yan S, Wu X, McKhann GM, Chen JX, Yan SS. Cyclophilin D deficiency rescues axonal mitochondrial transport in Alzheimer's neurons. PLoS One. 2013;8:e54914. - PMC - PubMed
    1. Du H, Guo L, Wu X, Sosunov AA, McKhann GM, Chen JX, Yan SS. Cyclophilin D deficiency rescues Abeta-impaired PKA/CREB signaling and alleviates synaptic degeneration. Biochim Biophys Acta. 2013 - PMC - PubMed

Publication types

MeSH terms