. 2013 Oct 23:1:70.
doi: 10.1186/2051-5960-1-70.

Astrocytes differentially respond to inflammatory autoimmune insults and imbalances of neural activity

Affiliations

Astrocytes differentially respond to inflammatory autoimmune insults and imbalances of neural activity

Peter Jukkola et al. Acta Neuropathol Commun. .

Abstract

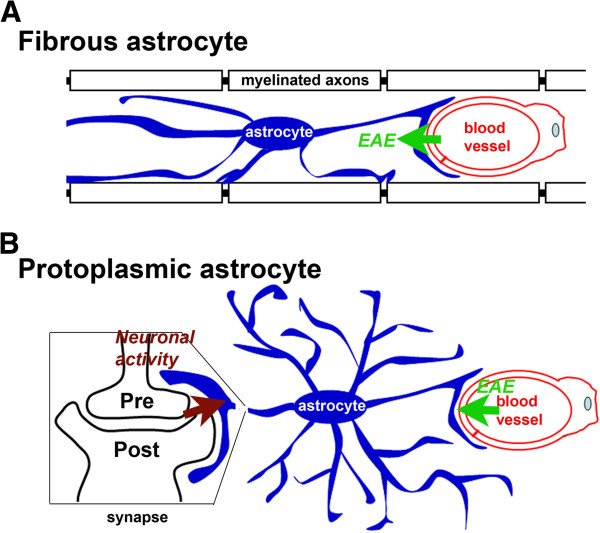
Background: Neuronal activity intimately communicates with blood flow through the blood-brain barrier (BBB) in the central nervous system (CNS). Astrocyte endfeet cover more than 90% of brain capillaries and interact with synapses and nodes of Ranvier. The roles of astrocytes in neurovascular coupling in the CNS remain poorly understood.

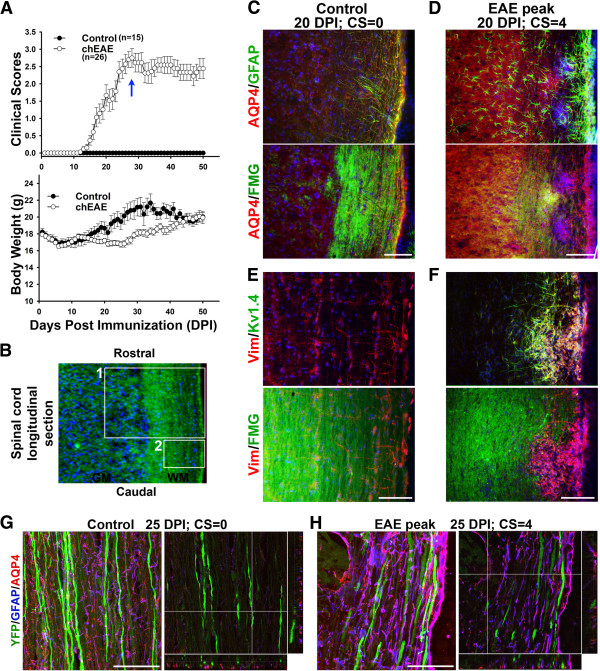
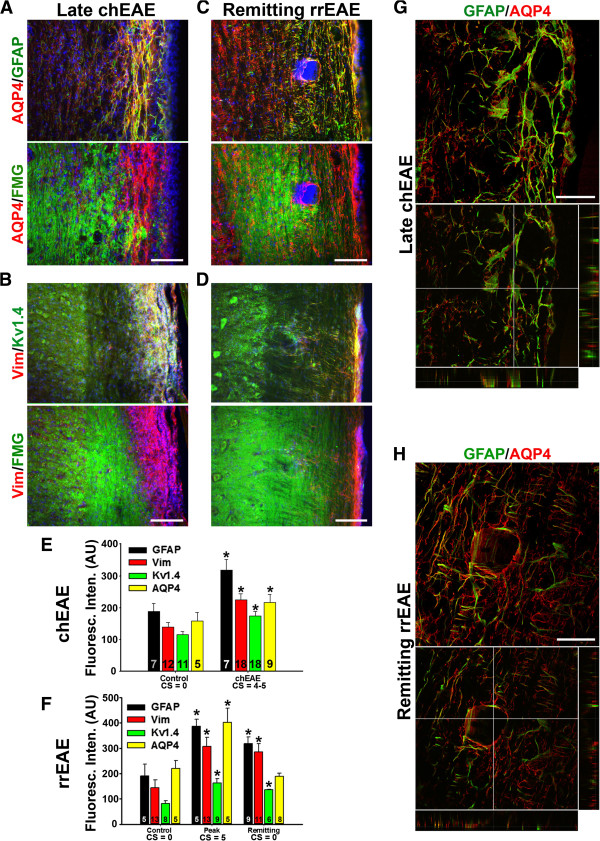
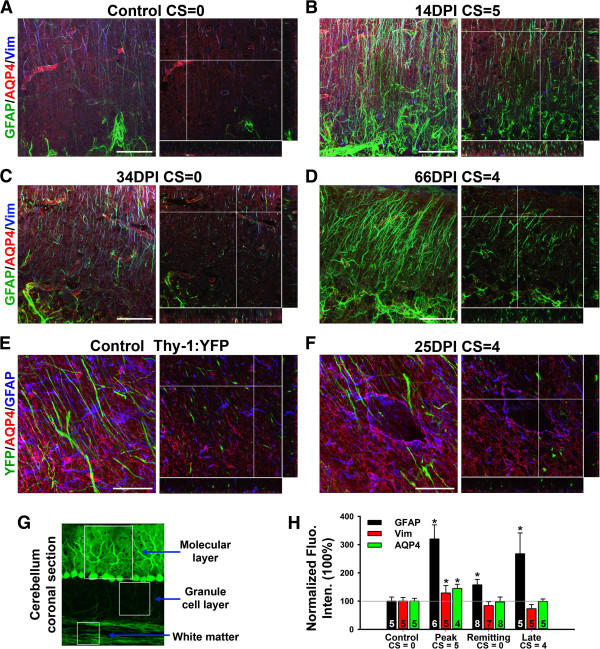
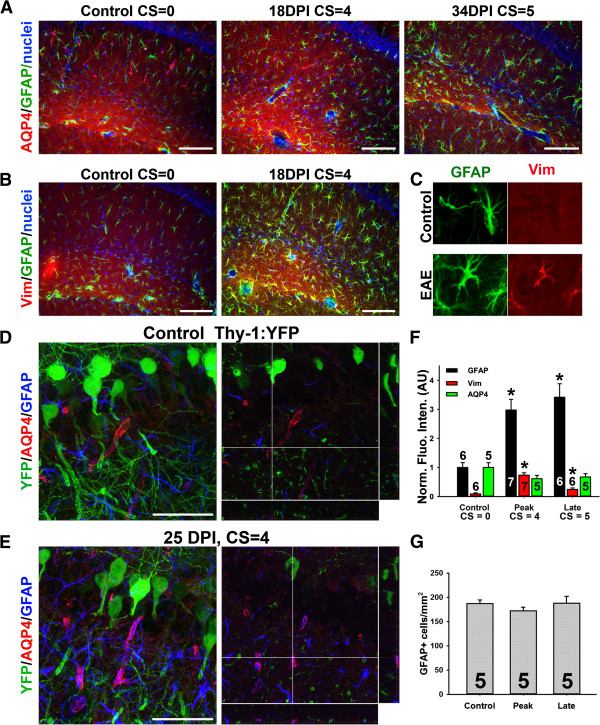
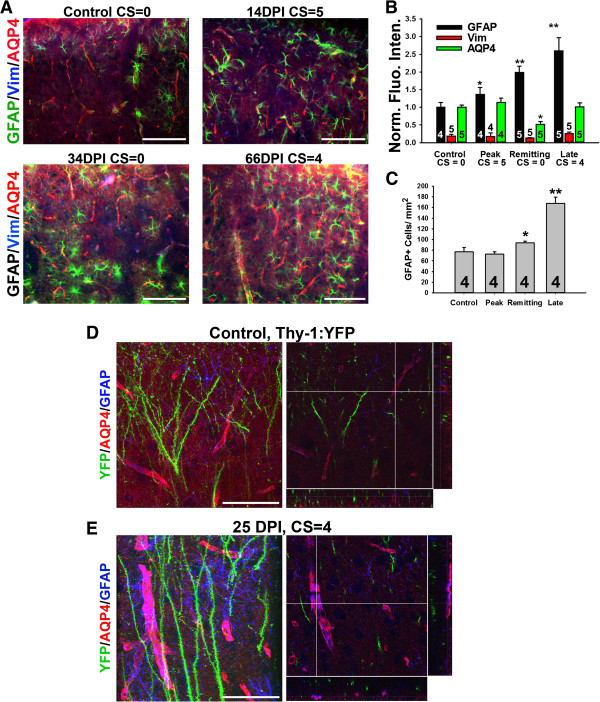
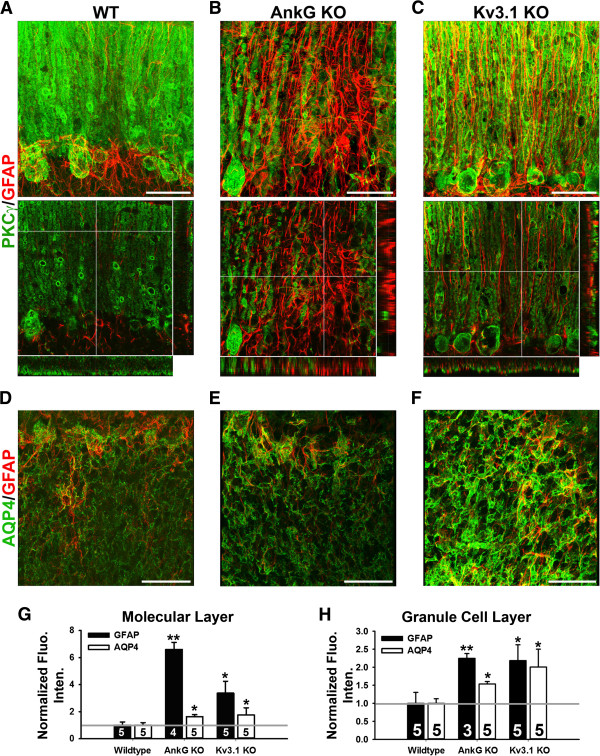
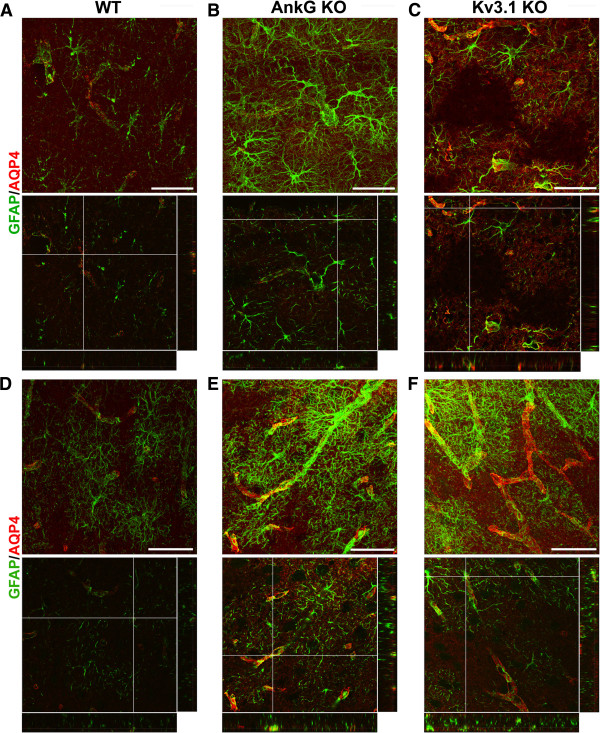
Results: Here we show that astrocytes that are intrinsically different are activated by inflammatory autoimmune insults and alterations of neuronal activity. In the progression of experimental autoimmune encephalomyelitis (EAE), both fibrous and protoplasmic astrocytes were broadly and reversibly activated in the brain and spinal cord, indicated by marked upregulation of glial fibrillary acidic protein (GFAP) and other astrocytic proteins. In early and remitting EAE, upregulated GFAP and astrocytic endfoot water channel aquaporin 4 (AQP4) enclosed white matter lesions in spinal cord, whereas they markedly increased and formed bundles in exacerbated lesions in late EAE. In cerebellar cortex, upregulation of astrocytic proteins correlated with EAE severity. On the other hand, protoplasmic astrocytes were also markedly activated in the brains of ankyrin-G (AnkG) and Kv3.1 KO mice, where neuronal activities are altered. Massive astrocytes replaced degenerated Purkinje neurons in AnkG KO mice. In Kv3.1 KO mice, GFAP staining significantly increased in cerebellar cortex, where Kv3.1 is normally highly expressed, but displayed in a patchy pattern in parts of the hippocampus.

Conclusions: Thus, astrocytes can detect changes in both blood and neurons, which supports their central role in neurovascular coupling. These studies contribute to the development of new strategies of neuroprotection and repair for various diseases, through activity-dependent regulation of neurovascular coupling.


Figures

Figure 1
Figure 1
Activation of astrocytes in spinal cord white matter. A, Clinical scores (top) and body weight (bottom) of mice with chEAE. B, White matter (WM) and gray matter (GM) in spinal cord longitudinal section was stained with FMG (green) and nuclear dye (blue). Box 1 shows both GM and WM and box 2 shows only WM. Spinal cord sections, control (C) and EAE peak (D), were co-stained for GFAP (green, top), AQP4 (red), Hoechst (blue), and FMG (green, bottom). Co-staining of Kv1.4 (green, top), Vim (red), Hoechst (blue) and FMG (green, bottom) were also performed on control (E) and EAE (F) spinal cord sections. High magnification confocal image stacks were obtained from control (G) and EAE (H) Thy1-YFP transgenic mice. Images contain YFP (green), GFAP (blue) and AQP4 (red). The collapsed 2D image is on the left, and 3 cross sections are on the right. In (G), the crossbars are centered on a putative node of Ranvier. In (H), the crossbars are centered on the AQP4+/GFAP + lesion edge. Scale bars, 500 μm in C-F, 50 μm in G,H.
Figure 2
Figure 2
Astrocytic proteins are altered in lesion sites of at the late stage of chEAE and at the remitting stage of rrEAE. A and B, staining patterns of astrocytic proteins at the late stage of chEAE. C and D, staining pattern of astrocytic proteins at the remitting stage of rrEAE. E, Summary of the alteration of astrocytic proteins in chEAE. F, Summary of the alteration of astrocytic proteins in rrEAE. The “n” number of quantified images is provided for each bar. One-way ANOVA followed by Fisher’s test. Asterisk (*) shows significant difference from Control staining intensity for each antibody, p < 0.05. G, High magnification view of a lesion site at the late stage of chEAE. H, Confocal images of a lesion site at the remitting stage of rrEAE. Collapsed 2D image is on the top, and 3 cross sections are on the bottom. In (G), the crossbars are centered on an astrocyte with colocalizing AQP4 and GFAP. In (H), the crossbars emphasize the absence of AQP4 and GFAP in the lesion core. Scale bars, 500 μm in A-D, 50 μm in G,H.
Figure 3
Figure 3
Differentially altered expression of astrocytic proteins in the cerebellum of EAE mice. A, The confocal image stack of cerebellar molecular layer that was stained for GFAP (green), AQP4 (red) and Vim (blue) from a control mouse. Collapsed 2D image is on the left and 3 cross sections of 3D are on the right. B, The images at the peak stage of an rrEAE mouse. C, The images at the remitting stage of an rrEAE mouse. D, The images at the relapsing stage of an rrEAE mouse. E, The confocal images of cerebellar WM from a Thy1-YFP transgenic mouse. YFP (green), AQP4 (red) and GFAP (blue). In (A-E), the crossbars are centered on astrocytic endfeet with colocalizing AQP4 and GFAP. F, The confocal images at the peak stage of chEAE. The crossbars show the lesion edge with upregulated AQP4 and GFAP. G, Structural diagram of cerebellar cortex. H, Summary of changes of protein levels during rrEAE in cerebellar molecular layer. One-Way ANOVA followed by Fisher’s test. *, significant difference from Control for each antibody, p < 0.05. The “n” number of quantified images is provided for each bar. Scale bars, 50 μm.
Figure 4
Figure 4
Activation of astrocytes in the hippocampus of EAE mice. A, Increased GFAP but not AQP4 staining in the hippocampus of EAE mice. B, Increased Vim staining in the hippocampus during EAE progression. C, Enlarged images of individual astrocytes in the hippocampus clearly show the increase of Vim staining. High magnification confocal image stacks were obtained from control (D) and EAE (E) Thy1-YFP transgenic mice. Images contain YFP (green), GFAP (blue) and AQP4 (red). The collapsed 2D image is on the left, and 3 cross sections are on the right. The crossbars reveal astrocytic endfeet with colocalizing AQP4 and GFAP. F, Summary of the levels of astrocytic proteins at different stages during EAE progression. One-Way ANOVA followed by Fisher’s test, *, significant difference from Control for each antibody, p < 0.01. G, GFAP + cell number was not changed during EAE. The “n” number of quantified images is provided for each bar. Scale bars, 200 μm in A and B, 50 μm in D and E.
Figure 5
Figure 5
Alteration of GFAP and AQP4 in the cortex of EAE mice. A, Alterations of astrocytic proteins in the cortex at different stages of rrEAE. B, Summary of the alterations of intensities. C, Summary of increased GFAP + cells. (B, C) One-Way ANOVA followed by Fisher’s test. *, significant difference from Control for each antibody, p < 0.05. **, significant difference from Control for each antibody, p < 0.01. The “n” number of quantified images is provided for each bar. High magnification confocal image stacks were obtained from control (D) and EAE (E) Thy1-YFP transgenic mice. Images contain YFP (green), GFAP (blue) and AQP4 (red). The collapsed 2D image is on the left, and 3 cross sections are on the right. Scale bars, 200 μm in A, 50 μm in D and E.
Figure 6
Figure 6
Upregulation of GFAP and AQP4 in the cerebellum in AnkG and Kv3.1 KO mice. A, High magnification image stacks of cerebellar molecular layer stained with anti-PKCγ (green) and anti-GFAP (red) antibodies. The collapsed 2D image is on the left, and 3 cross sections are on the right. B, Confocal image stacks from the AnkG KO mice. C, Confocal image stacks from the Kv3.1 KO mice. In (A,C), the crossbars reveal radially oriented GFAP + Bergmann glial processes in (A) WT and (C) Kv3.1 KO mice. In (B), the crossbars are centered on highly upregulated GFAP + astrocyte processes in the absence of Purkinje neurons in an AnkG KO mouse. D, A single confocal image of the granule cell layer in a WT mouse. E, An image from the AnkG KO mice. F, An image from the Kv3.1 KO mice. G, Normalized fluorescence intensity in the molecular layer. H, Normalized fluorescence intensity in the granule cell layer. (G, H) One-Way ANOVA followed by Fisher’s test. *, significant difference from Wildtype for each antibody, p < 0.05. **, significant difference from Wildtype for each antibody, p < 0.01. The “n” number of quantified images is provided for each bar. Scale bars, 50 μm.
Figure 7
Figure 7
Altered astrocytes in the hippocampus and cortex in Kv3.1 KO mice. The confocal image stacks of hippocampus (A-C) and cortex (D-F) were costained for GFAP (green) and AQP4 (red) from WT (A,D), AnkG KO (B,E) and Kv3.1 KO (C,F) mice. The collapsed 2D image is on the top and 3 cross sections are at the bottom. The crossbars are centered on astrocyte endfeet with colocalizing AQP4 and GFAP. Scale bars, 100 μm.
Figure 8
Figure 8
Diagram of regulation of fibrous and protoplasmic astrocytes by inflammation and neuronal activities. A, Fibrous astrocytes in the WM with endfeet contacting blood capillaries and nodes of Ranvier. B, Protoplasmic astrocytes in the GM with endfeet contacting blood capillaries and synapses.

Similar articles

Cited by

References

    1. Zlokovic BV. The blood–brain barrier in health and chronic neurodegenerative disorders. Neuron. 2008;1(2):178–201. doi: 10.1016/j.neuron.2008.01.003. - DOI - PubMed
    1. Quaegebeur A, Lange C, Carmeliet P. The neurovascular link in health and disease: molecular mechanisms and therapeutic implications. Neuron. 2011;1(3):406–424. doi: 10.1016/j.neuron.2011.07.013. - DOI - PubMed
    1. Ransohoff RM, Brown MA. Innate immunity in the central nervous system. J Clin Invest. 2012;1(4):1164–1171. doi: 10.1172/JCI58644. - DOI - PMC - PubMed
    1. Nedergaard M, Ransom B, Goldman SA. New roles for astrocytes: redefining the functional architecture of the brain. Trends Neurosci. 2003;1(10):523–530. doi: 10.1016/j.tins.2003.08.008. - DOI - PubMed
    1. Eroglu C, Barres BA. Regulation of synaptic connectivity by glia. Nature. 2010;1(7321):223–231. doi: 10.1038/nature09612. - DOI - PMC - PubMed

Publication types

MeSH terms