. 2014 Apr;187(2):412-26.
doi: 10.1016/j.jss.2013.10.032. Epub 2013 Oct 21.

Molecular determinants of susceptibility to oncolytic vesicular stomatitis virus in pancreatic adenocarcinoma

Affiliations

Molecular determinants of susceptibility to oncolytic vesicular stomatitis virus in pancreatic adenocarcinoma

Aaron U Blackham et al. J Surg Res. 2014 Apr.

Abstract

Background: M protein mutant vesicular stomatitis virus (M51R-VSV) has oncolytic properties against many cancers. However, some cancer cells are resistant to M51R-VSV. Herein, we evaluate the molecular determinants of vesicular stomatitis virus (VSV) resistance in pancreatic adenocarcinoma cells.

Methods: Cell viability and the effect of β-interferon (IFN) were analyzed using 3-(4,5-dimethylthiazol-2-yl)-5-(3-carboxymethoxyphenyl)-2-(4-sulfophenyl)-2H-tetrazolium assay. Gene expression was evaluated via microarray analysis. Cell infectability was measured by flow cytometry. Xenografts were established in athymic nude mice and treated with intratumoral M51R-VSV.

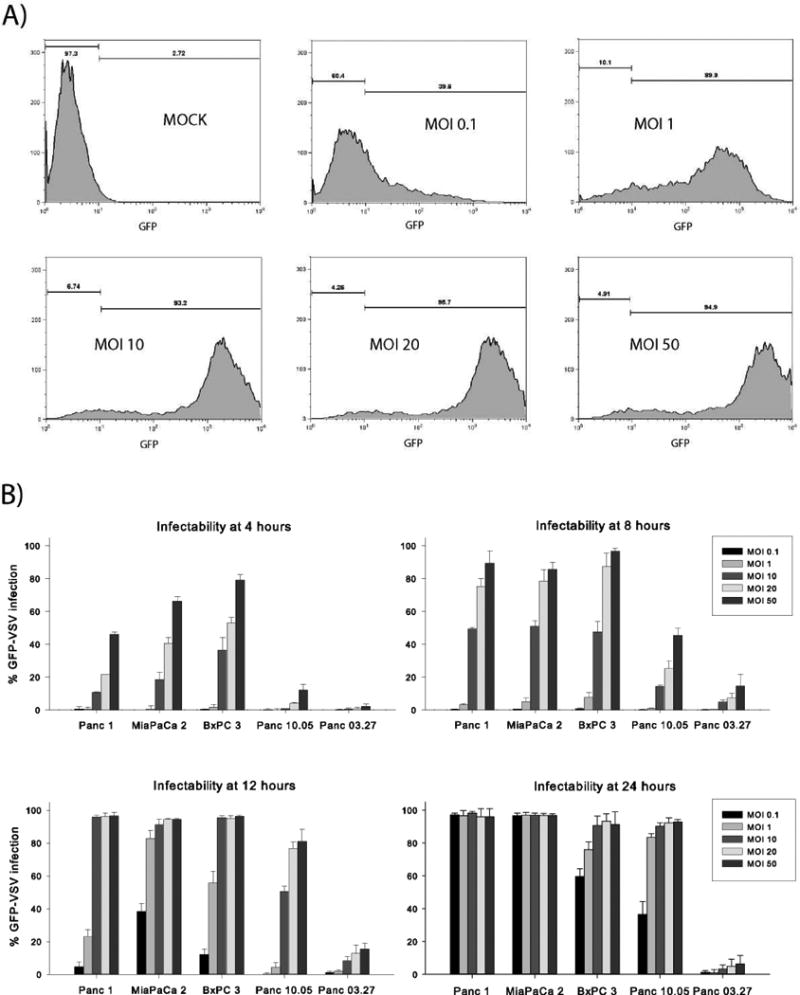
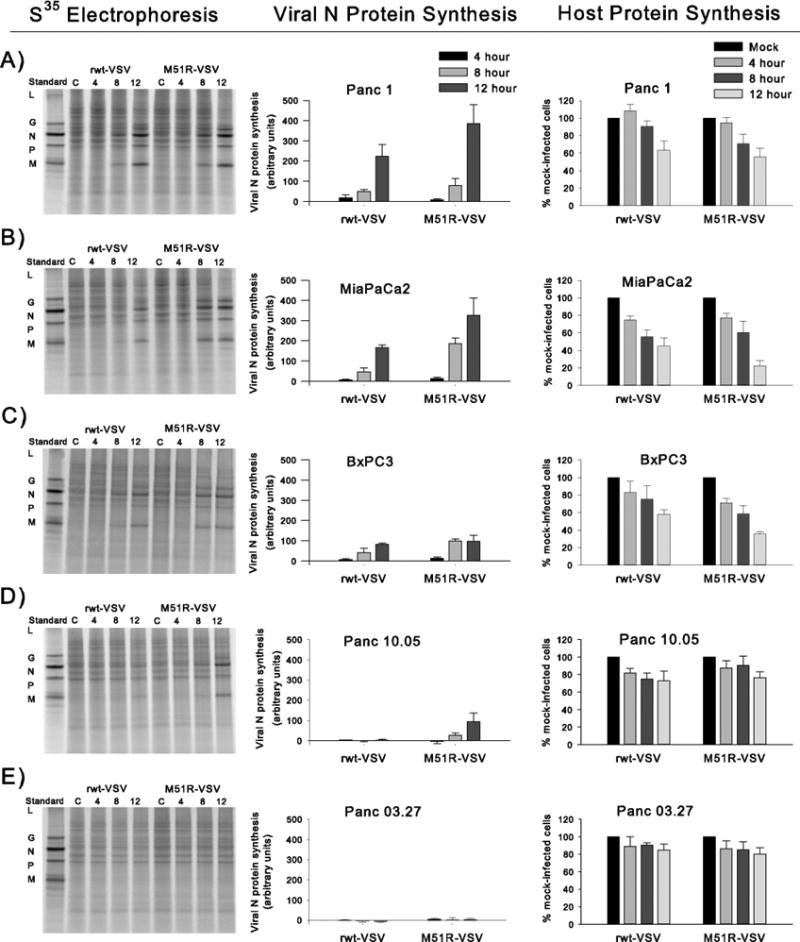
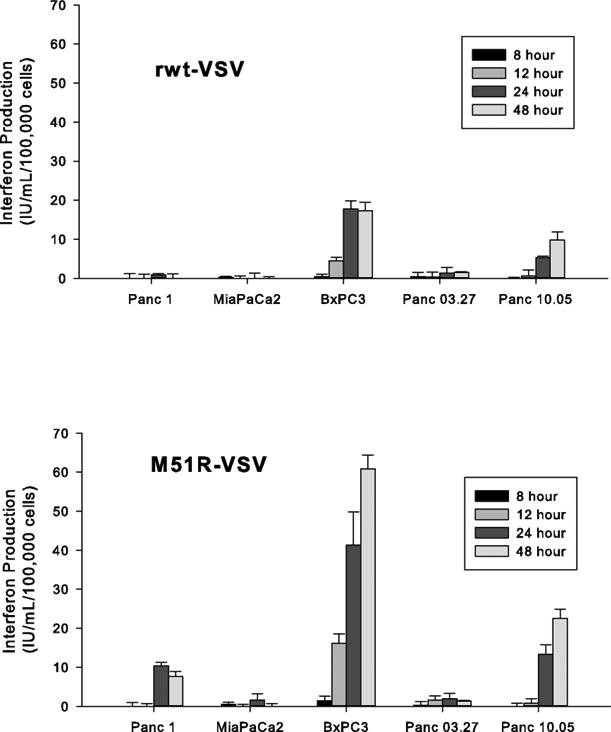
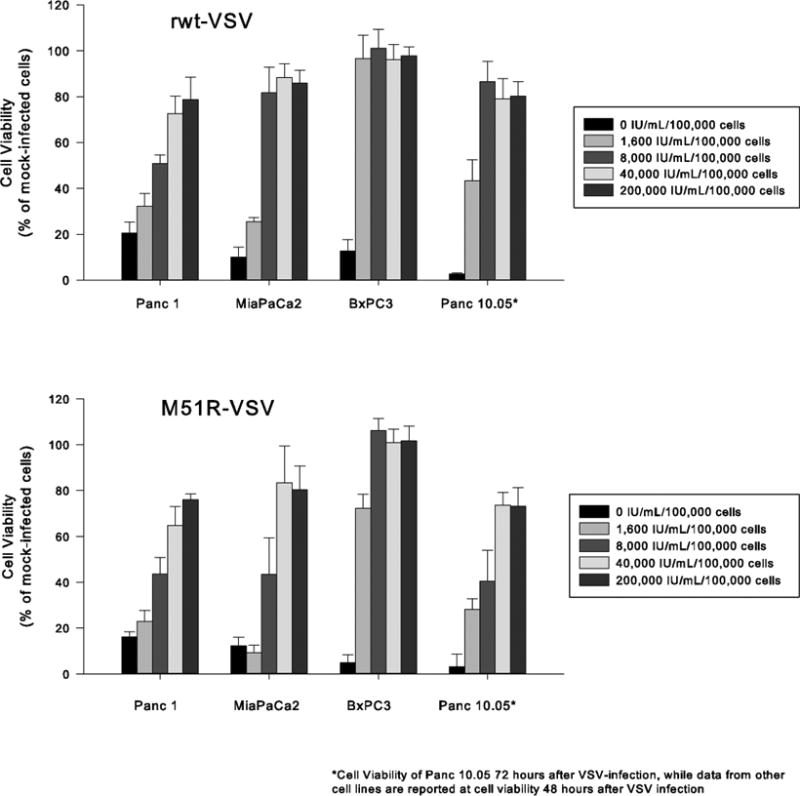
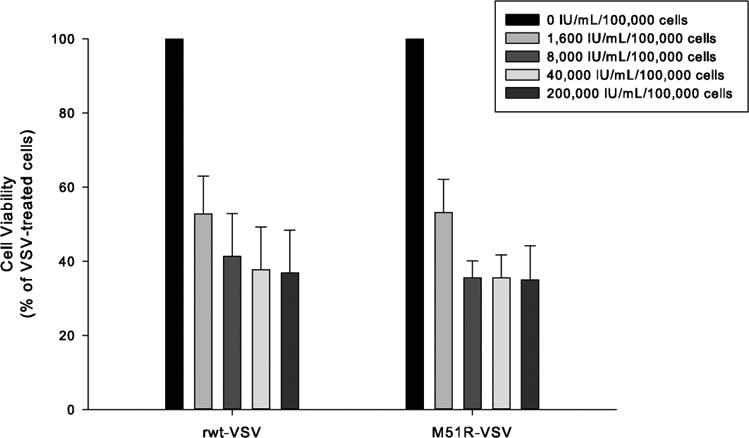
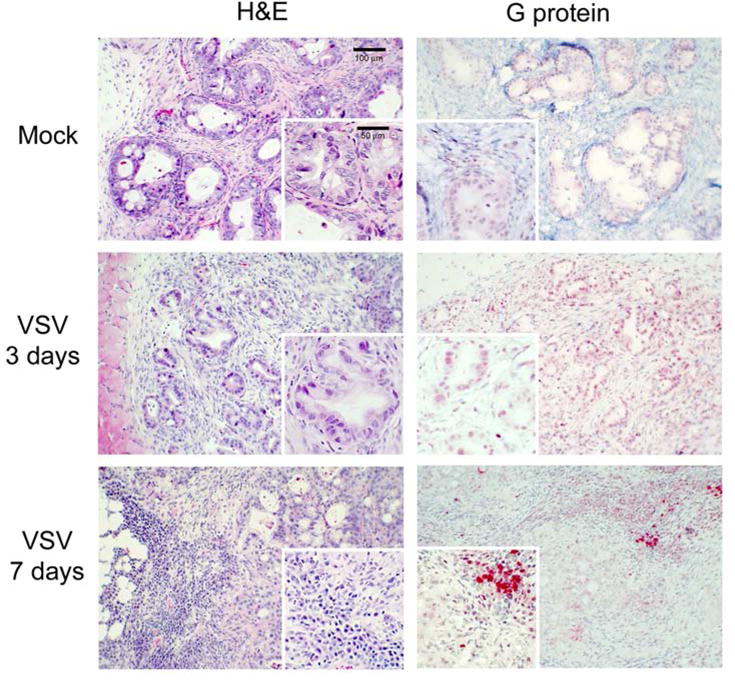
Results: Four of five pancreatic cancer cell lines were sensitive to M51R-VSV, whereas Panc 03.27 cells remained resistant (81 ± 3% viability 72 h after single-cycle infection). Comparing sensitive MiaPaCa2 cells with resistant Panc 03.27 cells, significant differences in gene expression were found relating to IFN signaling (P = 2 × 10(-5)), viral entry (P = 3 × 10(-4)), and endocytosis (P = 7 × 10(-4)). MiaPaCa2 cells permitted high levels of VSV infection, whereas Panc 03.27 cells were capable of resisting VSV cell entry even at high multiplicities of infection. Extrinsic β-IFN overcame apparent defects in IFN-mediated pathways in MiaPaCa2 cells conferring VSV resistance. In contrast, β-IFN decreased cell viability in Panc 3.27 cells, suggesting intact antiviral mechanisms. VSV-treated xenografts exhibited reduced tumor growth relative to controls in both MiaPaCa2 (1423 ± 345% versus 164 ± 136%; P < 0.001) and Panc 3.27 (979 ± 153% versus 50 ± 56%; P = 0.002) tumors. Significant lymphocytic infiltration was seen in M51R-VSV-treated Panc 03.27 xenografts.

Conclusions: Inhibition of VSV endocytosis and intact IFN-mediated defenses are responsible for M51R-VSV resistance in pancreatic adenocarcinoma cells. M51R-VSV treatment appears to induce antitumor cellular immunity in vivo, which may expand its clinical efficacy.

Keywords: Interferon; Pancreatic adenocarcinoma; Vesicular stomatitis virus; Viral endocytosis; Xenograft.


Figures

Figure 1
Figure 1
Pancreatic cancer cell viability after rwt-VSV or M51R-VSV infection. Cells were infection at indicated multiplicities of infection (MOIs). At 24 and 48 hours post-infection, live cells were quantified by MTS assay. Data are expressed as a percentage of mock-infected cell viability and represent the mean ± standard deviation of at least three independent experiments.
Figure 2
Figure 2
Pancreatic cancer cell infectability using GFP-labeled M51R-VSV (GFP-M51R). Cells were infected with GFP-M51R virus at increasing MOIs (0.1 to 50 pfu/cell). At indicated times post-infection, cells were analyzed for GFP expression by flow cytometry. (A) Representative histograms from MiaPaCa2 cells analyzed 12 hours after infection showing increasing proportions of cells expressing GFP at increasing MOIs. (B) The percentage of pancreatic cancer cells expressing GFP under each condition, expressed as the mean ± standard deviation from three independent experiments.
Figure 3
Figure 3
Viral and host cell protein synthesis in response to rwt-VSV and M51R-VSV infections. After viral infection at an MOI of 5 pfu/cell, cells were labeled with [35S]methionine at specified times. Proteins were analyzed by SDS-PAGE and phosphorescence imaging. In the first column representative phosphorescence images are displayed for each cell line. Standard viral proteins (L, G, N, P, and M) are shown in the first lane in each image as reference. The graphs in the middle column represent viral protein synthesis. In order to compare cell types, the radioactivity of the N protein in each lane was quantified and normalized by dividing the intensity of the N protein band by the intensity of a comparable region in mock-infected cells. In the final column, host cell protein production is quantified by measuring the signal intensity of two sections in each lane between viral protein bands and is presented as a percentage intensity from mock-infected cells. Results for each cell line are presented by row: (A) Panc 1, (B) MiaPaCa2, (C) BxPC3, (D) Panc10.05, and (E) Panc 03.27. Data in the graphs are expressed as the mean of each experimental result ± standard deviation of at least three independent experiments.
Figure 4
Figure 4
The production of β-IFN in response to rwt-VSV and M51R-VSV infection. Pancreatic cancer cells were infected at an MOI of 5 pfu/cell. At indicated times post-infection, small aliquots were removed and the amount of β-IFN (IU/mL/100,000 cells) was measured by enzyme-linked immunosorbent assay. The data are presented as the mean ± standard deviation from three independent experiments.
Figure 5
Figure 5
The responsiveness of Panc1, MiaPaCa2, BxPC3, and Panc10.05 pancreatic cancer cells to β-IFN. Cells were incubated with varying concentrations of β-IFN (0 to 40,000 IU/mL/100,000 cells) for 8 hours and then challenged with rwt-VSV or M51R-VSV (MOI of 5 pfu/cell). Cell viability was measured by MTS assay 48 hours (Panc1, MiaPaCa2 and BxPC3) or 72 hours (Panc10.05) after VSV infection. Data are expressed as the percentage of β-IFN treated, mock-infected cells and presented as the mean ± standard deviation of three independent experiments.
Figure 6
Figure 6
Cytotoxic effect of β-IFN in Panc 03.27 cells the setting of VSV infection. Cells were incubated with varying concentrations of β-IFN (0 to 40,000 IU/mL/100,000 cells) and challenged with rwt-VSV or M51R-VSV (MOI of 5 pfu/cell). Cell viability was measured by MTS assay 48 hours after VSV treatment. Data are expressed as the percentage of VSV-treated cells and presented as the mean ± standard deviation of three independent experiments.
Figure 7
Figure 7
Intratumoral M51R-VSV treatment of pancreatic cancer xenografts derived from VSV-sensitive MiaPaCa2 and VSV-resistant Panc 03.27 cells. Subcutaneous xenografts were established in the right flank of athymic nude mice. Once palpable tumors formed, the mice were randomly assigned to a single intratumoral injection of 1×10⁸ pfu M51R-VSV (n=10) or culture medium as negative controls (n=9). Tumor volume was measured with calipers. Tumor growth is presented as the percentage of tumor size on day 0 post-infection and is expressed as the mean ± standard error of the mean. P-values shown represent the difference in percent change in tumor growth between M51R-VSV treated and mock-treated xenografts at post-treatment day 30.
Figure 8
Figure 8
Histological and immunohistochemical analysis of MiaPaCa2 xenografts. Mock-infected tumors with injected with culture medium. M51R-VSV treated tumors received a single intratumoral injection (1×10⁸ pfu). Tumors were harvested at post-infection day three. Representative sections stained with hematoxylin and eosin (H&E) and immunohistochemical staining for VSV surface glycoprotein (G-protein) are shown from mock-treated and M51R-VSV treated xenografts as indicated.
Figure 9
Figure 9
Histological and immunohistochemical analysis of Panc 03.27 xenografts. Mock-infected tumors with injected with culture medium. M51R-VSV treated tumors received a single intratumoral injection (1×10⁸ pfu). Tumors were harvested three or seven days after treatment as indicated. Representative sections stained with hematoxylin and eosin (H&E) and immunohistochemical staining for VSV surface glycoprotein (G-protein) are shown from mock-treated and M51R-VSV.
Figure 10
Figure 10
H&E staining (A) and immunohistochemical staining of B-cells (B) and NK cells (C) seven days following intratumoral M51R-VSV treatment.

References

    1. Barber GN. Vesicular stomatitis virus as an oncolytic vector. Viral Immunol. 2004;17:516–27. - PubMed
    1. Ahmed M, McKenzie MO, Puckett S, et al. Ability of the matrix protein of vesicular stomatitis virus to suppress beta interferon gene expression is genetically correlated with the inhibition of host RNA and protein synthesis. J Virol. 2003;77:4646–57. - PMC - PubMed
    1. Ahmed M, Lyles DS. Identification of a consensus mutation in M protein of vesicular stomatitis virus from persistently infected cells that affects inhibition of host-directed gene expression. Virology. 1997;237:378–88. - PubMed
    1. Ebert O, Shinozaki K, Huang TG, et al. Oncolytic vesicular stomatitis virus for treatment of orthotopic hepatocellular carcinoma in immune-competent rats. Cancer Res. 2003;63:3605–11. - PubMed
    1. Stewart JH, Ahmed M, Northrup SA, et al. Vesicular stomatitis virus as a treatment for colorectal cancer. Cancer Gene Ther. 2011;18:837–49. - PMC - PubMed

Publication types

MeSH terms