. 2013 Nov 19:2:e01157.
doi: 10.7554/eLife.01157.

Common resting brain dynamics indicate a possible mechanism underlying zolpidem response in severe brain injury

Affiliations

Common resting brain dynamics indicate a possible mechanism underlying zolpidem response in severe brain injury

Shawniqua T Williams et al. Elife. .

Abstract

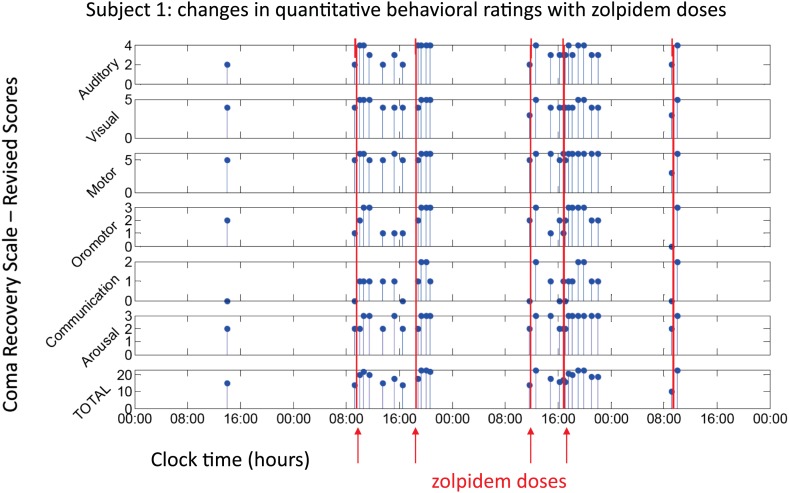
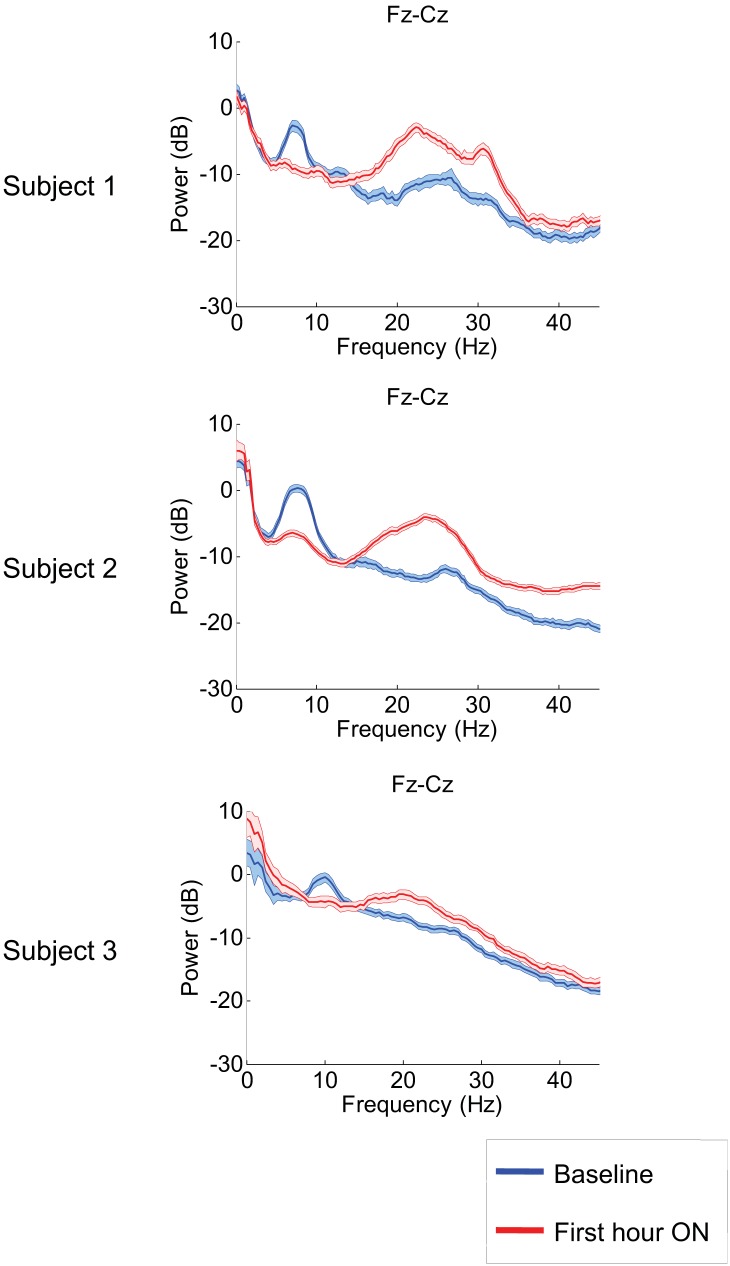
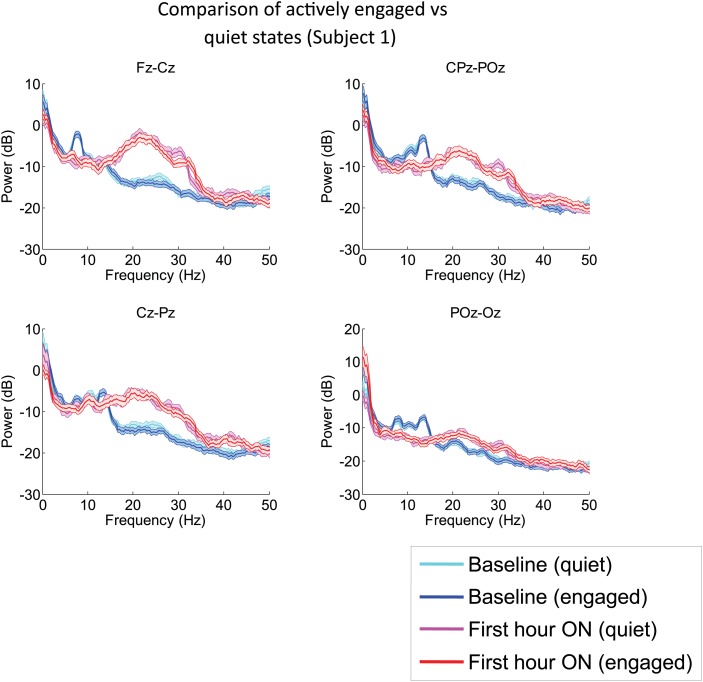
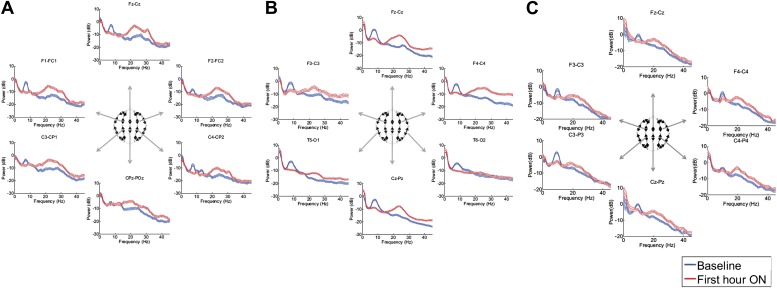
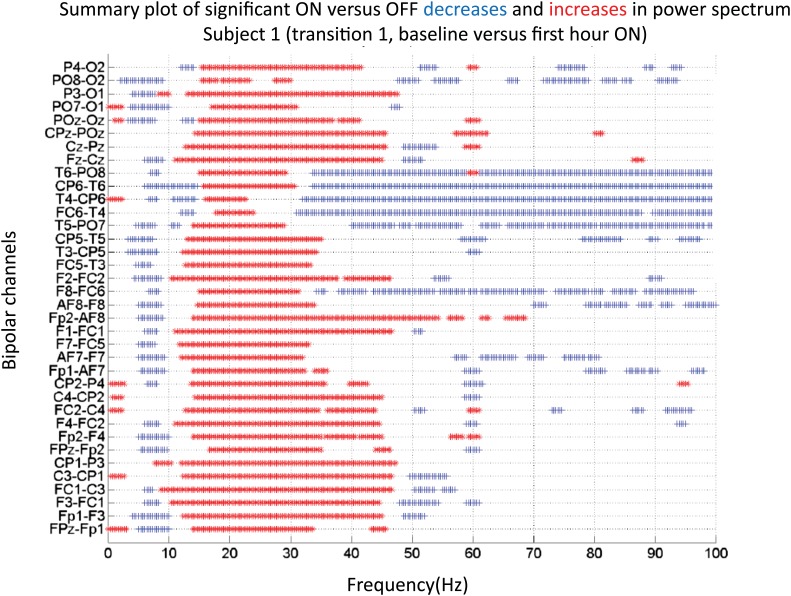
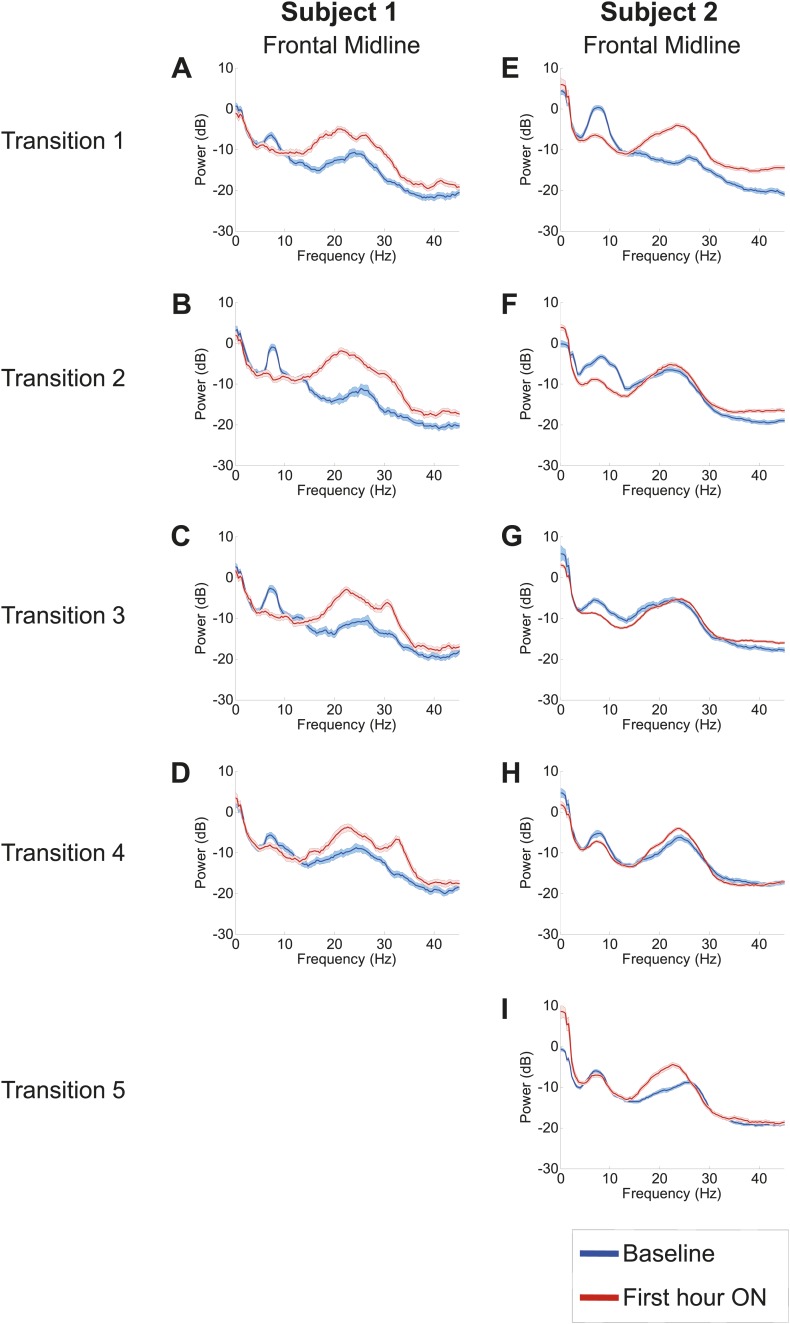
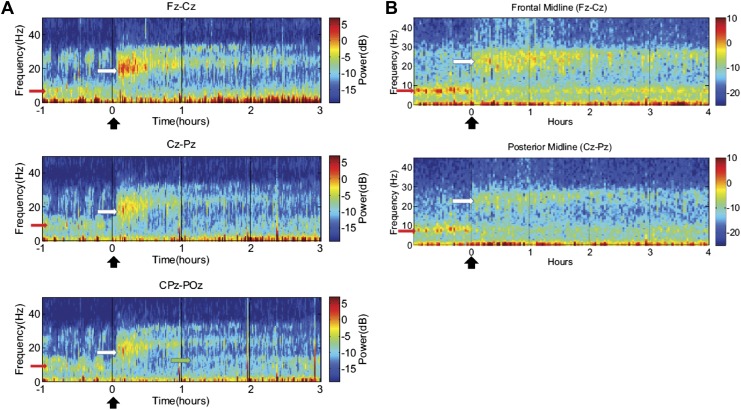
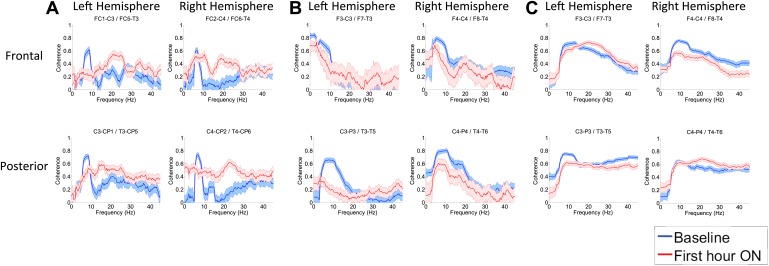
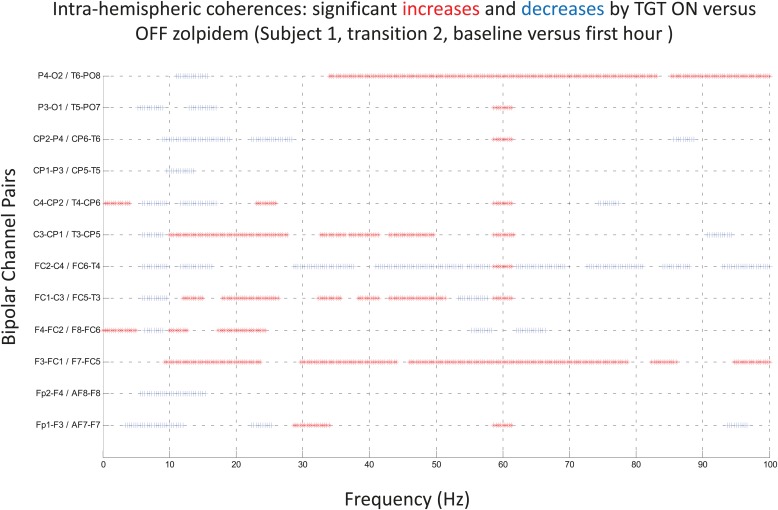
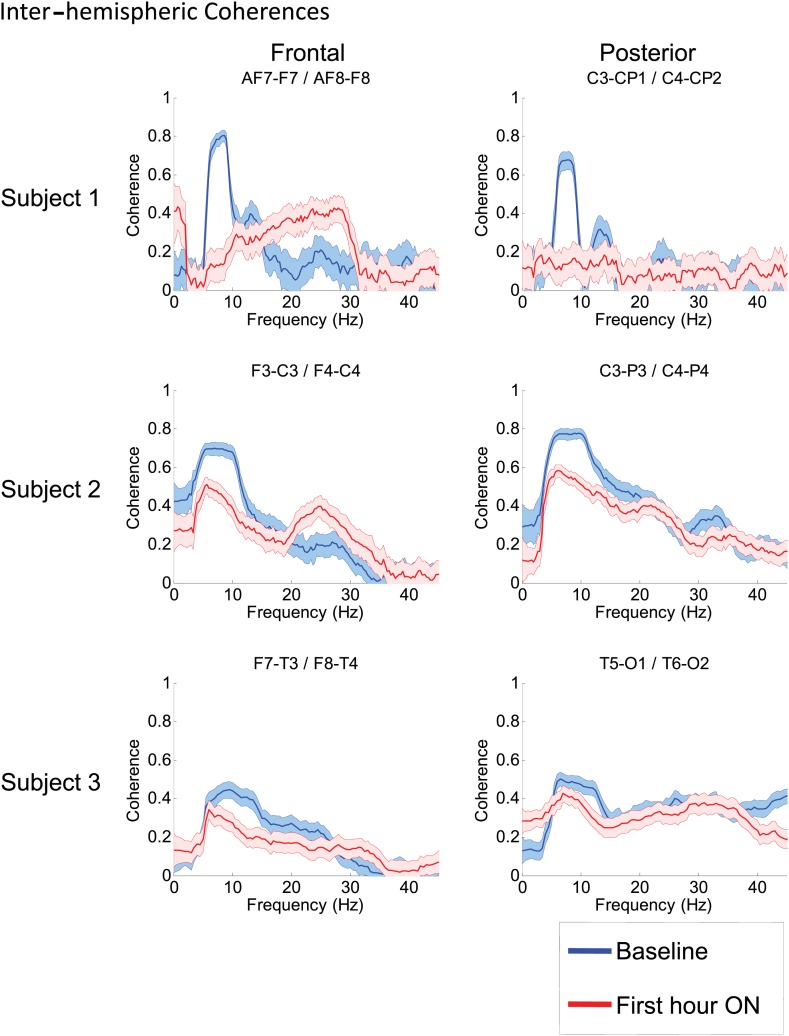
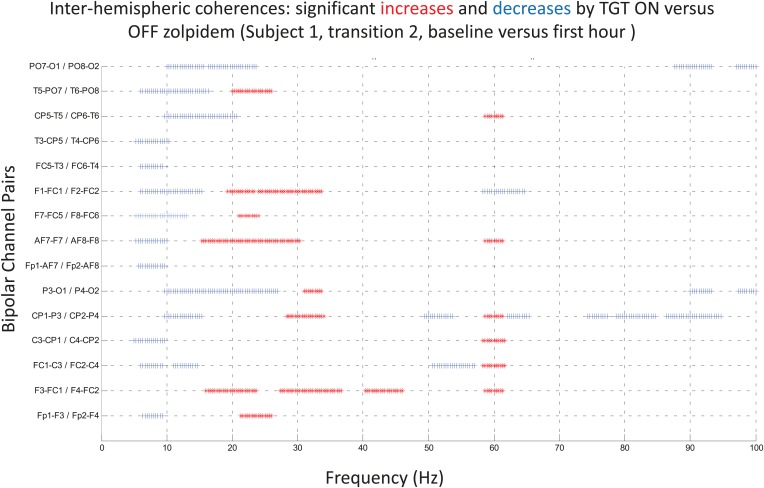
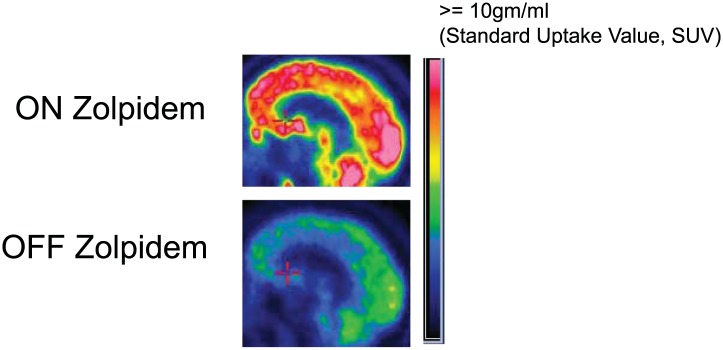
Zolpidem produces paradoxical recovery of speech, cognitive and motor functions in select subjects with severe brain injury but underlying mechanisms remain unknown. In three diverse patients with known zolpidem responses we identify a distinctive pattern of EEG dynamics that suggests a mechanistic model. In the absence of zolpidem, all subjects show a strong low frequency oscillatory peak ∼6-10 Hz in the EEG power spectrum most prominent over frontocentral regions and with high coherence (∼0.7-0.8) within and between hemispheres. Zolpidem administration sharply reduces EEG power and coherence at these low frequencies. The ∼6-10 Hz activity is proposed to arise from intrinsic membrane properties of pyramidal neurons that are passively entrained across the cortex by locally-generated spontaneous activity. Activation by zolpidem is proposed to arise from a combination of initial direct drug effects on cortical, striatal, and thalamic populations and further activation of underactive brain regions induced by restoration of cognitively-mediated behaviors. DOI: http://dx.doi.org/10.7554/eLife.01157.001.

Keywords: Consciousness; GABA-A; anesthesia; arousal; central thalamus; striatum.


Conflict of interest statement

The authors declare that no competing interests exist.

Figures

Figure 1.
Figure 1.. Behavioral changes associated with zolpidem doses in Subject 1.
Subject 1 demonstrated only a limited range of behaviors in the baseline (OFF drug) state including automatic motor responses (e.g., reaching to a hand extended for a handshake, CRS-R motor subscore 5), oro-motor behaviors (e.g., opening mouth when presented with a spoon CRS-R oro-motor subscore 2 or biting a tongue depressor, CRS-R oro-motor subscore 1), localization of sound with head turning (CRS-R auditory subscale score 2), and reaching to objects (CRS-R visual subscale score 4). During all baseline assessments the patient demonstrated no evidence of command following or a communication system (CRS-R communication subscale score 0). Across three assessments of baseline behavior OFF drug after overnight periods and a 62 hr washout period at the onset of the study total CRS-R scores ranged from 10–15 reflecting a lack of goal-directed behaviors, evidence of any communication systems either verbal or gestural, nor consistent response to command following. Across two assessments of baseline behavior at least 4 hr after a prior dose of zolpidem within a day (reflecting typical duration of action of the medication) maximal total CRS-R scores of 18 reflected evidence of command following with inaccurate communication and higher level motor function (CRS-R subscale motor score of 6) or consistent auditory command following (CRS-R auditory subscale score of 4). Compared with these baseline behavioral assessments, consistent achievement of a maximum possible total CRS-R scores of 23 was obtained during all ON drug periods reflecting a state in which the patient consistently demonstrated behavioral levels not captured by this psychometric instrument including recovery of consistent communication, fluent verbal communication, writing and complex organized movements (see ‘Clinical histories’ for further clinical details and additional neuropsychological assessments). As seen in graph, a maximal total CRS-R scores consistently appeared following drug administration within approximately 1 hr and had a variable duration of maintenance with second daily dose of the medication showing extended time periods of maximal total scores. Red arrows indicate zolpidem doses for which accompanying EEG data were available for analyses. Videos 1 and 2 illustrate aspects of the examinations to show correspondence of numerical ratings and behavior. DOI: http://dx.doi.org/10.7554/eLife.01157.003
Figure 2.
Figure 2.. Power spectra estimated from midline EEG channel Fz-Cz recordings.
Power spectra from all three subjects (mean and 95% confidence intervals). Red: average spectral power in the hour prior to each zolpidem dose. Blue: 20–60 min after the zolpidem dose. Narrow, low frequency spectral peaks are apparent in the pre-drug state that are attenuated in the hour post-dose. Beta range peaks (20–30 Hz) are apparent in all post-drug spectra. Changes in ∼6–10 Hz peak between conditions are significant by two-group test (see ‘Methods’; Table 1). DOI: http://dx.doi.org/10.7554/eLife.01157.006
Figure 2—figure supplement 1.
Figure 2—figure supplement 1.. Analysis of EEG segments obtained during ON and OFF drug periods from Subject 1’s second zolpidem administration (cf. Figure 1; Table 1) subdivided according to periods of low and high levels of environmental stimulation, a distinction based on detailed review of the simultaneously recorded video.
‘Quiet’ segments were chosen from periods in which the subject appeared to be resting quietly with eyes open and there was no direct engagement of the subject (verbal engagement or physical manipulation). ‘Engaged’ segments were chosen from periods in which the patient was interactive with investigators at the bedside. EEG channels from the midline are analyzed, as these typically have less movement and muscle artifacts, and thus allow comparison during active engaged periods. The level of environmental interaction (quiet vs engaged) has no effect on either the background or the post-zolpidem spectra. In contrast, marked changes in spectral shape following zolpidem administration (first hour vs baseline) are seen for both quiet and engaged periods. DOI: http://dx.doi.org/10.7554/eLife.01157.007
Figure 3.
Figure 3.. Power spectra (mean and 95% confidence intervals) estimated from selected EEG channel recordings across the head from all three subjects (A, B, and C).
Red: average spectral power in the hour prior to each zolpidem dose. Blue: 20–60 min after the zolpidem dose. Narrow, low frequency spectral peaks are apparent in the pre-drug state that are attenuated in the hour post-dose. Beta range peaks (∼20–30 Hz) are apparent in all post-drug spectra. Changes in ∼6–10 Hz peak between conditions are significant by two-group test (‘Methods’; Table 1). DOI: http://dx.doi.org/10.7554/eLife.01157.010
Figure 3—figure supplement 1.
Figure 3—figure supplement 1.. Significance testing of power across frequencies comparing the OFF and ON zolpidem states for Subject 1, transition 1 (baseline vs first hour) is summarized using two-group test (see ‘Methods’; Bokil et al., 2007 for further methods).
Significant increases in power with zolpidem administration compared to baseline are plotted as red asterisks, significant decreases are plotted as blue asterisks. Comparison of power at different frequencies in the OFF and ON zolpidem states shows that significant suppression of ∼6–10 Hz coherence is evident across a majority of channels with administration of zolpidem. DOI: http://dx.doi.org/10.7554/eLife.01157.011
Figure 4.
Figure 4.. Power spectra from midline channels for subjects 1 and 2 across multiple transitions from a washout baseline to ON drug state.
Eyes open, awake epochs selected from one hour prior to 1 hr subsequent to each dose (Red) are shown and compared to 20–60 min after the zolpidem dose (Blue). Changes in ∼6–10 Hz peak between conditions are significant by two-group test (Tables 1 and 2). DOI: http://dx.doi.org/10.7554/eLife.01157.012
Figure 5.
Figure 5.. Time-frequency analysis of selected EEG channels from Subject 1 (A) and Subject 2 (B).
Frontal and posterior midline channels, for both subjects demonstrate a low frequency peak in power (red arrows) during the hour prior to zolpidem administration attenuates within the first 10–15 min after the drug is given. This corresponds to the time period when the subject begins to manifest improved behavioral function. Concomitant with the attenuation of the low frequency peak, there appears a broader ∼15–25 Hz peak during the 30 min after the drug is given (white arrows), which narrows and reduces attenuates slowly over the next 2–3 hr. In Subject 1 (A), a ∼10 Hz peak appears approximately 1 hr into the post-dose period in CPz-POz channel (green arrow). DOI: http://dx.doi.org/10.7554/eLife.01157.013
Figure 6.
Figure 6.. (A). Intra-hemispheric coherences (subject 1).
Pre-drug coherence peaks at 6–10 Hz. This peak is attenuated in the hour after the drug is given. Changes in ∼6–10 Hz peak between conditions are significant by two-group test (‘Methods’; Figure 6 Figure Supplement 1). (B) (subject 2). Intra-hemispheric coherences (subject 2). Pre-drug coherence peaks are evident at ∼ 6–10 Hz. This peak is attenuated in the hour after the drug is given. (C) (subject 3). Intra-hemispheric coherences (subject 3). Pre-drug coherence peaks at ∼ 6–10 Hz. This peak is attenuated in the hour after the drug is given. DOI: http://dx.doi.org/10.7554/eLife.01157.014
Figure 6—figure supplement 1.
Figure 6—figure supplement 1.. Significance testing of intra-hemispheric coherences for Subject 1, transition 2 (baseline vs first hour) is summarized using two-group test (see ‘Methods’; Bokil et al., 2007 for further methods).
Significant increases in coherence with zolpidem administration compared to baseline are plotted as red asterisks, significant decreases are plotted as blue asterisks. Comparison of coherence in the OFF and ON zolpidem states shows that significant suppression of ∼6–10 Hz coherence is evident across a majority of intra-hemispheric channel pairs with administration of zolpidem. DOI: http://dx.doi.org/10.7554/eLife.01157.015
Figure 7.
Figure 7.. Inter-hemispheric coherences all three subjects.
Pre-drug coherence peaks at 6–10 Hz are seen in frontal and posterior channels comparisons for all subjects. This peak is attenuated in the hour after the drug is given. Changes in ∼6–10 Hz peak between conditions are significant by two-group test (see ‘Methods’; Figure 7—figure supplement 1, for Subject 1 coherences for example of coherence changes across all channel pairs in single dose). DOI: http://dx.doi.org/10.7554/eLife.01157.016
Figure 7—figure supplement 1.
Figure 7—figure supplement 1.. Significance testing of inter-hemispheric coherences for Subject 1, transition 2 (baseline vs first hour) is summarized using two-group test (see ‘Methods’; Bokil et al., 2007 for further methods).
Significant increases in coherence with zolpidem administration compared to baseline are plotted as red asterisks, significant decreases are plotted as blue asterisks. Comparison of coherence in the OFF and ON zolpidem states shows that significant suppression of ∼6–10 Hz coherence is evident across a majority of inter-hemispheric channel pairs with administration of zolpidem. DOI: http://dx.doi.org/10.7554/eLife.01157.017
Figure 8.
Figure 8.. FDG-PET measured cerebral metabolism OFF and ON zolpidem for Subject 2.
A marked increase in global cerebral metabolic rate is seen with zolpidem administration, average increase is 1.97 times OFF baseline across cerebral structures (see ‘Methods’ and Table 3 for regional differences in metabolic rates for selected areas). DOI: http://dx.doi.org/10.7554/eLife.01157.018

Comment in

  • Awakened by a sleeping pill.
    Akeju O, Brown EN. Akeju O, et al. Elife. 2013 Nov 19;2:e01658. doi: 10.7554/eLife.01658. Elife. 2013. PMID: 24252876 Free PMC article.

Similar articles

Cited by

References

    1. Adams JH, Graham DI, Jennett B. 2000. The neuropathology of the vegetative state after acute insult. Brain 123:1327–38.10.1093/brain/123.7.1327 - DOI - PubMed
    1. Bokil H, Purpura K, Schoffelen JM, Thomson D, Mitra P. 2007. Comparing spectra and coherences for groups of unequal size. J Neurosci Methods 159:337–45.10.1016/j.jneumeth.2006.07.011 - DOI - PubMed
    1. Brefel-Courbon C, Payoux P, Ory F, Sommet A, Slaoui T, Raboyeau G, et al. 2007. Clinical and imaging evidence of zolpidem effect in hypoxic encephalopathy. Ann Neurol 62:102–5.10.1002/ana.21110 - DOI - PubMed
    1. Brown EN, Lydic R, Schiff ND. 2010. General anesthesia, sleep and coma. N Engl J Med 363:2638.10.1056/NEJMra0808281 - DOI - PMC - PubMed
    1. Ching S, Cimenser A, Purdon PL, Brown EN, Kopell NJ. 2011. Thalamocortical model for a propofol-induced alpha-rhythm associated with loss of consciousness. Proc Natl Acad Sci USA 107:22665–70.10.1073/pnas.1017069108 - DOI - PMC - PubMed

Publication types