. 2013 Nov 19:2:e01345.
doi: 10.7554/eLife.01345.

Three-dimensional electron crystallography of protein microcrystals

Affiliations

Three-dimensional electron crystallography of protein microcrystals

Dan Shi et al. Elife. .

Abstract

We demonstrate that it is feasible to determine high-resolution protein structures by electron crystallography of three-dimensional crystals in an electron cryo-microscope (CryoEM). Lysozyme microcrystals were frozen on an electron microscopy grid, and electron diffraction data collected to 1.7 Å resolution. We developed a data collection protocol to collect a full-tilt series in electron diffraction to atomic resolution. A single tilt series contains up to 90 individual diffraction patterns collected from a single crystal with tilt angle increment of 0.1-1° and a total accumulated electron dose less than 10 electrons per angstrom squared. We indexed the data from three crystals and used them for structure determination of lysozyme by molecular replacement followed by crystallographic refinement to 2.9 Å resolution. This proof of principle paves the way for the implementation of a new technique, which we name 'MicroED', that may have wide applicability in structural biology. DOI: http://dx.doi.org/10.7554/eLife.01345.001.

Keywords: electron cryomicroscopy (cryo-EM); electron crystallography; electron diffraction; microED; microcrystals; protein structure.


Conflict of interest statement

The authors declare that no competing interests exist.

Figures
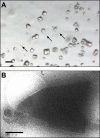
Figure 1.
Figure 1.. Images of lysozyme microrystals.
(A) Light micrograph showing lysozyme microcrystals (three examples indicated by arrows) in comparison with larger crystals of the size normally used for X-ray crystallography. Scale bar is 50 μm. (B) Lysozyme microcrystals visualized in over-focused diffraction mode on the cryo-EM prior to data collection. The length and width of the crystals varied from 2 to 6 µm with an estimated thickness of ∼0.5–1 µm. Scale bar is 1 µm. DOI: http://dx.doi.org/10.7554/eLife.01345.003
Figure 2.
Figure 2.. Resolution and data quality of lysozyme microcrystals.
(A) Analysis of the effects of crystal thickness on maximum resolution of observed reflections from thick crystals. The analysis shows adverse effects of crystal thickness on the obtainable resolution as large crystals are tilted. (B) For assessing the quality of our cryo preparations, diffraction data were obtained from 100 lysozyme microcrystals. 43/100 were thin crystals that showed reflections in the 2–4 Å range, with the best crystal in this set yielding data to ∼1.7 Å resolution. (C) An example of lysozyme diffraction data collected at 0.01e2/second and a 10 s exposure. The pattern shows strong and sharp spots surpassing 2 Å resolution. This diffraction pattern was processed with ImageJ and despeckled for ease of viewing. (D) Analysis of the effects of crystal thickness on maximum resolution of observed reflections from thin crystals. The small crystal shows a relatively constant maximum resolution that does not appear to be affected by crystal tilt. DOI: http://dx.doi.org/10.7554/eLife.01345.004
Figure 3.
Figure 3.. Effects of cumulative electron dose on diffraction data quality.
A single lysozyme microcrystal was subjected to 120 sequential exposures without tilting, each of a dose of ∼0.1 e2 for a total accumulated dose of ∼12 e2. Normalized intensity vs total accumulated dose for three diffraction spots observed over all 120 sequential frames was plotted. A decrease in diffraction intensity becomes apparent at a dosage of ∼9 e2 (‘critical dose’). Bars represent standard error of the mean. DOI: http://dx.doi.org/10.7554/eLife.01345.005
Figure 4.
Figure 4.. Prediction of reflections and indexing in the diffraction patterns.
(A and B) Two examples of diffraction patterns obtained from a single crystal at tilt angles of 0° and 20° respectively. Locations indicated by circles were predicted to contain diffraction spots by our spot prediction algorithm. Additional examples from the same crystal are presented in Video 2. The resolution limit was set at 2.9 Å resolution for this study. DOI: http://dx.doi.org/10.7554/eLife.01345.007
Figure 5.
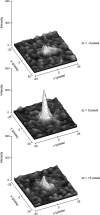
Figure 5.. Three-dimensional profiles of the intensity of a single reflection over three consecutive diffraction patterns at −0.1°, 0°, and 0.1° degree tilts.
The plots show the approximate dimensions of the full reflection with a width (full width at half maximum height) of 3–5 pixels in the x, y, and z direction. DOI: http://dx.doi.org/10.7554/eLife.01345.009
Figure 6.
Figure 6.. Results of phasing by molecular replacement prior to crystallographic refinement.
Molecular replacement was performed with both the full model of lysozyme (PDB 4AXT, top panels) as well as a poly-alanine model (bottom panels) and the resulting 2Fobs−Fcalc maps around residues 1–20 are shown. (A and B) The phases following molecular replacement with the full model were of good quality demonstrated by how well the density surrounding the model fits, even before any refinement is performed. (C) A composite-omit map calculated by omitting 5% at a time showed good agreement with the unrefined structure indicating the phases were not dominated by model bias. (DF) As an additional test of model bias, phasing was done with a poly-alanine homology search model of lysozyme. The resulting 2Fobs−Fcalc map is of good quality (D) and shows density extending beyond the poly-alanine model (E and F, arrows). (F) The same density map as E but with the structure of lysozyme fit. Arrows in D and E show examples of clear side chain density from the poly-alanine map. All maps are contoured at 1.0σ. DOI: http://dx.doi.org/10.7554/eLife.01345.012
Figure 7.
Figure 7.. MicroED structure of lysozyme at 2.9 Å resolution.
(A) The 2Fobs−Fcalc (contoured at 1.5σ) map covers protein residues 5–45 of lysozyme. (B) Fobs−Fcalc difference map contoured at +3.0σ (green) and −3.0σ (red) for the same protein region. The map (A) shows well-defined density around the vast majority of side chains and the difference map (B) shows no large discrepancies between the observed data (Fobs) and the model (Fcalc). The final structure of lysozyme is shown in panel C and the complete three-dimensional map is presented in Video 3. DOI: http://dx.doi.org/10.7554/eLife.01345.013
Figure 8.
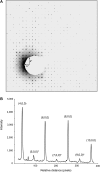
Figure 8.. Dynamic scattering in lysozyme 3D crystals.
Intensity measurement along the a* axis of a raw diffraction pattern illustrating the relatively small contributions due to dynamic scattering. (A) Diffraction pattern from the major plane of a lysozyme crystal with visible intensity in the (2n+1,0,0) and (0,2n+1,0) Miller indices. (B) (2n+1, 0, 0) reflections (starred) are expected to be systematically absent and observed intensities at these indices are assumed to be the result of dynamic scattering. Image contrast was enhanced for clarity using ImageJ. DOI: http://dx.doi.org/10.7554/eLife.01345.017

Comment in

Similar articles

Cited by

References

    1. Adams PD, Afonine PV, Bunkoczi G, Chen VB, Davis IW, Echols N, et al. 2010. PHENIX: a comprehensive Python-based system for macromolecular structure solution. Acta Crystallogr D Biol Crystallogr 66:213–21. 10.1107/S0907444909052925 - DOI - PMC - PubMed
    1. Babu YS, Bugg CE, Cook WJ. 1988. Structure of calmodulin refined at 2.2 A resolution. J Mol Biol 204:191–204. 10.1016/0022-2836(88)90608-0 - DOI - PubMed
    1. Baker LA, Smith EA, Bueler SA, Rubinstein JL. 2010. The resolution dependence of optimal exposures in liquid nitrogen temperature electron cryomicroscopy of catalase crystals. J Struct Biol 169:431–7. 10.1016/j.jsb.2009.11.014 - DOI - PubMed
    1. Blake CC, Fenn RH, North AC, Phillips DC, Poljak RJ. 1962. Structure of lysozyme. A Fourier map of the electron density at 6 angstrom resolution obtained by x-ray diffraction. Nature 196:1173–6. 10.1038/1961173a0 - DOI - PubMed
    1. Blake CC, Koenig DF, Mair GA, North AC, Phillips DC, Sarma VR. 1965. Structure of hen egg-white lysozyme. A three-dimensional Fourier synthesis at 2 Angstrom resolution. Nature 206:757–61. 10.1038/206757a0 - DOI - PubMed

Publication types

MeSH terms