. 2013 Dec 27;288(52):37319-31.
doi: 10.1074/jbc.M113.492793. Epub 2013 Nov 19.

Proteinase-activated receptor-2 transactivation of epidermal growth factor receptor and transforming growth factor-β receptor signaling pathways contributes to renal fibrosis

Affiliations

Proteinase-activated receptor-2 transactivation of epidermal growth factor receptor and transforming growth factor-β receptor signaling pathways contributes to renal fibrosis

Hyunjae Chung et al. J Biol Chem. .

Abstract

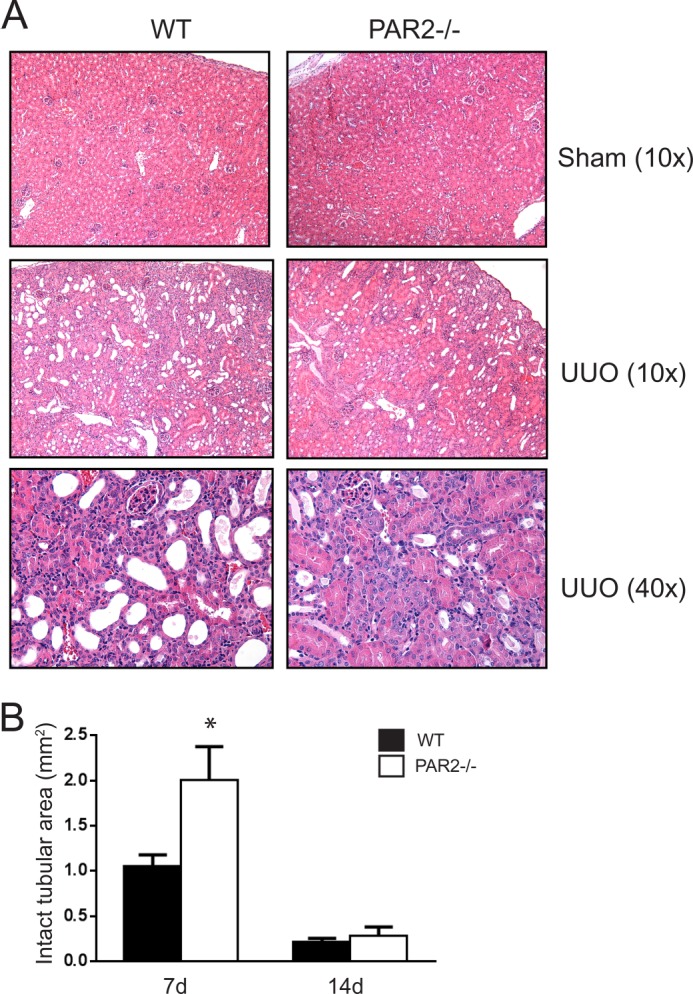
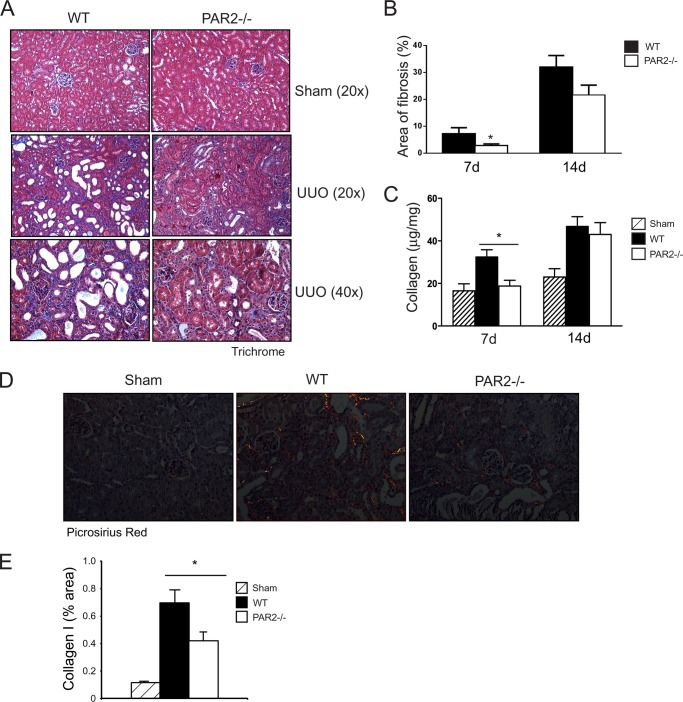
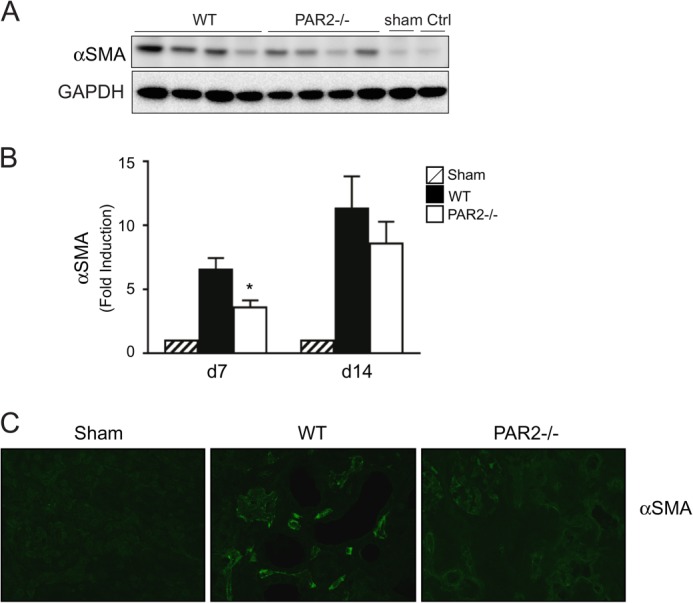
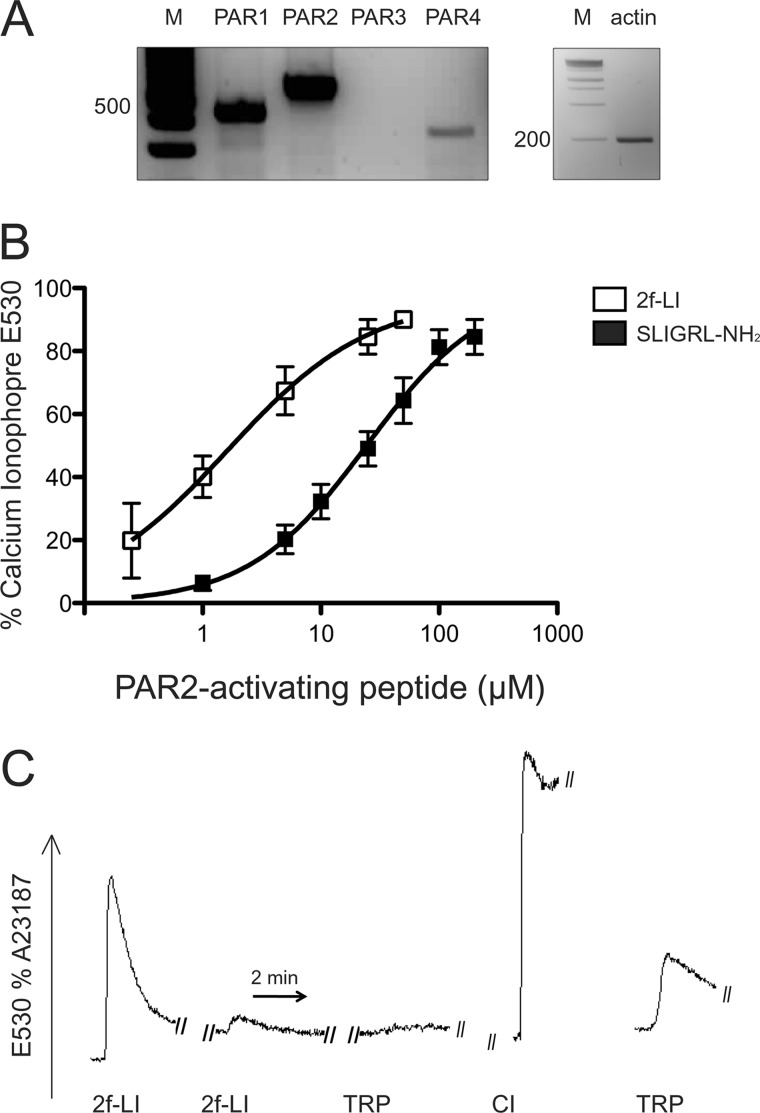
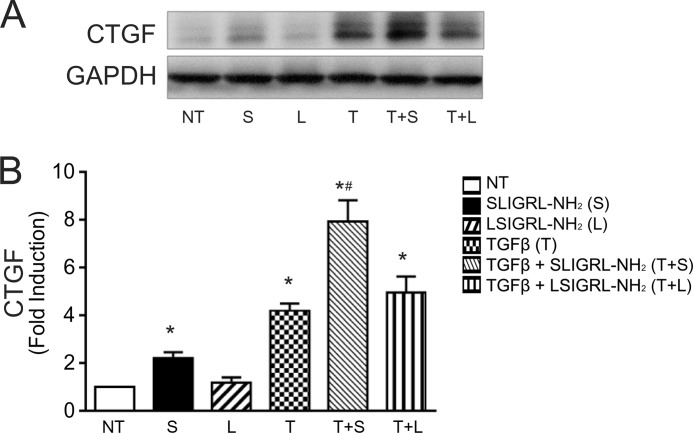
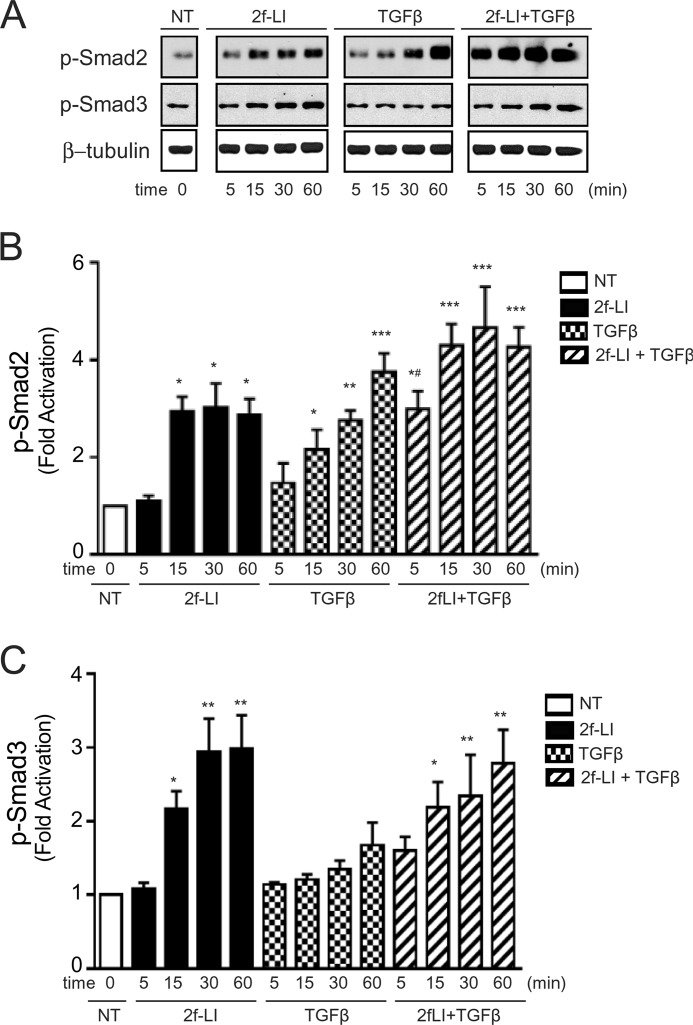
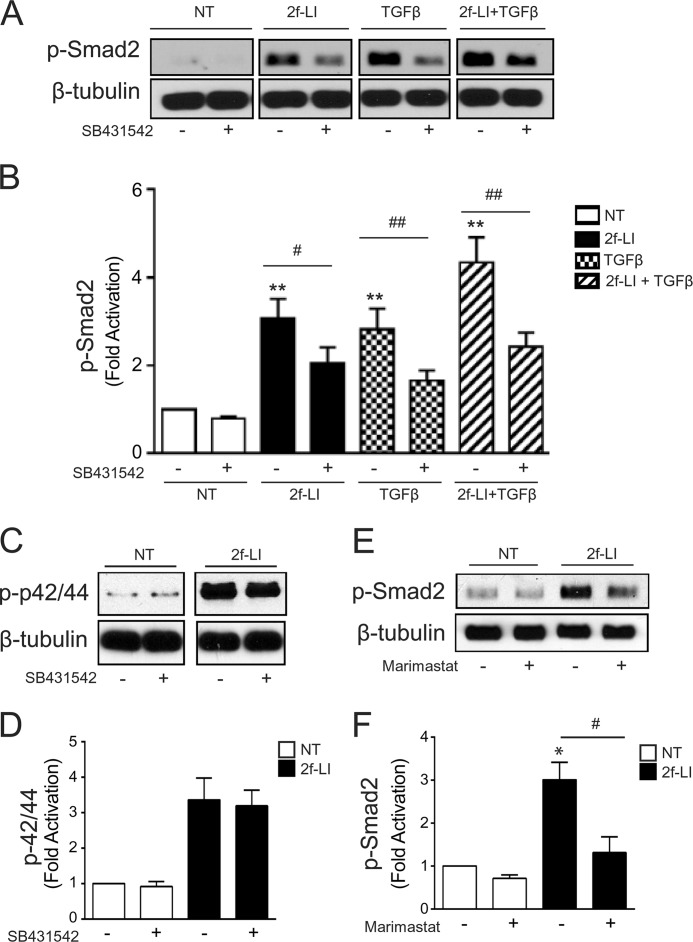
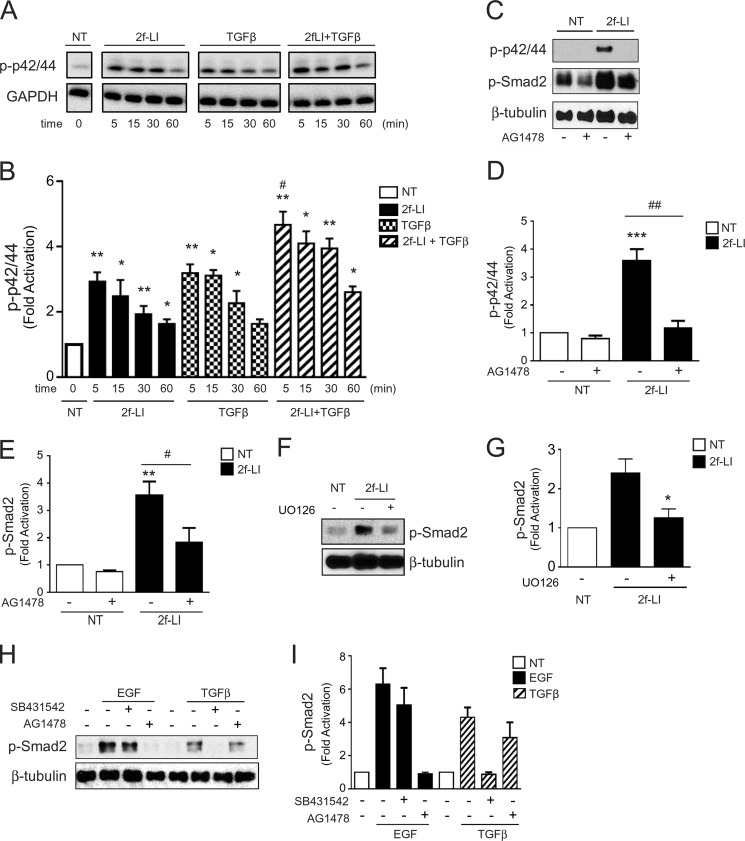
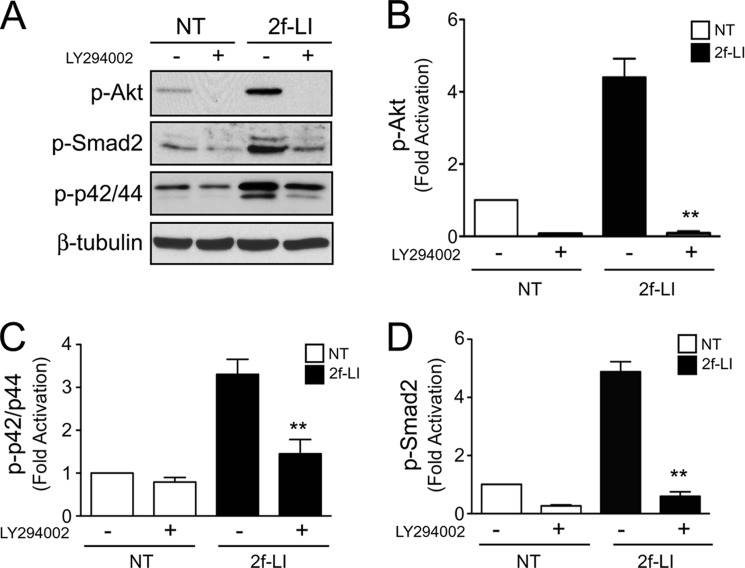
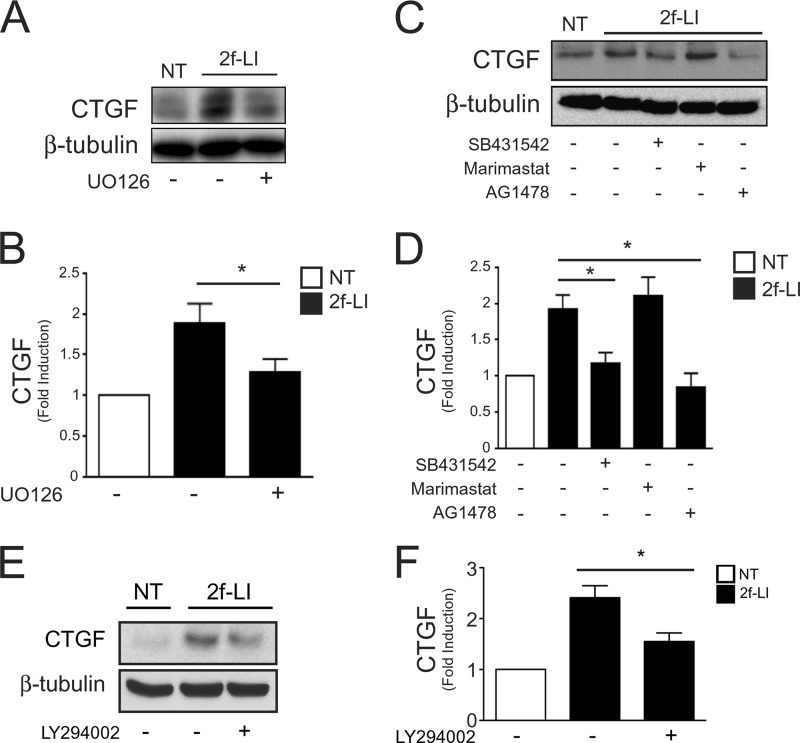
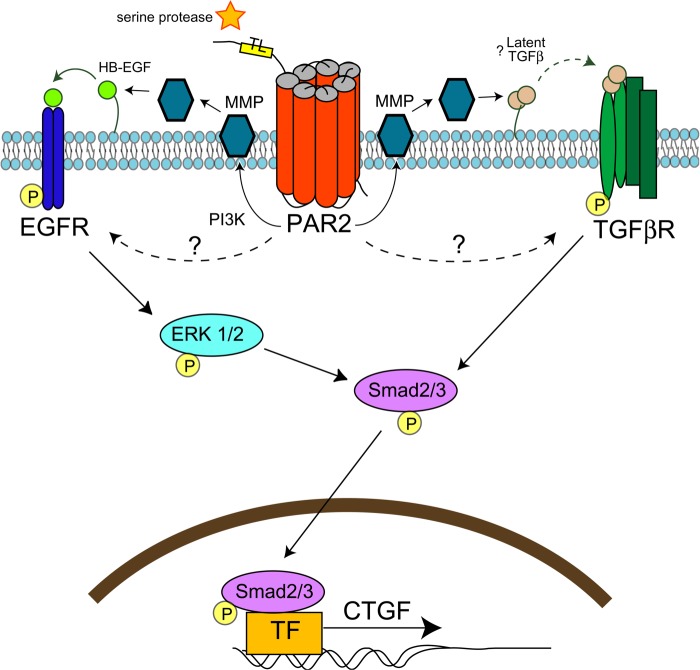
Chronic kidney diseases cause significant morbidity and mortality in the population. During renal injury, kidney-localized proteinases can signal by cleaving and activating proteinase-activated receptor-2 (PAR2), a G-protein-coupled receptor involved in inflammation and fibrosis that is highly expressed in renal tubular cells. Following unilateral ureteric obstruction, PAR2-deficient mice displayed reduced renal tubular injury, fibrosis, collagen synthesis, connective tissue growth factor (CTGF), and α-smooth muscle actin gene expression at 7 days, compared with wild-type controls. In human proximal tubular epithelial cells in vitro, PAR2 stimulation with PAR2-activating peptide (PAR2-AP) alone significantly up-regulated the expression of CTGF, a potent profibrotic cytokine. The induction of CTGF by PAR2-AP was synergistically increased when combined with transforming growth factor-β (TGF-β). Consistent with these findings, treating human proximal tubular epithelial cells with PAR2-AP induced Smad2/3 phosphorylation in the canonical TGF-β signaling pathway. The Smad2 phosphorylation and CTGF induction required signaling via both the TGFβ-receptor and EGF receptor suggesting that PAR2 utilizes transactivation mechanisms to initiate fibrogenic signaling. Taken together, our data support the hypothesis that PAR2 synergizes with the TGFβ signaling pathway to contribute to renal injury and fibrosis.

Keywords: Epidermal Growth Factor Receptor (EGFR); Fibrosis; Kidney; PAR2; Receptors; Transforming Growth Factor β (TGFβ).


Figures

FIGURE 1.
FIGURE 1.
UUO-induced kidney injury in wild-type and PAR2−/− mice. A, representative histopathology images (H & E staining) for each group at day 7 post-UUO. B, histogram showing quantification of morphologically intact tubular areas in PAR2−/− and wild-type mice at days 7 and 14 post-UUO (mean ± S.E.; *, p < 0.05, n = 4 - 8).
FIGURE 2.
FIGURE 2.
UUO-induced renal fibrosis in wild-type and PAR2−/− mice. A, representative histopathology images (Masson trichrome staining) for each group at day 7 post-UUO. B, histogram showing quantification fibrotic (blue) areas in wild-type and PAR2−/− mice at days 7 and 14 post-UUO (mean ± S.E.; *, p < 0.05, n = 4–8). C, histogram showing quantification of pepsin and acid-soluble collagens measured by collagen assay in the UUO-induced kidneys for each group (mean ± S.E.; *, p < 0.05, n = 4–8). D, representative images showing red/yellow birefriengence specific for type I collagen deposition in kidney sections for each group stained with picrosirius red at day 7 post-UUO. E, histogram showing quantification of birefringent type I collagen expression normalized to tissue area as percentage in each group (mean ± S.E.; *, p < 0.05, n = 8).
FIGURE 3.
FIGURE 3.
α-SMA expression in UUO-induced kidney injury. A, immunoblotting for α-SMA expression in kidneys from obstructed wild-type and PAR2−/−, at day 7 post-UUO. Sham operated and contralateral kidneys are used as controls. B, histogram showing densitometry analysis of α-SMA expression normalized to GAPDH in wild type or PAR2−/− kidneys at days 7 and 14 post-UUO (mean ± S.E.; *, p < 0.05, n = 4–8). C, representative image showing kidney α-SMA expression detected by immunofluorescence for each group at day 7 post-UUO.
FIGURE 4.
FIGURE 4.
Fibrosis markers in UUO-induced kidney injury. A, immunoblotting for E-cadherin expression and Smad2 phosphorylation in the wild-type and PAR2−/− kidneys at day 7 post-UUO. B, histogram showing the relative expression of E-cadherin in the UUO-induced kidney injury in each group (mean ± S.E.; *, p < 0.05, n = 8). C, mRNA expression assessed by quantitative real-time PCR for Ctgf and D, Tgfb1 in the UUO-induced kidney injury at day 7 in the wild-type and PAR2−/− mice (fold-change over contralateral kidney, mean ± S.E.; *, p < 0.05; **, p < 0.01, n = 8).
FIGURE 5.
FIGURE 5.
Functional expression of PAR2 in HPTC. A, PAR (1, 2, and 4) (F2R, F2RL1, and F2RL3) mRNA expression detected by reverse transcriptase PCR in HPTC (m = marker). B, change in intracellular calcium mobilization in response to different concentrations of PAR2-activating peptides, SLIGRL-NH2, and 2f-LI in HPTCs. Cells were loaded with Fluo-4 AM-NW and exposed to PAR2-AP. Change in internal calcium is expressed as a percentage of the maximum response generated by calcium ionophore (mean ± S.E., n = 3). C, representative image showing the mobilization of internal calcium by mast cell tryptase via PAR2 activation. Cells were loaded with Fluo-4 AM-NW and challenged by two sequential additions of 2f-LI (25 μm) to desensitize PAR2 and followed by mast cell tryptase (4 units/ml). The right-hand tracing showing the response of untreated cells to mast cell tryptase without prior exposure to 2f-LI (2f-LI = 2f-LIGRLO-NH2; TRP, mast cell tryptase; CI, calcium ionophore).
FIGURE 6.
FIGURE 6.
CTGF up-regulation by PAR2 activation in HPTC. A, immunoblotting for CTGF in HPTC following treatment with SLIGRL-NH2 (100 μm) in the presence or absence of TGFβ1 (2.5 ng/ml) for 24 h. PAR2 inactive peptide (LSIGRL-NH2, 100 μm) was used as a control. B, histogram showing densitometry analysis of CTGF expression normalized to GAPDH (NT, no treatment; S, SLIGRL-NH2; L, LSIGRL-NH2; T, TGFβ) (mean ± S.E.; treatment group versus no treatment, *, p < 0.05; SLIGRL-NH2 versus TGFβ + SLIGRL-NH2, #, p < 0.05, n = 3).
FIGURE 7.
FIGURE 7.
PAR2-induced Smad2/3 phosphorylation in HPTCs. A, immunoblotting for Smad2 and Smad3 phosphorylation in HPTC. Cells were treated with 2f-LI (15 μm), TGFβ1 (2.5 ng/ml), or both for 5, 15, 30, and 60 min (NT, no treatment). B, histograms showing densitometry analysis and quantification of PAR2-induced Smad2 and C, Smad3 phosphorylation normalized to β-tubulin (all panels mean ± S.E.; treatment versus NT, *, p < 0.05; **, p < 0.01; ***, p < 0.001; 2f-LI or TGFβ versus 2f-LI + TGFβ at 5 min, #, p < 0.05, n = 3).
FIGURE 8.
FIGURE 8.
Transactivation of the TGFβR by PAR2. A, immunoblotting for Smad2 phosphorylation following stimulation with 2f-LI and/or TGFβ1 (2.5 ng/ml) for 30 min in the presence or absence of the TGFβRI inhibitor, SB431542 (10 μm) (NT, no treatment). B, histogram showing densitometry analysis and quantification of Smad2 phosphorylation (mean ± S.E.; treatment versus NT, **, p < 0.01; treatment versus treatment + SB431542; #, p < 0.05; ##, p < 0.01, n = 3). C, immunoblotting for phosphorylated p42/44 MAPK following stimulation with 2f-LI for 30 min in the presence or absence of SB431542 (10 μm). D, histogram showing densitometry analysis and quantification of PAR2-induced p42/44 MAPK phosphorylation in the presence or absence of SB431542 (10 μm) (mean ± S.E.; 2f-LI versus 2f-LI + SB431542, p = NS, n = 3). E, immunoblotting for phosphorylated Smad2 following stimulation with 2f-LI for 30 min in the presence or absence of marimastat (5 μm). F, histogram showing densitometry analysis of Western blot images to quantify Smad2 phosphorylation in the presence of marimastat after PAR2 activation (mean ± S.E.; 2f-LI versus NT, *, p < 0.05; 2f-LI versus 2f-LI + marimastat; #, p < 0.05, n = 3).
FIGURE 9.
FIGURE 9.
Transactivation of the EGFR by PAR2. A, immunoblotting for p42/44 MAPK phosphorylation following stimulation with 2f-LI and/or TGFβ1 (2.5 ng/ml) for 5, 15, 30, and 60 min. B, histogram showing densitometry analysis and quantification of p42/44 MAPK phosphorylation normalized to GAPDH (immunoblotting) induced by PAR2 and/or TGFβ (mean ± S.E.; treatment group versus no treatment, *, p < 0.05; **, p < 0.01; TGFβ + 2f-LI versus 2f-LI or TGFβ alone; #, p < 0.05, n = 3). C, immunoblotting for PAR2-mediated p42/44 MAPK and Smad-2 phosphorylation in the presence or absence of the EGFR kinase inhibitor, AG1478 (1 μm). D, histogram showing densitometry analysis and quantification of PAR2-mediated p42/44 MAPK and E, Smad2 phosphorylation normalized to β-tubulin in the presence or absence of the EGFR kinase inhibitor, AG1478 (mean ± S.E.; p42/44 or Smad2 phosphorylation 2f-LI versus NT, **, p < 0.01; ***, p < 0.001; p42/44 or Smad2 phosphorylation 2f-LI versus 2f-LI + AG1478, #, p < 0.05; ##, p < 0.01, n = 3). F, immunoblotting for Smad2 phosphorylation following stimulation with 2f-LI in the presence or absence of the MEK1 inhibitor, UO126 (10 μm). G, histogram showing densitometry analysis and quantification of PAR2-induced Smad2 phosphorylation normalized to β-tubulin in the presence or absence of UO126 (mean ± S.E.; 2f-LI versus 2f-LI + UO126, *, p < 0.05, n = 3). H, immunoblotting for phosphorylated Smad2 following stimulation with TGFβ1 and EGF, in the presence or absence of AG1478 or SB431542. I, histogram showing densitometry analysis and quantification of phosphorylated Smad2 normalized to β-tubulin in the presence or absence of SB431542 and AG1478 (mean ± S.E., EGF- or TGFβ-induced P-Smad2 versus SB431542 or AG1478, respectively, p = NS, n = 3).
FIGURE 10.
FIGURE 10.
PI3K activation by PAR2. A, immunoblotting for PAR2-mediated Akt, Smad2, and p42/44 MAPK phosphorylation following stimulation with 2f-LI in the presence or absence of the PI3K inhibitor, LY294002 (20 μm). B, histogram showing densitometry analysis and quantification of phosphorylated Akt; C, Smad2; and D, p42/44 MAPK normalized to β-tubulin following stimulation with 2f-LI in the presence or absence of LY294002 (NT, no treatment; all panels mean ± S.E.; 2f-LI versus 2f-LI + LY294002, **, p < 0.01, n = 3).
FIGURE 11.
FIGURE 11.
Role of EGF and TGFβ receptors in PAR2-induced CTGF expression. A, immunoblotting for CTGF following PAR2 activation for 24 h in the presence or absence of the MEK1 inhibitor, UO126 (10 μm). B, histogram showing densitometry analysis and quantification of PAR2-induced CTGF expression (immunoblotting) (mean ± S.E.; 2f-LI versus 2f-LI + UO126, *, p < 0.05, n = 3). C, immunoblotting for CTGF following PAR2 activation for 24 h in the presence or absence of SB431542 (10 μm), marimastat (5 μm), and AG1478 (1 μm). D, histogram showing densitometry analysis and quantification of CTGF expression (immunoblotting) following PAR2 activation in the presence of various inhibitors (mean ± S.E.; 2f-LI versus 2f-LI + SB431542 or AG1478, *, p < 0.05, n = 3; 2f-LI versus 2f-LI + marimastat, p = NS). E, immunoblotting for CTGF following PAR2 activation for 24 h in the presence or absence of LY294002 (20 μm). F, histogram showing densitometry analysis and quantification of CTGF expression (immunoblotting) following PAR2 activation in the presence of the PI3K inhibitor (NT, no treatment; mean ± S.E., 2f-LI versus 2f-LI + LY294002, *, p < 0.05, n = 3).
FIGURE 12.
FIGURE 12.
Model for PAR2-mediated transactivation of EGF and TGFβ receptors and CTGF expression. During injury, serine proteinases cleave PAR2 tethered ligand resulting in receptor activation. PAR2 transactivates both EGF and TGFβ-receptors in part via PI3K and/or MMPs, which may activate HB-EGF or latent TGFβ. TGFβ receptor activation results in Smad2 phosphorylation. EGF receptor transactivation results in MAP kinase signaling, which enhances Smad2 phosphorylation. Activated Smad2 translocates to the nucleus to up-regulate the expression of CTGF and other pro-fibrotic genes. Redundant pathways of PAR2-mediated receptor transactivation likely exist.

Similar articles

Cited by

References

    1. Ali T., Khan I., Simpson W., Prescott G., Townend J., Smith W., Macleod A. (2007) Incidence and outcomes in acute kidney injury. A comprehensive population-based study. J. Am. Soc. Nephrol. 18, 1292–1298 - PubMed
    1. Eddy A. A. (2000) Molecular basis of renal fibrosis. Pediatr. Nephrol. 15, 290–301 - PubMed
    1. Eddy A. A. (2009) Serine proteases, inhibitors and receptors in renal fibrosis. Thromb. Haemost. 101, 656–664 - PMC - PubMed
    1. Ramachandran R., Noorbakhsh F., Defea K., Hollenberg M. D. (2012) Targeting proteinase-activated receptors. Therapeutic potential and challenges. Nat. Rev. Drug Discov. 11, 69–86 - PubMed
    1. Rothmeier A. S., Ruf W. (2012) Protease-activated receptor 2 signaling in inflammation. Semin. Immunopathol. 34, 133–149 - PubMed

Publication types

MeSH terms