. 2014 Jan;7(1):114-27.
doi: 10.1158/1940-6207.CAPR-13-0289. Epub 2013 Nov 19.

Temporal and spatial evolution of somatic chromosomal alterations: a case-cohort study of Barrett's esophagus

Affiliations

Temporal and spatial evolution of somatic chromosomal alterations: a case-cohort study of Barrett's esophagus

Xiaohong Li et al. Cancer Prev Res (Phila). 2014 Jan.

Abstract

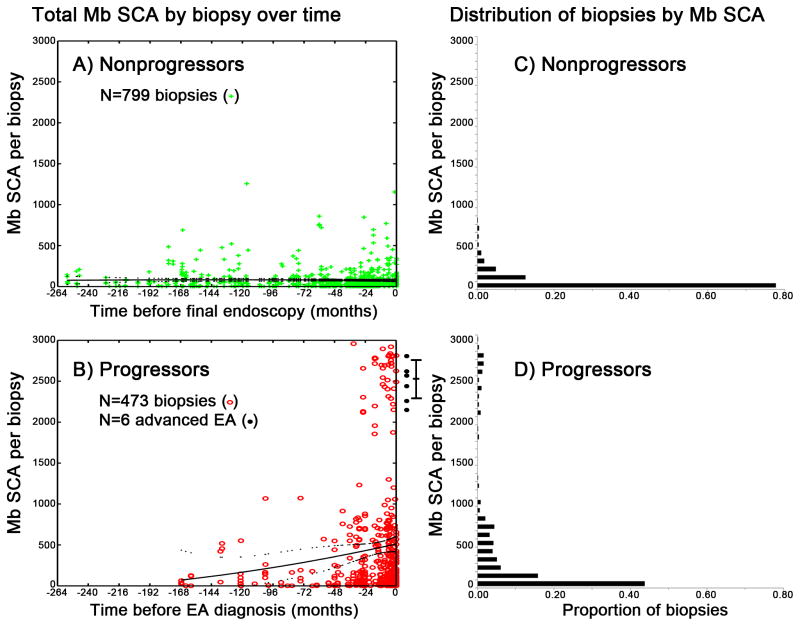
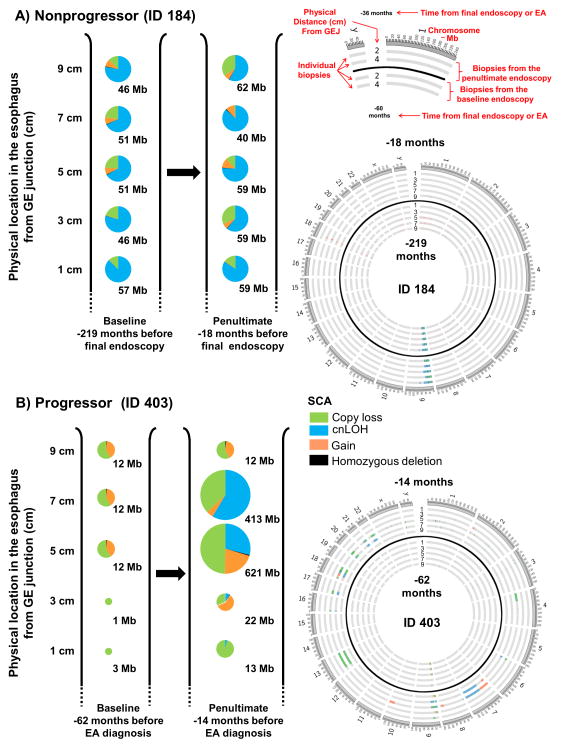
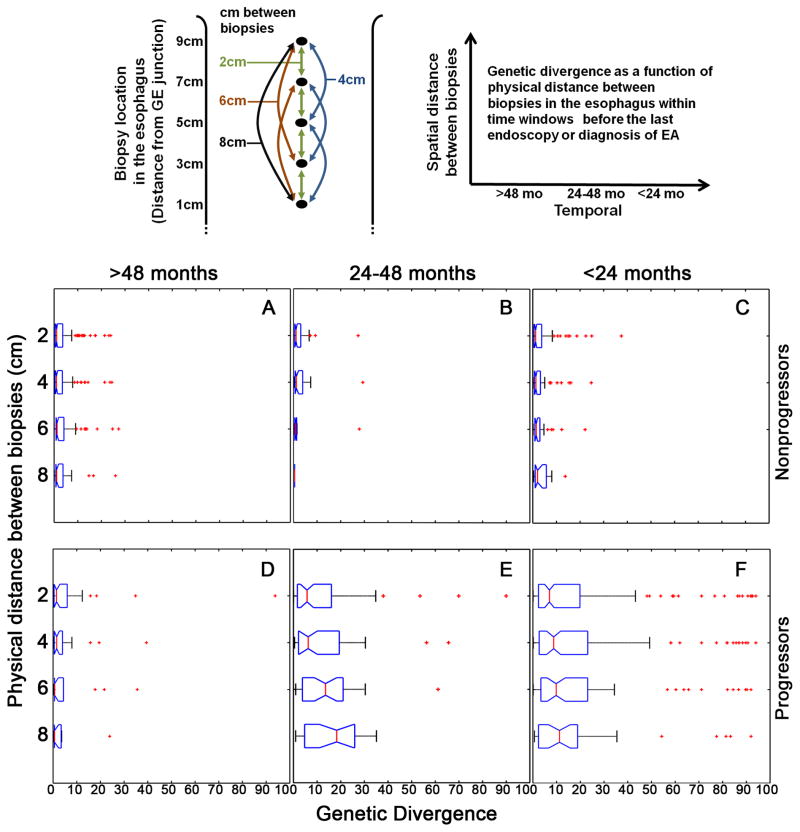
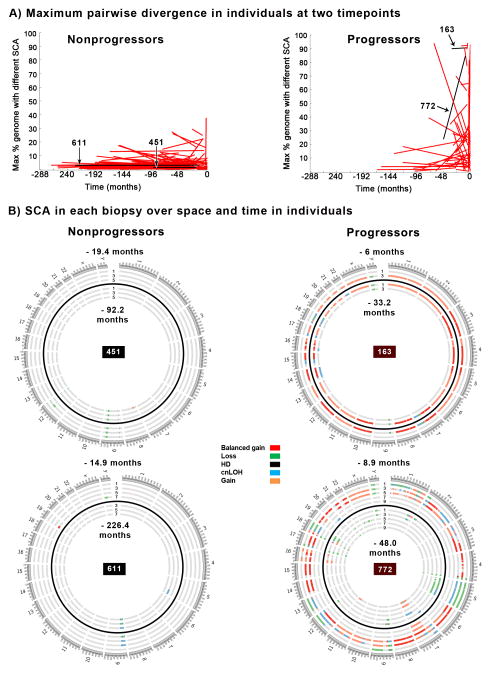
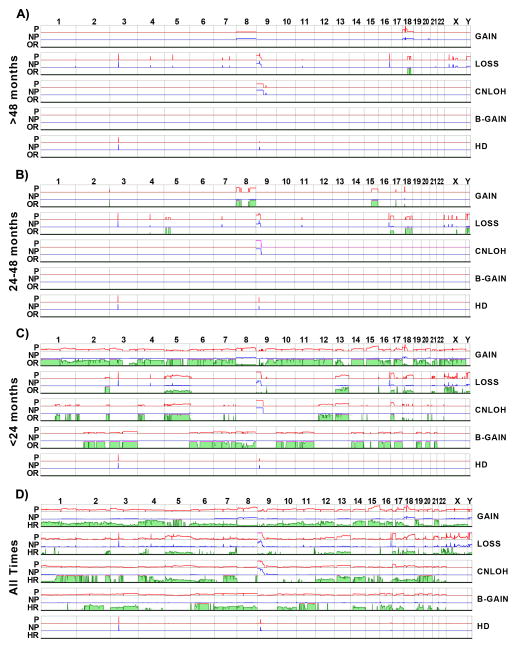
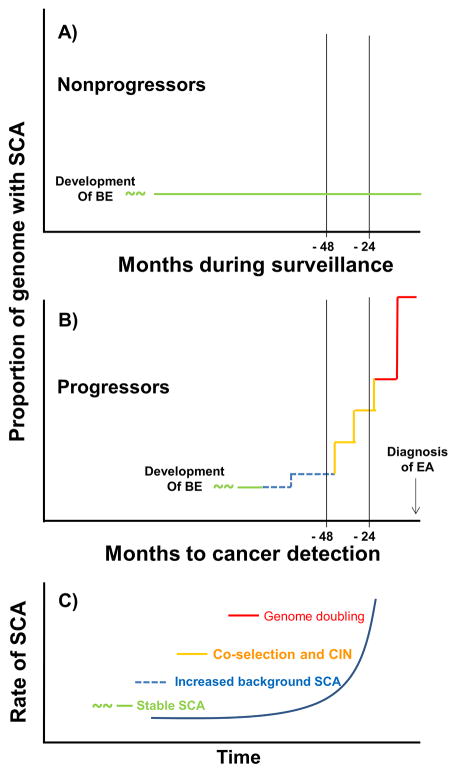
All cancers are believed to arise by dynamic, stochastic somatic genomic evolution with genome instability, generation of diversity, and selection of genomic alterations that underlie multistage progression to cancer. Advanced esophageal adenocarcinomas have high levels of somatic copy number alterations. Barrett's esophagus is a risk factor for developing esophageal adenocarcinoma, and somatic chromosomal alterations (SCA) are known to occur in Barrett's esophagus. The vast majority (∼95%) of individuals with Barrett's esophagus do not progress to esophageal adenocarcinoma during their lifetimes, but a small subset develop esophageal adenocarcinoma, many of which arise rapidly even in carefully monitored patients without visible endoscopic abnormalities at the index endoscopy. Using a well-designed, longitudinal case-cohort study, we characterized SCA as assessed by single-nucleotide polymorphism arrays over space and time in 79 "progressors" with Barrett's esophagus as they approach the diagnosis of cancer and 169 "nonprogressors" with Barrett's esophagus who did not progress to esophageal adenocarcinoma over more than 20,425 person-months of follow-up. The genomes of nonprogressors typically had small localized deletions involving fragile sites and 9p loss/copy neutral LOH that generate little genetic diversity and remained relatively stable over prolonged follow-up. As progressors approach the diagnosis of cancer, their genomes developed chromosome instability with initial gains and losses, genomic diversity, and selection of SCAs followed by catastrophic genome doublings. Our results support a model of differential disease dynamics in which nonprogressor genomes largely remain stable over prolonged periods, whereas progressor genomes evolve significantly increased SCA and diversity within four years of esophageal adenocarcinoma diagnosis, suggesting a window of opportunity for early detection.


Conflict of interest statement

Conflict of interest: The authors declare no conflict of interest.

Figures

Figure 1
Figure 1. Total SCA dynamics in nonprogressor and progressor populations over time
Panels A, B) Total SCA in megabases (Mb) (y-axis) per biopsies obtained at times (x-axis) before the last endoscopy in nonprogressors (Panel A) or before diagnosis of EA in progressors (Panel B. Solid black lines = trend in mean SCA, dotted black lines = 95% CI of the means fitted by quadratic polynomial regression. Six black points right of Panel B are SCA levels from advanced EA surgical resection specimens, with 95% CI of the mean. Panel C) In nonprogressors, many biopsies 105/799 (13%) have <1 Mb SCA per biopsy, and 759/799 (95%) of all nonprogressors biopsies have SCA <283 Mb, indicating that somatic genomic alterations are present in most Barrett’s biopsies but the level of SCA is generally low in nonprogressors. All 799 nonprogressors biopsies are below 1300 Mb SCA. Panel D). In contrast, only 28/473 (6%) progressor biopsies have <1 Mb SCA, and 168/473 (36%) of biopsies sampled before EA in progressors have SCA above 283 Mb (Panel D). There is a significant gap between 1300–1850 Mb, then in progressors we see 43/473 (9%) biopsies above 1850 Mb SCA, all with significant amounts of copy gain, balanced gain, and cnLOH indicative of genome doubling.
Figure 2
Figure 2. Proportion of different types of SCA in spatially separated biopsies over time
SCA amount (Mb) and SCA type measured in spatially separated biopsies in two time points in a nonprogressor (Panel A) and a progressor (Panel B). At each timepoint, one biopsy is depicted as a single pie chart at each two-centimeter (cm) interval from the gastroesophageal junction (GEJ) with each pie chart showing the distribution of SCA types in each biopsy. The size of each pie chart is representational of different amounts of SCA measured in a single biopsy. A schematic is provided for interpretation of the Circos plots (66) with SCA in each biopsy at both timepoints. ID 184 shows the persistence of relatively genomically stable cell populations over a period of almost 16 years in a nonprogressing individual (Panel A). ID 403 shows the development of a cell population with significantly increased SCA during the approximately four years between the two endoscopies. Note the persistence of a cell population at the top of the figure having 12 Mb of SCA (Panel B). GEJ– gastroesophageal junction.
Figure 3
Figure 3. Evolution of genetic diversity over space and time in progressors and nonprogressors
Research biopsies used for this study were obtained according to a systematic predetermined protocol with one biopsy every two centimeters (cm) in the Barrett’s segment without any visible evidence of cancer. The top left example shows all pairwise divergence comparisons between biopsies. Comparisons include four 2cm (green), three 4cm (blue), two 6cm (brown) and one 8cm (black) in the example shown. (Panels A–F) Population level genetic divergence of spatially separated biopsies in each endoscopy within time windows in nonprogressors before the final endoscopy (Panels A–C) and in progressors before or at diagnosis of EA (Panels D–F). For each individual, the proportion of 1 Mb genomic segments with a different SCA call (present or absent) was calculated for all possible paired biopsy comparisons at each endoscopy. The X-axis is the percent of 1 Mb genomic segments with different SCA calls between any two biopsies, for all pairwise comparisons within an endoscopy for each individual and reflects the distribution of the level of heterogeneity among all pairs of biopsies within an individual. The Y-axis is the physical spatial distance between biopsies. For each time window, divergence between biopsies in each spatial category (2cm, 4cm, 6cm, 8+cm apart) was compared. In the >48 month time window there was no significant difference in divergence between nonprogressors and progressors in any spatial category (p>0.313 among all four comparisons, Kruskal-Wallis test, Figure 3A vs. 3D). In contrast, for all spatial categories in both the 24–48 month and <24 month time windows, progressor biopsies had significantly higher divergence than in nonprogressors (p<0.0014 among all eight comparisons, Kruskal-Wallis test, Figure 3B vs. 3E and Figure 3C vs. 3F). In nonprogressors, there was no trend for increasing SCA divergence between biopsies regardless of physical distance apart in the esophagus in >48, 24–48, and <24 month time windows (p=0.149, p=0.692, and p=0.222, respectively, Mann-Kendall trend test, Figure 3A, 3B, 3C). Similarly, in progressors, divergence remains low in the >48 month time window regardless of physical distance (p=0.28, Mann-Kendall trend test, Figure 3D). In contrast, in progressors the 24–48 month time window had a significant trend of increasing divergence with increasing physical distance (p<0.0051, Mann-Kendall trend test, Figure 3E), with divergence remaining equally high in all physical distance categories in the <24 month time window (p=0.279, Mann-Kendall trend test, Figure 3F).
Figure 4
Figure 4. Individual level diversity over time
Maximum genetic divergence of spatially separated biopsies in both endoscopies from the 104 nonprogressors and 57 progressors in whom SCA had been measured in at least two biopsies separated by two centimeters at both timepoints (Panel A). The maximum pairwise divergence between any two biopsies within the same endoscopy is plotted for the baseline and last endoscopy. Typically nonprogressors show selection of a small number of SCA events that have expanded throughout the BE segment and remain stable over long periods of time. Four patient examples are highlighted as black lines in Panel A, and and the SCA for each biopsy for these examples is shown in Panel B. Each concentric ring of the Circos plot shows the SCA for a single biopsy, with the baseline timepoint biopsies shown in the inner rings and the last endoscopy shown in the outer rings, with the two timepoints separated by a black ring. Location of each biopsy every 2 cm in the esophagus is labeled as cm from the GE junction. ID 451 and 611 are typical nonprogressors with expansion of 9p loss or cnLOH and typically 2–5 other small, sub-chromosomal or highly localized regions of SCA. In addition, the typical nonprogressor has small, random SCA events that are detected in one or a few samples but are not selected in the initial expansion and do not persist over time (e.g. ID 451, −92.2 mo, 5 cm, ch 8, and −19.4 mo, 3 cm, ch 12; ID 611 −226 mo, 5 cm, ch 5, and −14.9 mo, 7 cm, ch 19 (Panel B). Progressors with high diversity typically had samples with co-selected events that represent the punctuated stage of neoplastic evolution, and spatially localized genome doubling events such as in IDs 163 and 772 (Panel B). HD=homozygous deletion.
Figure 5
Figure 5. SCA frequency, odds ratios in time windows, and hazard ratio considering all times
Panels A–C) Frequency of SCA in progressors (P, red line) and nonprogressors (NP, blue line) and odds ratio (OR, green) of SCA for EA risk based on data from A) >48 months, B) 24–48 months and C) <24 months before final endoscopy in nonprogressors or detection of EA in progressors. Panel D) Frequency of SCA and hazard ratio (HR, green) for SCA events across the genome based on case-cohort design. Frequency of each SCA event was determined in progressors (P, red line) and nonprogressors (NP, blue line). The HR was calculated for each 1 Mb window across the genome, considering follow-up time and censoring status of each individual. Chromosome number (1 through Y) is indicated along top and SCA type on right. SCA frequencies are shown from 0 and truncated at 0.5; OR and HR range from 0 to 20, with a pink line at the top indicating a ratio greater than 20. HD=homozygous deletion.
Figure 6
Figure 6. Model of somatic evolutionary dynamics of SCA in nonprogressors and progressors
Somatic chromosomal evolution in nonprogressors and progressors begins at an unknown time prior to detection of BE in the clinic. By the time of diagnosis of BE, nonprogressors are characterized by an initial expansion of SCA primarily at fragile sites, including FHIT, CDKN2A and WWOX, and 9p loss or cnLOH that developed prior to clinical detection, which typically remains relatively stable without generating progressive chromosome instability, diversity, or further selection of SCA over prolonged follow-up (green line) (Panel A). Progressor genomes evolve in this background of low SCA (green line) with an increase in SCA compared to nonprogressors that becomes detectable 48 months prior to the diagnosis of EA, with only 18q loss detected at a significantly higher frequency than in nonprogressors before this time (blue dashed line). In the 24–48 months prior to EA diagnosis, total SCA increases markedly (yellow line) with selected larger gains on 8 and 15q and losses on 5p, 17p, 18 and Y conferring increased risk of progression as well as a background of co-selection of large regions of gains and/or losses on different chromosomes that are detected in individual biopsies. This background of co-selection continues to be detected in individual biopsies with SCA <1500 Mb in the 0–24 month window. This is followed by catastrophic genome doublings that result in leaps in SCA to >1850 Mb within 24 months of EA diagnosis (brown line) (Panel B). This model, based upon longitudinal data in humans in vivo, proposes that the rate of SCA accumulation increases in the population of progressors through selection and co-selection of large regions of SCA and catastrophic genome doublings as they approach the diagnosis of EA (Panel C).

References

    1. Pohl H, Welch HG. The role of overdiagnosis and reclassification in the marked increase of esophageal adenocarcinoma incidence. J Natl Cancer Inst. 2005;97:142–6. - PubMed
    1. Dubecz A, Gall I, Solymosi N, Schweigert M, Peters JH, Feith M, et al. Temporal trends in long-term survival and cure rates in esophageal cancer: a SEER database analysis. J Thorac Oncol. 2012;7:443–7. - PubMed
    1. Li Z, Rice TW, Liu X, Goldblum JR, Williams SJ, Rybicki LA, et al. Intramucosal esophageal adenocarcinoma: primum non nocere. J Thorac Cardiovasc Surg. 2013;145:1519–24. 24 e1–3. - PubMed
    1. Rice TW, Zuccaro G, Jr, Adelstein DJ, Rybicki LA, Blackstone EH, Goldblum JR. Esophageal carcinoma: depth of tumor invasion is predictive of regional lymph node status. Ann Thorac Surg. 1998;65:787–92. - PubMed
    1. Prenzel KL, Holscher AH, Drebber U, Agavonova M, Gutschow CA, Bollschweiler E. Prognostic impact of nodal micrometastasis in early esophageal cancer. Eur J Surg Oncol. 2012;38:314–8. - PubMed

Publication types

Supplementary concepts